

Early non-neutralizing, afucosylated antibody responses are associated with COVID-19 severity
- PMID: 35040666
- PMCID: PMC8939764
- DOI: 10.1126/scitranslmed.abm7853
Early non-neutralizing, afucosylated antibody responses are associated with COVID-19 severity
Abstract
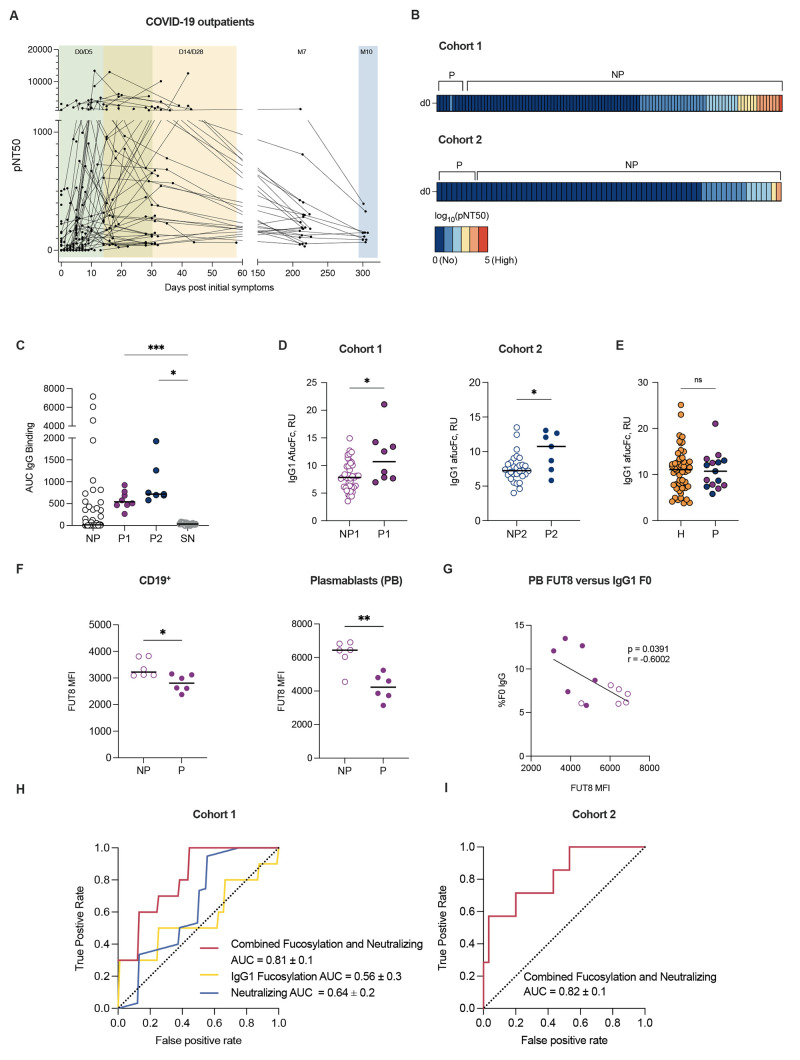
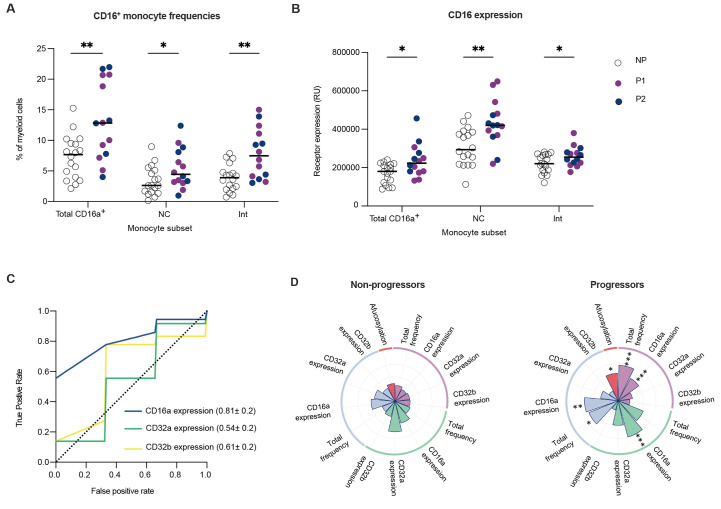
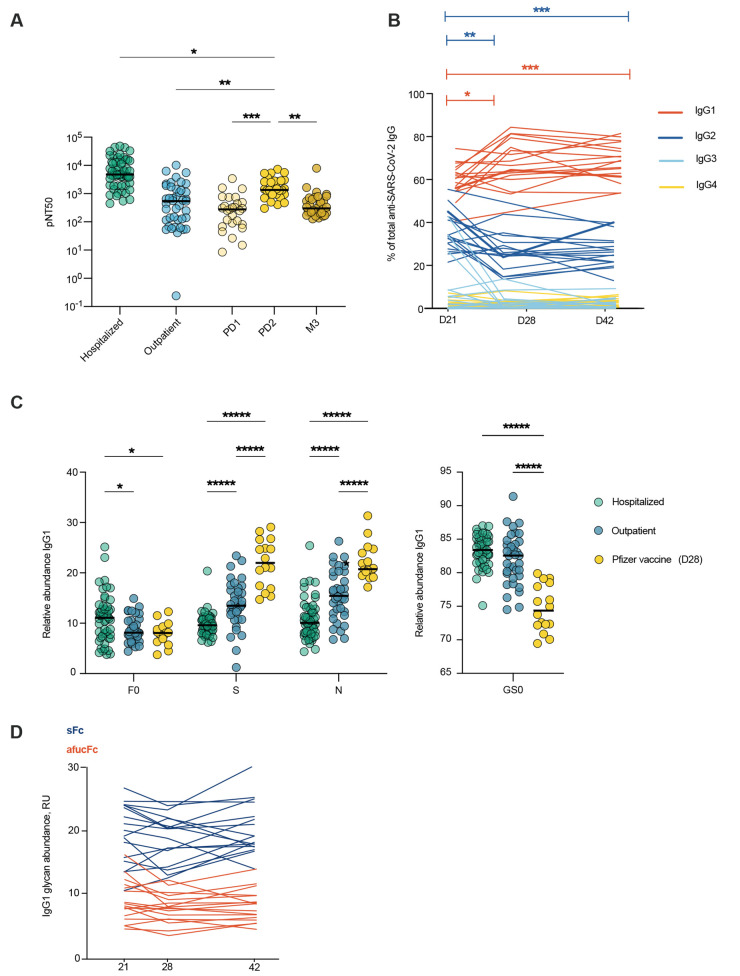
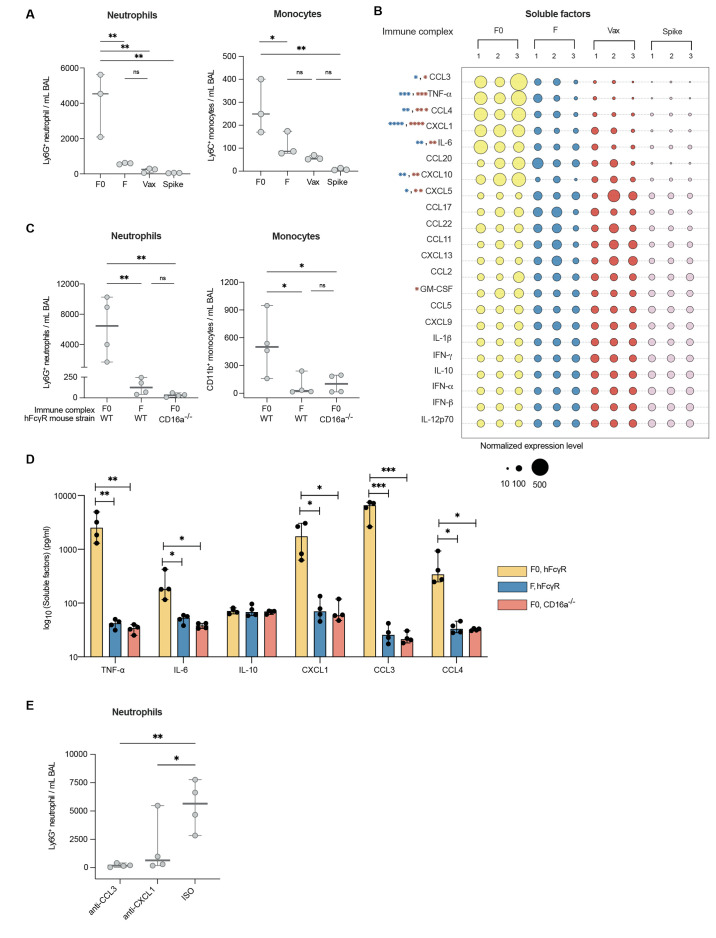
A damaging inflammatory response is implicated in the pathogenesis of severe coronavirus disease 2019 (COVID-19), but mechanisms contributing to this response are unclear. In two prospective cohorts, early non-neutralizing, afucosylated immunoglobulin G (IgG) antibodies specific to severe acute respiratory syndrome coronavirus 2 (SARS-CoV-2) were associated with progression from mild to more severe COVID-19. To study the biology of afucosylated IgG immune complexes, we developed an in vivo model that revealed that human IgG-Fc-gamma receptor (FcγR) interactions could regulate inflammation in the lung. Afucosylated IgG immune complexes isolated from patients with COVID-19 induced inflammatory cytokine production and robust infiltration of the lung by immune cells. In contrast to the antibody structures that were associated with disease progression, antibodies that were elicited by messenger RNA SARS-CoV-2 vaccines were highly fucosylated and enriched in sialylation, both modifications that reduce the inflammatory potential of IgG. Vaccine-elicited IgG did not promote an inflammatory lung response. These results show that human IgG-FcγR interactions regulate inflammation in the lung and define distinct lung activities mediated by the IgG that are associated with protection against, or progression to, severe COVID-19.
Figures
Similar articles
-
Structurally and functionally distinct early antibody responses predict COVID-19 disease trajectory and mRNA vaccine response.bioRxiv [Preprint]. 2021 Dec 27:2021.05.25.445649. doi: 10.1101/2021.05.25.445649. bioRxiv. 2021. PMID: 34075376 Free PMC article. Preprint.
-
Afucosylated IgG characterizes enveloped viral responses and correlates with COVID-19 severity.Science. 2021 Feb 26;371(6532):eabc8378. doi: 10.1126/science.abc8378. Epub 2020 Dec 23. Science. 2021. PMID: 33361116 Free PMC article.
-
SARS-CoV-2 mRNA vaccine induces robust specific and cross-reactive IgG and unequal neutralizing antibodies in naive and previously infected people.Cell Rep. 2022 Feb 1;38(5):110336. doi: 10.1016/j.celrep.2022.110336. Epub 2022 Jan 20. Cell Rep. 2022. PMID: 35090596 Free PMC article.
-
Characterization of SARS-CoV-2-Specific Humoral and Cellular Immune Responses Induced by Inactivated COVID-19 Vaccines in a Real-World Setting.Front Immunol. 2021 Dec 22;12:802858. doi: 10.3389/fimmu.2021.802858. eCollection 2021. Front Immunol. 2021. PMID: 35003131 Free PMC article.
-
Evaluation of Humoral Immune Response after SARS-CoV-2 Vaccination Using Two Binding Antibody Assays and a Neutralizing Antibody Assay.Microbiol Spectr. 2021 Dec 22;9(3):e0120221. doi: 10.1128/Spectrum.01202-21. Epub 2021 Nov 24. Microbiol Spectr. 2021. PMID: 34817223 Free PMC article.
Cited by
-
The IgG glycome of SARS-CoV-2 infected individuals reflects disease course and severity.Front Immunol. 2022 Oct 18;13:993354. doi: 10.3389/fimmu.2022.993354. eCollection 2022. Front Immunol. 2022. PMID: 36389824 Free PMC article.
-
Beyond bNAbs: Uses, Risks, and Opportunities for Therapeutic Application of Non-Neutralising Antibodies in Viral Infection.Antibodies (Basel). 2024 Apr 3;13(2):28. doi: 10.3390/antib13020028. Antibodies (Basel). 2024. PMID: 38651408 Free PMC article. Review.
-
Mechanism of glycoform specificity and in vivo protection by an anti-afucosylated IgG nanobody.Nat Commun. 2023 May 18;14(1):2853. doi: 10.1038/s41467-023-38453-1. Nat Commun. 2023. PMID: 37202422 Free PMC article.
-
Application of machine learning models to identify serological predictors of COVID-19 severity and outcomes.Res Sq [Preprint]. 2023 Nov 13:rs.3.rs-3463155. doi: 10.21203/rs.3.rs-3463155/v1. Res Sq. 2023. Update in: Commun Med (Lond). 2024 Nov 26;4(1):249. doi: 10.1038/s43856-024-00658-w. PMID: 38014049 Free PMC article. Updated. Preprint.
-
BNT162b2 induced neutralizing and non-neutralizing antibody functions against SARSCoV-2 diminish with age.medRxiv [Preprint]. 2022 Aug 16:2022.08.12.22278726. doi: 10.1101/2022.08.12.22278726. medRxiv. 2022. Update in: Cell Rep. 2022 Oct 25;41(4):111544. doi: 10.1016/j.celrep.2022.111544. PMID: 36032979 Free PMC article. Updated. Preprint.
References
-
- Del Valle D. M., Kim-Schulze S., Huang H. H., Beckmann N. D., Nirenberg S., Wang B., Lavin Y., Swartz T. H., Madduri D., Stock A., Marron T. U., Xie H., Patel M., Tuballes K., Van Oekelen O., Rahman A., Kovatch P., Aberg J. A., Schadt E., Jagannath S., Mazumdar M., Charney A. W., Firpo-Betancourt A., Mendu D. R., Jhang J., Reich D., Sigel K., Cordon-Cardo C., Feldmann M., Parekh S., Merad M., Gnjatic S., An inflammatory cytokine signature predicts COVID-19 severity and survival. Nat. Med. 26, 1636–1643 (2020). 10.1038/s41591-020-1051-9 - DOI - PMC - PubMed
-
- Schurink B., Roos E., Radonic T., Barbe E., Bouman C. S. C., de Boer H. H., de Bree G. J., Bulle E. B., Aronica E. M., Florquin S., Fronczek J., Heunks L. M. A., de Jong M. D., Guo L., du Long R., Lutter R., Molenaar P. C. G., Neefjes-Borst E. A., Niessen H. W. M., van Noesel C. J. M., Roelofs J. J. T. H., Snijder E. J., Soer E. C., Verheij J., Vlaar A. P. J., Vos W., van der Wel N. N., van der Wal A. C., van der Valk P., Bugiani M., Viral presence and immunopathology in patients with lethal COVID-19: A prospective autopsy cohort study. Lancet Microbe 1, e290–e299 (2020). 10.1016/S2666-5247(20)30144-0 - DOI - PMC - PubMed
-
- Barnes B. J., Adrover J. M., Baxter-Stoltzfus A., Borczuk A., Cools-Lartigue J., Crawford J. M., Daßler-Plenker J., Guerci P., Huynh C., Knight J. S., Loda M., Looney M. R., McAllister F., Rayes R., Renaud S., Rousseau S., Salvatore S., Schwartz R. E., Spicer J. D., Yost C. C., Weber A., Zuo Y., Egeblad M., Targeting potential drivers of COVID-19: Neutrophil extracellular traps. J. Exp. Med. 217, e20200652 (2020). 10.1084/jem.20200652 - DOI - PMC - PubMed
Publication types
MeSH terms
Substances
Grants and funding
- U24 CA224319/CA/NCI NIH HHS/United States
- U01 DK124165/DK/NIDDK NIH HHS/United States
- U19 AI111825/AI/NIAID NIH HHS/United States
- R01 AI139119/AI/NIAID NIH HHS/United States
- U19 AI167903/AI/NIAID NIH HHS/United States
- R01 AI125197/AI/NIAID NIH HHS/United States
- T32 AI007290/AI/NIAID NIH HHS/United States
- K24 AI144048/AI/NIAID NIH HHS/United States
- U54 CA260517/CA/NCI NIH HHS/United States
- K23 AI076614/AI/NIAID NIH HHS/United States
- U19 AI057229/AI/NIAID NIH HHS/United States
- P01 AI153559/AI/NIAID NIH HHS/United States
- U01 AI150741/AI/NIAID NIH HHS/United States
LinkOut - more resources
Full Text Sources
Other Literature Sources
Medical
Miscellaneous
