Review
. 2022 Apr;303(1):35-47.
doi: 10.1148/radiol.204371. Epub 2022 Jan 18.

O-RADS MRI Risk Stratification System: Guide for Assessing Adnexal Lesions from the ACR O-RADS Committee

Affiliations
Review

O-RADS MRI Risk Stratification System: Guide for Assessing Adnexal Lesions from the ACR O-RADS Committee

Elizabeth A Sadowski et al. Radiology. 2022 Apr.

Erratum in

Abstract

MRI plays an important role as a secondary test or problem-solving modality in the evaluation of adnexal lesions depicted at US. MRI has increased specificity compared with US, decreasing the number of false-positive diagnoses for malignancy and thereby avoiding unnecessary or over-extensive surgery in patients with benign lesions or borderline tumors, while women with possible malignancies can be expeditiously referred for oncologic surgical evaluation. The Ovarian-Adnexal Reporting and Data System (O-RADS) MRI Committee is an international collaborative effort formed under the direction of the American College of Radiology and includes a diverse group of experts on adnexal imaging and management who developed the O-RADS MRI risk stratification system. This scoring system assigns a probability of malignancy based on the MRI features of an adnexal lesion and provides information to facilitate optimal patient management. The widespread implementation of a codified reporting system will lead to improved interpretation agreement and standardized communication between radiologists and referring physicians. In addition, it will allow for high-quality multi-institutional collaborations-an important unmet need that has hampered the performance of high-quality research in this area in the past. This article provides guidelines on using the O-RADS MRI risk stratification system in clinical practice, as well as in the educational and research settings.


Conflict of interest statement

Disclosures of Conflicts of Interest: E.A.S. No relevant relationships. I.T.N. Payment from CFIM education learning; payment for lectures including service on speakers bureaus from GE, Hologic, Canon, Guerbet, and Siemens; payment for development of educational presentations from CFIM and ESOR; travel/accommodations/meeting expenses unrelated to activities listed from GE. A.R. NIHR grants to institution; travel/accommodations/meeting expenses unrelated to activities listed from Guerbet/European Society of Radiology. K.E.M. No relevant relationships. R.F. Payment for lectures including service on speakers bureaus from ESUR/European Society of Radiology. P.J. Expert testimony from MCIC Vermont; payment for lectures including service on speakers bureaus from Society of Radiologists in Ultrasound. S.N. No relevant relationships. E.S.S. Consultant for Covera Health, Icon Medical Imaging, Bioclinica, and Invicros. C.R. No relevant relationships.

Figures

None
Graphical abstract
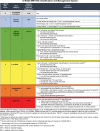
Image shows Ovarian-Adnexal Reporting and Data System (O-RADS) MRI risk
stratification system. DCE = dynamic contrast enhanced, DWI = diffusion-weighted
imaging, N/A = not applicable, PPV = positive predictive value. Reprinted, with
permission, from the American College of Radiology.
Figure 1:
Image shows Ovarian-Adnexal Reporting and Data System (O-RADS) MRI risk stratification system. DCE = dynamic contrast enhanced, DWI = diffusion-weighted imaging, N/A = not applicable, PPV = positive predictive value. Reprinted, with permission, from the American College of Radiology.
Graph depicts the visual differences between low-risk,
intermediate-risk, and high-risk time-intensity curves (TICs). A low-risk
TIC is defined as an increase in the signal intensity of solid tissue after
contrast material administration, slower than that in the myometrium,
without a well-defined shoulder and no plateau. An intermediate-risk TIC has
a moderate initial rise in the signal intensity of solid tissue, with a
slope slower than or equal to that of the myometrium, with a shoulder and
plateau. A high-risk TIC has a brisk initial rise in the signal intensity of
solid tissue, with a slope greater than myometrium, with a shoulder and
plateau.
Figure 2:
Graph depicts the visual differences between low-risk, intermediate-risk, and high-risk time-intensity curves (TICs). A low-risk TIC is defined as an increase in the signal intensity of solid tissue after contrast material administration, slower than that in the myometrium, without a well-defined shoulder and no plateau. An intermediate-risk TIC has a moderate initial rise in the signal intensity of solid tissue, with a slope slower than or equal to that of the myometrium, with a shoulder and plateau. A high-risk TIC has a brisk initial rise in the signal intensity of solid tissue, with a slope greater than myometrium, with a shoulder and plateau.
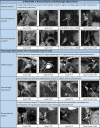
Image shows examples of Ovarian-Adnexal Reporting and Data System
(O-RADS) MRI 1 risk score. * = In postmenopausal women, normal
ovaries can contain very small residual follicles, and if the radiologist
subjectively assesses the ovaries as normal, the ovaries can be categorized
as O-RADS MRI 1. DWI = diffusion-weighted imaging, FS = fat saturated, T1WI
= T1-weighted imaging, T2WI = T2-weighted imaging.
Figure 3:
Image shows examples of Ovarian-Adnexal Reporting and Data System (O-RADS) MRI 1 risk score. * = In postmenopausal women, normal ovaries can contain very small residual follicles, and if the radiologist subjectively assesses the ovaries as normal, the ovaries can be categorized as O-RADS MRI 1. DWI = diffusion-weighted imaging, FS = fat saturated, T1WI = T1-weighted imaging, T2WI = T2-weighted imaging.
Image shows examples of Ovarian-Adnexal Reporting and Data System
(O-RADS) MRI 2 risk score. ^ = Unilocular cysts with simple or hemorrhagic
fluid 3 cm or smaller in a premenopausal woman would be classified as O-RADS
MRI 1. ^^ = Minimal enhancement of Rokitansky nodule in lesion containing
lipid does not change to O-RADS MRI 4. DWI = diffusion-weighted imaging, FS
= fat saturated, PPV = positive predictive value, T1WI = T1-weighted
imaging, T2WI = T2-weighted imaging.
Figure 4:
Image shows examples of Ovarian-Adnexal Reporting and Data System (O-RADS) MRI 2 risk score. ^ = Unilocular cysts with simple or hemorrhagic fluid 3 cm or smaller in a premenopausal woman would be classified as O-RADS MRI 1. ^^ = Minimal enhancement of Rokitansky nodule in lesion containing lipid does not change to O-RADS MRI 4. DWI = diffusion-weighted imaging, FS = fat saturated, PPV = positive predictive value, T1WI = T1-weighted imaging, T2WI = T2-weighted imaging.
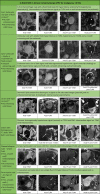
Image shows examples of Ovarian-Adnexal Reporting and Data System
(O-RADS) MRI 3 risk score. ^^ = Hemorrhagic cyst smaller than 3 cm in a
premenopausal woman would be classified as O-RADS MRI 2. DCE = dynamic
contrast enhanced, DWI = diffusion-weighted imaging, FS = fat saturated, PPV
= positive predictive value, TIC = time-intensity curve, T1WI = T1-weighted
imaging, T2WI = T2-weighted imaging.
Figure 5:
Image shows examples of Ovarian-Adnexal Reporting and Data System (O-RADS) MRI 3 risk score. ^^ = Hemorrhagic cyst smaller than 3 cm in a premenopausal woman would be classified as O-RADS MRI 2. DCE = dynamic contrast enhanced, DWI = diffusion-weighted imaging, FS = fat saturated, PPV = positive predictive value, TIC = time-intensity curve, T1WI = T1-weighted imaging, T2WI = T2-weighted imaging.
Image shows examples of Ovarian-Adnexal Reporting and Data System
(O-RADS) MRI 4 risk score. DCE = dynamic contrast enhanced, DWI =
diffusion-weighted imaging, FS = fat saturated, PPV = positive predictive
value, TIC = time-intensity curve, T1WI = T1-weighted imaging, T2WI =
T2-weighted imaging.
Figure 6:
Image shows examples of Ovarian-Adnexal Reporting and Data System (O-RADS) MRI 4 risk score. DCE = dynamic contrast enhanced, DWI = diffusion-weighted imaging, FS = fat saturated, PPV = positive predictive value, TIC = time-intensity curve, T1WI = T1-weighted imaging, T2WI = T2-weighted imaging.
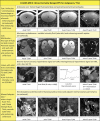
Image shows examples of Ovarian-Adnexal Reporting and Data System
(O-RADS) MRI 5 risk score. DCE = dynamic contrast enhanced, DWI =
diffusion-weighted imaging, FS = fat saturated, PPV = positive predictive
value, TIC = time-intensity curve, T1WI = T1-weighted imaging, T2WI =
T2-weighted imaging.
Figure 7:
Image shows examples of Ovarian-Adnexal Reporting and Data System (O-RADS) MRI 5 risk score. DCE = dynamic contrast enhanced, DWI = diffusion-weighted imaging, FS = fat saturated, PPV = positive predictive value, TIC = time-intensity curve, T1WI = T1-weighted imaging, T2WI = T2-weighted imaging.

Comment in

References

    1. Andreotti RF , Timmerman D , Strachowski LM , et al . O-RADS US Risk Stratification and Management System: A Consensus Guideline from the ACR Ovarian-Adnexal Reporting and Data System Committee . Radiology 2020. ; 294 ( 1 ): 168 – 185 . - PubMed
    1. Levine D , Brown DL , Andreotti RF , et al . Management of asymptomatic ovarian and other adnexal cysts imaged at US Society of Radiologists in Ultrasound consensus conference statement . Ultrasound Q 2010. ; 26 ( 3 ): 121 – 131 . - PubMed
    1. Timmerman D , Van Calster B , Testa A , et al . Predicting the risk of malignancy in adnexal masses based on the Simple Rules from the International Ovarian Tumor Analysis group . Am J Obstet Gynecol 2016. ; 214 ( 4 ): 424 – 437 . - PubMed
    1. Timmerman D , Ameye L , Fischerova D , et al . Simple ultrasound rules to distinguish between benign and malignant adnexal masses before surgery: prospective validation by IOTA group . BMJ 2010. ; 341 c6839 . - PMC - PubMed
    1. Sadowski EA , Paroder V , Patel-Lippmann K , et al . Indeterminate Adnexal Cysts at US: Prevalence and Characteristics of Ovarian Cancer . Radiology 2018. ; 287 ( 3 ): 1041 – 1049 . - PubMed

Publication types

LinkOut - more resources