. 2022 Apr;303(1):80-89.
doi: 10.1148/radiol.210817. Epub 2022 Jan 18.

Semisupervised Training of a Brain MRI Tumor Detection Model Using Mined Annotations

Collaborators, Affiliations

Semisupervised Training of a Brain MRI Tumor Detection Model Using Mined Annotations

Nathaniel C Swinburne et al. Radiology. 2022 Apr.

Abstract

Background Artificial intelligence (AI) applications for cancer imaging conceptually begin with automated tumor detection, which can provide the foundation for downstream AI tasks. However, supervised training requires many image annotations, and performing dedicated post hoc image labeling is burdensome and costly. Purpose To investigate whether clinically generated image annotations can be data mined from the picture archiving and communication system (PACS), automatically curated, and used for semisupervised training of a brain MRI tumor detection model. Materials and Methods In this retrospective study, the cancer center PACS was mined for brain MRI scans acquired between January 2012 and December 2017 and included all annotated axial T1 postcontrast images. Line annotations were converted to boxes, excluding boxes shorter than 1 cm or longer than 7 cm. The resulting boxes were used for supervised training of object detection models using RetinaNet and Mask region-based convolutional neural network (R-CNN) architectures. The best-performing model trained from the mined data set was used to detect unannotated tumors on training images themselves (self-labeling), automatically correcting many of the missing labels. After self-labeling, new models were trained using this expanded data set. Models were scored for precision, recall, and F1 using a held-out test data set comprising 754 manually labeled images from 100 patients (403 intra-axial and 56 extra-axial enhancing tumors). Model F1 scores were compared using bootstrap resampling. Results The PACS query extracted 31 150 line annotations, yielding 11 880 boxes that met inclusion criteria. This mined data set was used to train models, yielding F1 scores of 0.886 for RetinaNet and 0.908 for Mask R-CNN. Self-labeling added 18 562 training boxes, improving model F1 scores to 0.935 (P < .001) and 0.954 (P < .001), respectively. Conclusion The application of semisupervised learning to mined image annotations significantly improved tumor detection performance, achieving an excellent F1 score of 0.954. This development pipeline can be extended for other imaging modalities, repurposing unused data silos to potentially enable automated tumor detection across radiologic modalities. © RSNA, 2022 Online supplemental material is available for this article.


Conflict of interest statement

Disclosures of conflicts of interest: N.C.S. chair of the Radiology Data Governance Committee at Memorial Sloan Kettering Cancer Center. V.Y. no relevant relationships. J.K. no relevant relationships. Y.R.C. no relevant relationships. D.C.G. no relevant relationships. J.T.Y. no relevant relationships. N.M. grant from GT Medical Technologies, consulting fees from AstraZeneca. J.S. no relevant relationships. J.T. no relevant relationships. V.H. no relevant relationships. S.S.H. no relevant relationships. S.K. no relevant relationships. J.L. no relevant relationships. K.J. no relevant relationships. K.P. no relevant relationships. J.G. no relevant relationships. S.P.S. consulting fees from and stock options in Canexia Health. A.I.H. owner and president of fMRI Consultants. R.J.Y. grants from Agios; consulting fees from Agios, Puma, NordicNeuroLab, and ICON.

Figures

None
Graphical abstract
Flow diagram shows data inclusion and exclusion criteria for the baseline
training and test data sets. Additional image annotations were subsequently
added to the training data set via the self-labeling method, as described. T1C+
= postcontrast T1-weighted images.
Figure 1:
Flow diagram shows data inclusion and exclusion criteria for the baseline training and test data sets. Additional image annotations were subsequently added to the training data set via the self-labeling method, as described. T1C+ = postcontrast T1-weighted images.
Example of the automated line annotation to bounding box transformation.
(A) The cystic and solid high-grade glioma is annotated with two line
measurements mined from the picture archiving and communication system. (B) The
curation pipeline geometrically squares the line annotations to generate two
overlapping bounding boxes. (C) These, in turn, are converted to a single
bounding box encompassing the entire lesion.
Figure 2:
Example of the automated line annotation to bounding box transformation. (A) The cystic and solid high-grade glioma is annotated with two line measurements mined from the picture archiving and communication system. (B) The curation pipeline geometrically squares the line annotations to generate two overlapping bounding boxes. (C) These, in turn, are converted to a single bounding box encompassing the entire lesion.
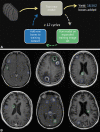
(A) Schematic drawing of the semisupervised learning (self-labeling)
approach to automated tumor detection. The baseline model trained from noisy
incompletely labeled mined images is used to identify unlabeled tumors on an
expanded training image set containing 213 652 axial postcontrast
T1-weighted images. After this cycle, a new detection model is trained from
scratch using the expanded bounding box training data set, which is used to
identify additional unlabeled tumors on the training image set. Twelve
self-labeling cycles were completed, increasing the number of training bounding
boxes from 10 623 to 29 185. (B) Example training bounding boxes
added during self-labeling process. Blue boxes represent new lesion annotations
added during self-labeling. Green boxes are baseline training annotations
automatically generated from line annotations mined from the picture archiving
and communication system.
Figure 3:
(A) Schematic drawing of the semisupervised learning (self-labeling) approach to automated tumor detection. The baseline model trained from noisy incompletely labeled mined images is used to identify unlabeled tumors on an expanded training image set containing 213 652 axial postcontrast T1-weighted images. After this cycle, a new detection model is trained from scratch using the expanded bounding box training data set, which is used to identify additional unlabeled tumors on the training image set. Twelve self-labeling cycles were completed, increasing the number of training bounding boxes from 10 623 to 29 185. (B) Example training bounding boxes added during self-labeling process. Blue boxes represent new lesion annotations added during self-labeling. Green boxes are baseline training annotations automatically generated from line annotations mined from the picture archiving and communication system.
(A) Precision-recall and (B) free-response receiver operating
characteristic curves for each detection model. AUC = area under the receiver
operating characteristic curve, R-CNN = region-based convolutional neural
network.
Figure 4:
(A) Precision-recall and (B) free-response receiver operating characteristic curves for each detection model. AUC = area under the receiver operating characteristic curve, R-CNN = region-based convolutional neural network.
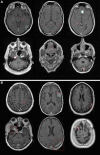
Representative false-positive and false-negative predictions from the
best-performing Mask region-based convolutional neural network detection model
trained using the self-labeling expanded training data set. (A) False-positive
predictions included choroid plexus (top left and top right), superior sagittal
sinus imaged in cross section (bottom right), small vessel loops (top middle),
petrous apex (bottom left), and apparent artifact within the mobile tongue
(bottom middle). (B) False-negative predictions included extra-axial tumors (top
right, bottom left, and bottom middle), probably reflecting a relatively limited
representation of these types of lesions within the training data set, and
faintly enhancing (top left) and leptomeningeal (top middle and bottom right)
lesions. Solid boxes represent ground truth, and dashed boxes represent model
predictions. White solid boxes are correctly detected ground truth boxes. Red
solid boxes are for false-negative predictions. Red dashed boxes are for
false-positive predictions. Dashed blue boxes are for true-positive
predictions.
Figure 5:
Representative false-positive and false-negative predictions from the best-performing Mask region-based convolutional neural network detection model trained using the self-labeling expanded training data set. (A) False-positive predictions included choroid plexus (top left and top right), superior sagittal sinus imaged in cross section (bottom right), small vessel loops (top middle), petrous apex (bottom left), and apparent artifact within the mobile tongue (bottom middle). (B) False-negative predictions included extra-axial tumors (top right, bottom left, and bottom middle), probably reflecting a relatively limited representation of these types of lesions within the training data set, and faintly enhancing (top left) and leptomeningeal (top middle and bottom right) lesions. Solid boxes represent ground truth, and dashed boxes represent model predictions. White solid boxes are correctly detected ground truth boxes. Red solid boxes are for false-negative predictions. Red dashed boxes are for false-positive predictions. Dashed blue boxes are for true-positive predictions.
Example of three-dimensional lesion identifications after automatic
linking of adjacent two-dimensional boxes. Several consecutive held-out test
images from one MRI series are shown through the posterior fossa, simulating
model performance on a full stack of contiguous axial postcontrast T1-weighted
images. Yellow boxes denote the predictions of the Mask region-based
convolutional neural network model after self-labeling. Each prediction box
includes an automatically generated lesion identification and confidence score.
Green boxes denote ground truth annotations generated from mined tumor line
annotations.
Figure 6:
Example of three-dimensional lesion identifications after automatic linking of adjacent two-dimensional boxes. Several consecutive held-out test images from one MRI series are shown through the posterior fossa, simulating model performance on a full stack of contiguous axial postcontrast T1-weighted images. Yellow boxes denote the predictions of the Mask region-based convolutional neural network model after self-labeling. Each prediction box includes an automatically generated lesion identification and confidence score. Green boxes denote ground truth annotations generated from mined tumor line annotations.

References

    1. Bi WL , Hosny A , Schabath MB , et al . Artificial intelligence in cancer imaging: Clinical challenges and applications . CA Cancer J Clin 2019. ; 69 ( 2 ): 127 – 157 . - PMC - PubMed
    1. Tajbakhsh N , Jeyaseelan L , Li Q , Chiang J , Wu Z , Ding X . Embracing Imperfect Datasets: A Review of Deep Learning Solutions for Medical Image Segmentation . Arxiv 1908.10454 [preprint] http://arxiv.org/abs/1908.10454. Posted February 11, 2020. Accessed November 17, 2020 . - PubMed
    1. He K , Gkioxari G , Dollár P , Girshick R . Mask R-CNN . Arxiv 1703.06870 [preprint] http://arxiv.org/abs/1703.06870. Posted January 24, 2018. Accessed November 5, 2019 . - PubMed
    1. Naphade M , Chang MC , Sharma A , et al . The 2018 NVIDIA AI City Challenge. 53–60 . Paper presented at: IEEE Conference on Computer Vision and Pattern Recognition (CVPR) Workshops ; 2018 ; Salt Lake City, Utah . https://openaccess.thecvf.com/content_cvpr_2018_workshops/w3/html/Naphad... Published 2018. Accessed November 12, 2020 .
    1. AlBadawy EA , Saha A , Mazurowski MA . Deep learning for segmentation of brain tumors: Impact of cross-institutional training and testing . Med Phys 2018. ; 45 ( 3 ): 1150 – 1158 . - PubMed

Publication types

LinkOut - more resources