

massNet: integrated processing and classification of spatially resolved mass spectrometry data using deep learning for rapid tumor delineation
- PMID: 35040929
- PMCID: PMC8963284
- DOI: 10.1093/bioinformatics/btac032
massNet: integrated processing and classification of spatially resolved mass spectrometry data using deep learning for rapid tumor delineation
Abstract
Motivation: Mass spectrometry imaging (MSI) provides rich biochemical information in a label-free manner and therefore holds promise to substantially impact current practice in disease diagnosis. However, the complex nature of MSI data poses computational challenges in its analysis. The complexity of the data arises from its large size, high-dimensionality and spectral nonlinearity. Preprocessing, including peak picking, has been used to reduce raw data complexity; however, peak picking is sensitive to parameter selection that, perhaps prematurely, shapes the downstream analysis for tissue classification and ensuing biological interpretation.
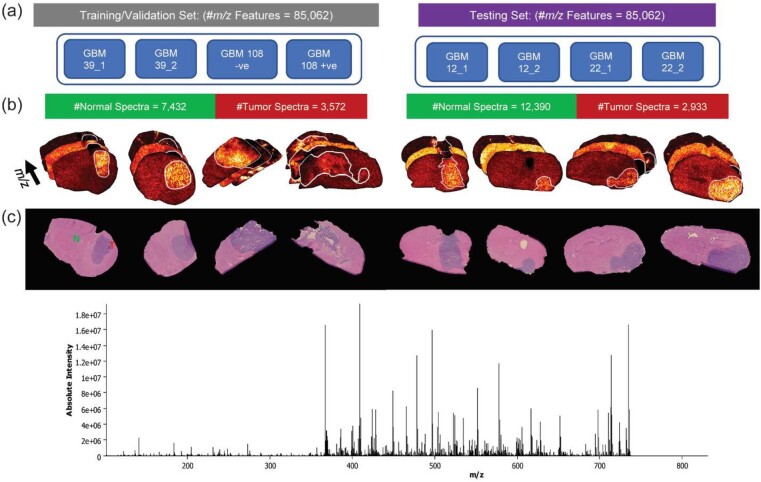
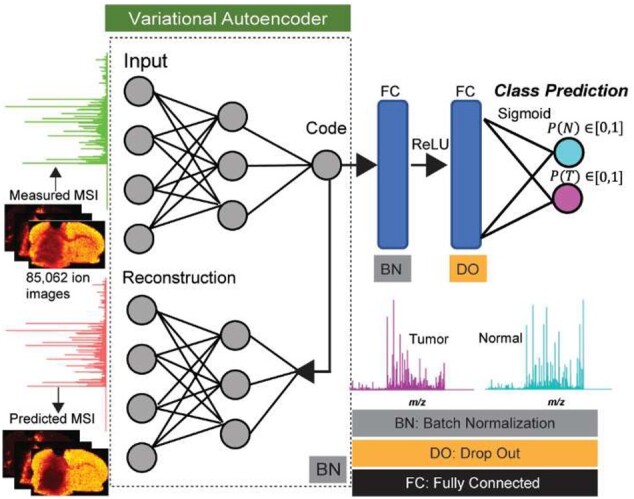
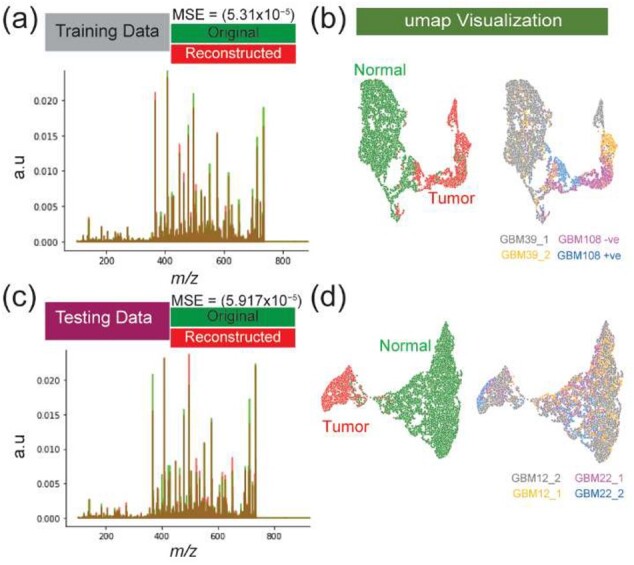
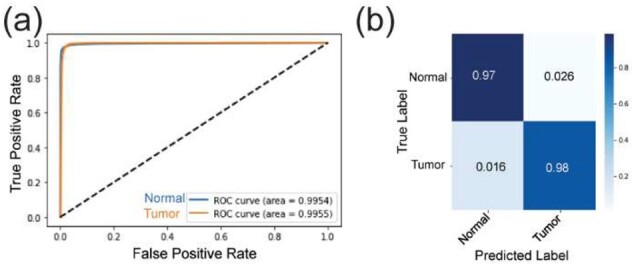
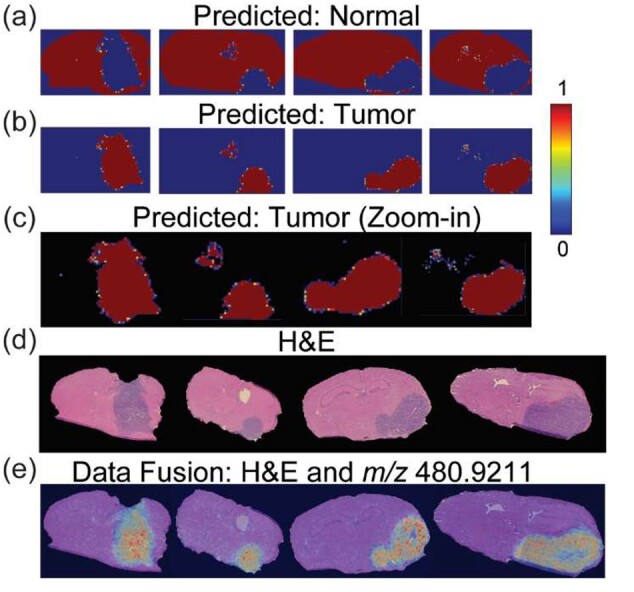
Results: We propose a deep learning model, massNet, that provides the desired qualities of scalability, nonlinearity and speed in MSI data analysis. This deep learning model was used, without prior preprocessing and peak picking, to classify MSI data from a mouse brain harboring a patient-derived tumor. The massNet architecture established automatically learning of predictive features, and automated methods were incorporated to identify peaks with potential for tumor delineation. The model's performance was assessed using cross-validation, and the results demonstrate higher accuracy and a substantial gain in speed compared to the established classical machine learning method, support vector machine.
Availability and implementation: https://github.com/wabdelmoula/massNet. The data underlying this article are available in the NIH Common Fund's National Metabolomics Data Repository (NMDR) Metabolomics Workbench under project id (PR001292) with http://dx.doi.org/10.21228/M8Q70T.
Supplementary information: Supplementary data are available at Bioinformatics online.
© The Author(s) 2022. Published by Oxford University Press. All rights reserved. For permissions, please e-mail: journals.permissions@oup.com.
Figures
References
-
- Abadi M. et al. (2016) TensorFlow: a system for large-scale machine learning. In: 12th USENIX Symposium on Operating Systems Design and Implementation (OSDI’16), USA, Vol. 16, pp. 265–283.
-
- Abdelmoula W.M. et al. (2014) Automatic generic registration of mass spectrometry imaging data to histology using nonlinear stochastic embedding. Anal. Chem., 86, 9204–9211. - PubMed
-
- Addie R.D. et al. (2015) Current state and future challenges of mass spectrometry imaging for clinical research. Anal. Chem., 87, 6426–6433. - PubMed
Publication types
MeSH terms
Grants and funding
LinkOut - more resources
Full Text Sources
Medical
