. 2022 Jan;11(1):e12186.
doi: 10.1002/jev2.12186.

Highly-metastatic colorectal cancer cell released miR-181a-5p-rich extracellular vesicles promote liver metastasis by activating hepatic stellate cells and remodelling the tumour microenvironment

Affiliations

Highly-metastatic colorectal cancer cell released miR-181a-5p-rich extracellular vesicles promote liver metastasis by activating hepatic stellate cells and remodelling the tumour microenvironment

Senlin Zhao et al. J Extracell Vesicles. 2022 Jan.

Abstract

Liver metastasis of colorectal cancer (CRLM) is the most common cause of CRC-related mortality, and is typically caused by interactions between CRC cells and the tumour microenvironment (TME) in the liver. However, the molecular mechanisms underlying the crosstalk between tumour-derived extracellular vesicle (EV) miRNAs and the TME in CRLM have yet to be fully elucidated. The present study demonstrated that highly metastatic CRC cells released more miR-181a-5p-rich EVs than cells which exhibit a low metastatic potential, in-turn promoting CRLM. Additionally, we verified that FUS mediated packaging of miR-181a-5p into CRC EVs, which in-turn persistently activated hepatic stellate cells (HSCs) by targeting SOCS3 and activating the IL6/STAT3 signalling pathway. Activated HSCs could secrete the chemokine CCL20 and further activate a CCL20/CCR6/ERK1/2/Elk-1/miR-181a-5p positive feedback loop, resulting in reprogramming of the TME and the formation of pre-metastatic niches in CRLM. Clinically, high levels of serum EV containing miR-181a-5p was positively correlated with liver metastasis in CRC patients. Taken together, highly metastatic CRC cells-derived EVs rich in miR-181a-5p could activate HSCs and remodel the TME, thereby facilitating liver metastasis in CRC patients. These results provide novel insight into the mechanism underlying liver metastasis in CRC.

Keywords: CCL20/CCR6/ERK1/2/Elk-1/miR-181a-5p feedback loop; colorectal liver metastasis; extracellular vesicle; hepatic stellate cell; miR-181a-5p; tumour microenvironment.


Conflict of interest statement

The authors declare that they have no conflicts of interest.

Figures

FIGURE 1
FIGURE 1
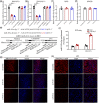
EVs derived from highly metastatic CRC cells mediate the activation of HSCs. The phenotype of EVs derived from two weakly‐metastatic CRC cell lines (HT29 and SW480) and two highly‐metastatic CRC cell lines (RKO and SW620) were analyzed by electron microscopy (a) and nanoparticle tracking analysis by Nano Sight (b); yellow arrows indicate representative EVs. (c) WB analysis of typical biomarkers of EVs in the four CRC cell lines. (d) LX2 cells were incubated with DiO‐labelled EVs (25 μg/ml) from CRC cell lines (HT29, SW480, RKO, SW620) for 24 h, and representative immunofluorescence images show the delivery of DiO‐labelled CRC cell‐derived EVs (green) into Dil‐labelled LX2 cells (red); yellow arrows indicate EVs. (e) Transwell assays were used to determine the role of EVs (equal quantities) derived from different CRC cells on the invasive ability of LX2 cells; scale bar: 50 μm. (f) The expression levels of pro‐inflammatory genes were determined by qPCR in LX2 cells, which were co‐cultured with EVs from different CRC cells. (g) Representative images of ultrasound detection of liver metastases 9 weeks after injecting HCT8 cells co‐cultured with EVs derived from different CRC cells into the spleens of nude mice. Left panel, without liver metastasis (None LM); right panel, with liver metastasis (yellow arrow, LM). (h) Representative image of HE staining for liver metastases in nude mice (green arrows: metastatic tumour node; black arrow: normal liver cell). (i) Number of metastatic colonies in the livers of nude mice from different groups based on ultrasound detection and HE staining. (j) WB analysis of the ECM proteins (α‐SMA, fibronectin, vitronectin and tenascin C) in the liver metastases of mice from each group (* < 0.05; ** < 0.01; *** < 0.001)
FIGURE 2
FIGURE 2
Highly metastatic EVs rich in miR‐181a‐5p derived from CRC cells regulate the activation of HSCs. (a) Microarray analysis of the miRNA expression profiles between EVs from highly‐metastatic CRC cells and those from weakly‐metastatic CRC cells; the data have been uploaded to GEO (accession no. GSE141997). (b) The expression levels of miR‐181a‐5p in EVs derived from different CRC cell lines were detected by qPCR. (c) LX2 cells were incubated with normal medium (NM), normal medium with EVs‐depleted using an inhibitor of EV secretion (GW4869), or conditioned medium (CM) from RKO/SW620 cells with or without EVs‐depleted. Then miR‐181a‐5p expression levels were examined by qPCR. (d) LX2 cells were co‐cultured with EVs derived from HT29/SW480/RKO/SW620 pre‐transfected with Cy3‐tagged miR‐181a‐5p (red), and the red fluorescence signals in LX2 cells were detected by confocal microscopy. (e) Transwell assays were used to evaluate the effects of exogenous miR‐181a‐5p on the invasive ability of LX2. (f) qPCR analysis of the effects of exogenous miR‐181a‐5p on the expression of pro‐inflammatory genes in LX2. (g and h) Transwell assays were used to determine the role of EVs derived from highly‐metastatic CRC cells (RKO and SW620) and anti‐miR‐181a‐5p constructs in the regulation of the invasive ability of LX2 cells in vitro (* < 0.05; ** < 0.01)
FIGURE 3
FIGURE 3
FUS regulates miR‐181a‐5p transfer into EVs derived from highly metastatic CRC cells. qPCR analysis of the expression levels of miR‐181a‐5p in RKO/SW620‐derived EVs (a and b) and RKO/SW620 cells (c and d) upon FUS/MBNL1 knockdown. (e) WB analysis of the association between biotinylated wild‐type or mutated miR‐181a‐5p and FUS expression in samples derived by miRNA pull‐down performed with nuclear, cytoplasmic or EV lysates from RKO cells; biotinylated poly(G) was used as the negative control. (f) RIP assays with anti‐FUS antibody were performed on RKO‐conditioned media (CM) and RKO‐derived EVs, with IgG serving as the negative control. Then, qPCR was used to analyze the expression levels of miR‐181a‐5p in immunoprecipitated samples as percentages with respect to the input sample (% input). (g and h) The red fluorescence signals in LX2 cells co‐cultured with CM from RKO/SW620 cells transfected with Cy3‐miR‐181a‐5p (red) and si‐FUS were detected by confocal microscopy (* < 0.05; ** < 0.01)
FIGURE 4
FIGURE 4
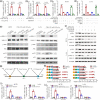
miR‐181a‐5p rich EVs derived from highly metastatic CRC cells activate HSCs by targeting SOCS3 via the IL6/STAT3 signalling pathway. (a) Predicted binding sites between miR‐181a‐5p and the 3′‐UTR of the wild‐type and mutant SOCS3 gene. (b) The effect of miR‐181a‐5p mimic and anti‐miR‐181a‐5p constructs on the luciferase activity of the 3′‐UTR binding of the wild‐type or mutant SOCS3, respectively, in LX2 cells was assessed using a luciferase reporter gene activity assay. (c) LX2 cells were co‐cultured with EVs derived from HT29 or RKO cells, which were pre‐transfected with miR‐181a‐5p mimic or anti‐miR‐181a‐5p constructs, respectively. Luciferase reporter gene activity assays were used to detect the effect of EVs derived from CRC cells on the luciferase activity of miR‐181a‐5p binding with the 3′‐UTR of the wild‐type or mutant SOCS3 construct in LX2 cells. (d) qPCR and WB analysis were used to examine the effects of exogenous miR‐181a‐5p on SOCS3 expression in LX2 cells. (e and f) qPCR analysis was used to examine the effect of EVs derived from HT29 and RKO CRC cells rich in miR‐181a‐5p on SOCS3 expression in LX2 cells. LX2 cells were successively transfected with miR‐181a‐5p mimic, Lv‐SOCS3 or their respective controls. (g) Transwell assays were applied to verify the combined effect of miR‐181a‐5p and SOCS3 overexpression on the invasion of LX2. (h and i) The combined effects of miR‐181a‐5p and SOCS3 overexpression on IL6 expression in the cell media was determined using qPCR (h) and ELISA (i), respectively. (j) WB analysis was used to examine the effect of EVs derived from CRC cells rich in miR‐181a‐5p on the IL6/STAT3 pathway components in LX2. (k) LX2 cells were pre‐transfected with miR‐181a‐5p mimic, anti‐miR‐181a‐5p constructs or HT29/RKO‐derived EVs, and then co‐cultured with Lv‐SOCS3 or sh‐SOCS3, respectively. The combined effects of exogenous miR‐181a‐5p/LvSOCS3, anti‐miR‐181a‐5p/sh‐SOCS3, HT29‐derived EVs/sh‐SOCS3 and RKO‐derived EVs/Lv‐SOCS3 on the expression of IL6/STAT3 pathway components were determined by WB analysis, respectively (* < 0.05; ** < 0.01)
FIGURE 5
FIGURE 5
HSCs activated by EVs rich in miR‐181a‐5p derived from CRC cells promote CRC cell migration and invasion in vitro and liver metastasis in vivo. (a and b) LX2 cells were first transfected with miR‐181a‐5p mimic or the respective control. Then, CM from these transfected LX2 cells were added to HCT8/LoVo cell cultures, and transwell assays were used to examine the effect of exogenous miR‐181a‐5p on the migration and invasion of CRC cells. (c and d) HT29/RKO cells were pre‐transfected with miR‐181a‐5p mimic or anti‐miR‐181a‐5p constructs, respectively. EVs were isolated and LX2 cells were co‐cultured with these EVs. Then the CM of these LX2 cells was added to HCT8/LoVo cells, respectively. The effect of α‐HSCs on the migration and invasion of CRC cells was determined using transwell assays in vitro (c and d) and liver metastasis of nude mice by live imaging in vivo (e). Representative images of live imaging (e) and HE staining (f) of the liver metastases in nude mice (green arrows: metastatic tumour node; black arrow: normal liver cell). (g) Number of metastatic colonies in the livers of the nude mice from different groups based on live imaging and HE staining. (h) WB analysis of the protein expression levels of ECM proteins (α‐SMA, fibronectin, vitronectin and tenascin C) in the metastases to the liver in the mice (* < 0.05; ** < 0.01)
FIGURE 6
FIGURE 6
Activated HSCs promote CRC liver metastasis via the CCL20/CCR6 axis. (a) The levels of chemokines in LX2 cells pre‐cultured with EVs derived from RKO cells or a negative control, were tested using a human chemokine screening test kit. (b and c) The effect of exogenous miR‐181a‐5p (b) and highly metastatic CRC cell‐derived EV miR‐181a‐5p (c) on the expression of CCL20 in LX2 cells was assessed using ELISA. (d) IHC staining of CCR6 in CRC; scale bar: 200 μm. (e‐i) LX2 cells were first transfected with miR‐181a‐5p mimic or treated with an anti‐CCL20 antibody with IgG as a negative control, then co‐cultured with HCT8/LoVo cells. After transfection with miR‐181a‐5p mimic, LX2 cells were also co‐cultured with HCT8/LoVo cells that had had CCR6 expression knocked down rather than being treated with an anti‐CCL20 antibody or IgG control. Next, the effects of the CCL20/CCR6 axis on the migration and invasion of CRC cells were determined using in vitro Transwell assays (e and f), as well as on metastasis to the liver in vivo using live imaging (g). Representative images of live imaging (g) and HE staining (h) of liver metastases in nude mice (green arrows: metastatic tumour node; black arrow: normal liver cell). (i) Number of metastatic colonies in the livers of nude mice from different groups based on live imaging and HE staining (* < 0.05; ** < 0.01)
FIGURE 7
FIGURE 7
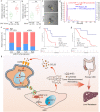
A CCL20/CCR6/ERK1/2/Elk‐1/miR‑181a‐5p positive feedback loop mediates the interaction between HSCs and CRC cells during CRLM. (a) LX2 cells were pre‐transfected with miR‐181a‐5p mimic, and the CM as well as CCL20 antibody were added to HCT8 and LoVo cells, respectively, to determine the combined effect of activated HSCs and CCL20 on the expression of miR‐181a‐5p in CRC cells. (b) The inhibitor of the ERK1/2 signalling pathway (PD98059) and CM of LX2 cells that had been pre‐transfected with miR‐181a‐5p mimic, was added to HCT8/LoVo cells, respectively. The transfection efficiency was assessed by qPCR. (c and d) LX2 cells were pre‐transfected with miR‐181a‐5p mimic, and their CM was added to HCT8 (c) and LoVo (d) cells with Elk‐1 expression knocked down, respectively, then the expression of miR‐181a‐5p on CRC cells was examined by qPCR. (e) LX2 cells were first transfected with miR‐181a‐5p mimic or treated with an anti‐CCL20 antibody with IgG as a negative control, and then co‐cultured with HCT8/LoVo cells. Additionally, after transfection with miR‐181a‐5p mimic, LX2 cells were also co‐cultured with HCT8/LoVo cells following CCR6 knockdown. WB assays were used to demonstrate the expression levels of MAPK pathway components, respectively. (f) The combined effect of activated HSCs, CCL20 antibody as well as PD98059 on the activation of ERK1/2 and Elk‐1 were further verified by WB. (g) Schematic diagram of the three specific binding sites between Elk‐1 and the promoter of miR‐181a‐5p based on LASAGNA‐Search 2.0 and human genomic databases from NCBI. (h) The binding site truncation mutants and their control vectors were cloned into pGL3‐luciferase reporter plasmids and transfected into HCT8/LoVo cells. A luciferase reporter gene activity assay was used to analyze the changes in luciferase activity and determine the transcriptional sites. (i) A luciferase reporter gene activity assay was further used to analyze the combined effects of exogenous CCL20 and PD98059 on the luciferase activity of the wild‐type/mutant Elk‐1 on binding site 3 of the miR‐181a‐5p promoter constructs in HCT8/LoVo cells. (j) qPCR was used to determine the effects of PD98059 on the RNA levels of miR‐181a‐5p in HCT8/LoVo, which had been co‐cultured with CM from LX2 cells overexpressing miR‐181a‐5p (* < 0.05; ** < 0.01)
FIGURE 8
FIGURE 8
EV miR‐181a‐5p serves as a novel biomarker for CRC patients with liver metastasis. (a) The expression levels of miR‐181a‐5p in CRC patients with stage I‐II (n = 30) and stage III‐IV (n = 30) tumours were determined by qPCR. (b) qPCR assays were used to evaluate miR‐181a‐5p expression in serum EVs from 25 CRC patients without liver metastasis (None LM) and those with liver metastasis (LM). Serum EVs were further detected by electron microscopy (c) and Nanosight particle tracking analysis (d), respectively. Scale bar: 100 nm. (e) Association between the expression of CEA/α‐SMA based on IHC staining score and miR‐181a‐5p in CRLM specimens. (f and g) Kaplan‐Meier survival analysis and log‐rank tests were used to determine the associations between miR‐181a‐5p with DFS (f) and OS (g) for 88 CRLM patients. (h) Schematic model of the positive feedback loop between highly metastatic CRC cells and HSCs in CRLM (* < 0.05; ** < 0.01)

References

    1. Affo, S. , Yu, L.‐X , & Schwabe, R. F. . (2017). The role of cancer‐associated fibroblasts and fibrosis in liver cancer. Annual Review of Pathology. 12, 153–186. - PMC - PubMed
    1. Ahmad, S. A. , Berman, R. S. , & Ellis, L. M. . (2003). Biology of colorectal liver metastases. Surgical Oncology Clinics of North America. 12, 135‐150. - PubMed
    1. Beckers, R. C. J. , Lambregts, D. M. J. , Lahaye, M. J. , Rao, S. ‐. X. , Kleinen, K. , Grootscholten, C. , Beets, G. L. , Beets‐Tan, R. G. H. , & Maas, M. . (2018). Advanced imaging to predict response to chemotherapy in colorectal liver metastases—A systematic review. HPB (Oxford). 20, 120–127. - PubMed
    1. Brenner, C. , Galluzzi, L. , Kepp, O. , & Kroemer, G. . (2013). Decoding cell death signals in liver inflammation. Journal of Hepatology. 59, 583‐594. - PubMed
    1. Chu, X. , Jin, Q. , Chen, H. , Wood, G. C. , Petrick, A. , Strodel, W. , Gabrielsen, J. , Benotti, P. , Mirshahi, T. , Carey, D. J. , Still, C. D. , Distefano, J. K. , & Gerhard, G. S. (2018). CCL20 is up‐regulated in non‐alcoholic fatty liver disease fibrosis and is produced by hepatic stellate cells in response to fatty acid loading. Journal of Translational Medicine. 16, 108. - PMC - PubMed

Publication types

MeSH terms

Substances