. 2022 Jan 18;18(1):e1009775.
doi: 10.1371/journal.pcbi.1009775. eCollection 2022 Jan.

Ultrafast population coding and axo-somatic compartmentalization

Affiliations

Ultrafast population coding and axo-somatic compartmentalization

Chenfei Zhang et al. PLoS Comput Biol. .

Abstract

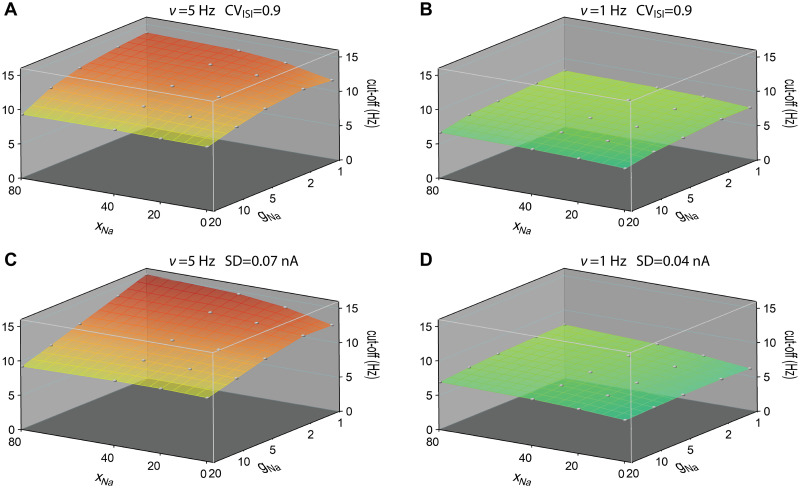
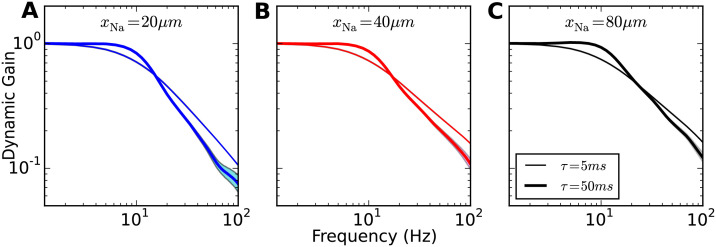
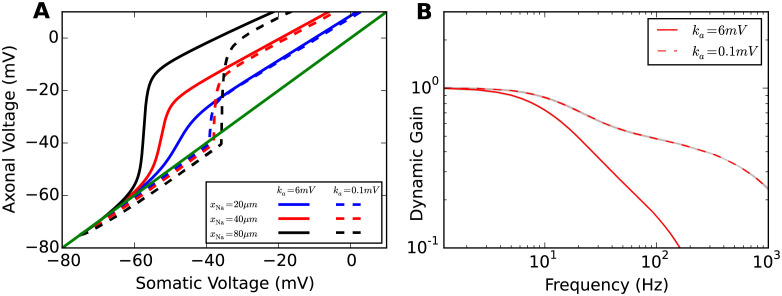
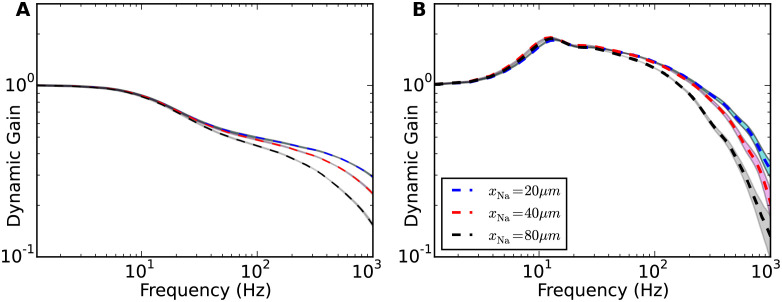
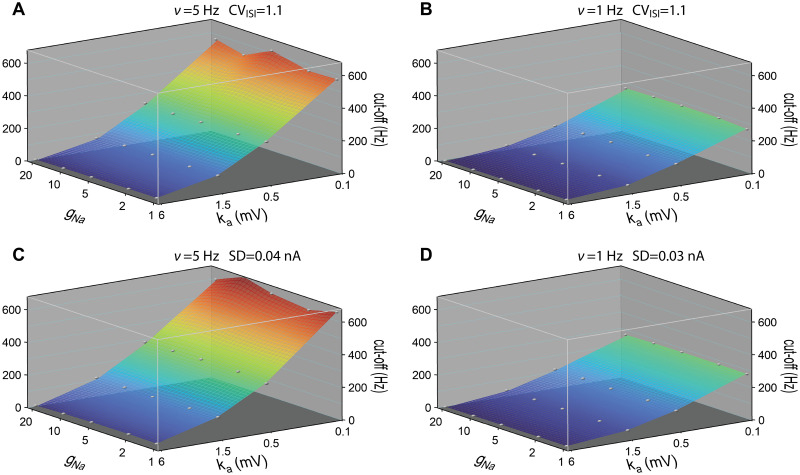
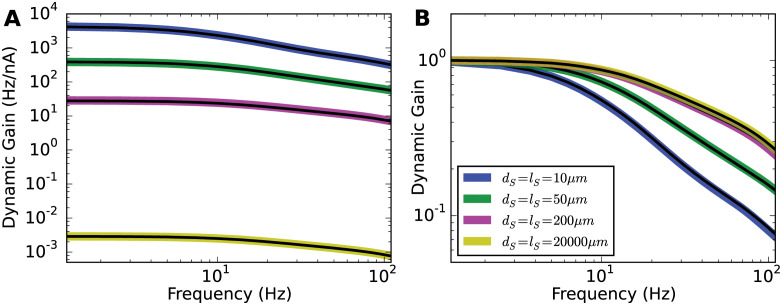
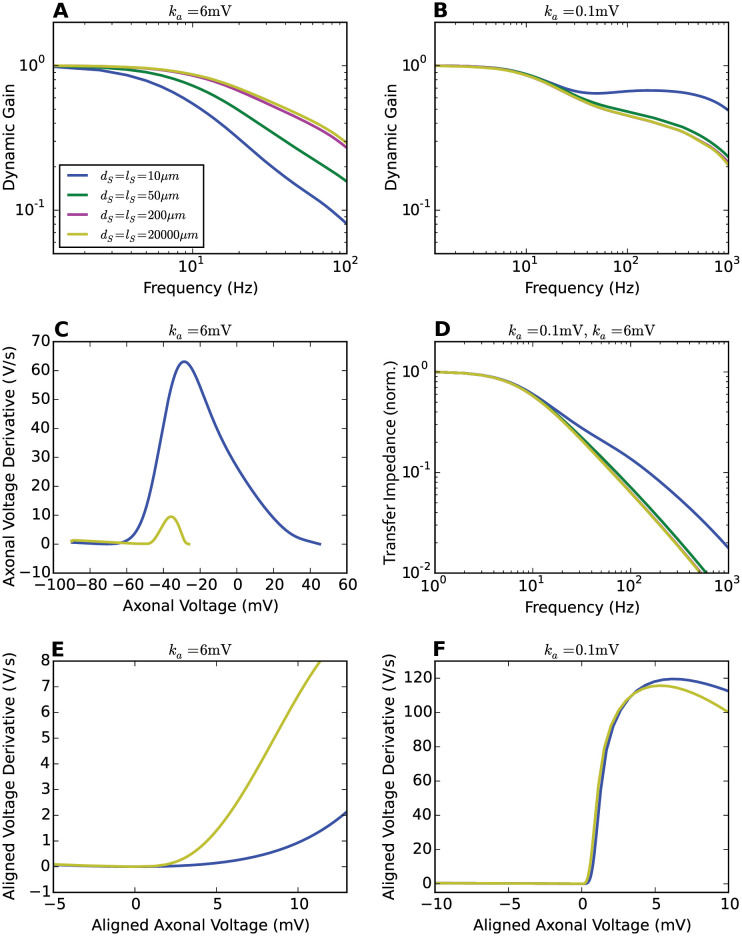
Populations of cortical neurons respond to common input within a millisecond. Morphological features and active ion channel properties were suggested to contribute to this astonishing processing speed. Here we report an exhaustive study of ultrafast population coding for varying axon initial segment (AIS) location, soma size, and axonal current properties. In particular, we studied their impact on two experimentally observed features 1) precise action potential timing, manifested in a wide-bandwidth dynamic gain, and 2) high-frequency boost under slowly fluctuating correlated input. While the density of axonal channels and their distance from the soma had a very small impact on bandwidth, it could be moderately improved by increasing soma size. When the voltage sensitivity of axonal currents was increased we observed ultrafast coding and high-frequency boost. We conclude that these computationally relevant features are strongly dependent on axonal ion channels' voltage sensitivity, but not their number or exact location. We point out that ion channel properties, unlike dendrite size, can undergo rapid physiological modification, suggesting that the temporal accuracy of neuronal population encoding could be dynamically regulated. Our results are in line with recent experimental findings in AIS pathologies and establish a framework to study structure-function relations in AIS molecular design.


Conflict of interest statement

The authors have declared that no competing interests exist.

Figures

Fig 1
Fig 1. Model properties.
A Sketch of the model morphology: soma and axon are modeled as cylinders. The sodium conductance is positioned at xNa and the stimulus current is injected at the middle of the soma. For simulation and model details see Methods. B Bifurcation of axonal voltage, replicating Fig 2 of [31]. Sodium current (red) and lateral currents (black, with somatic voltage fixed at −60mV, −55mV, −50mV respectively) are plotted as a function of axonal voltage at different xNa. The intersection points between the black curve and the red curve indicate stationary axonal voltage given the somatic voltage. For large xNa = 40μm, the first intersection point changes discontinuously for increasing somatic voltage. C Axonal voltage plotted against somatic voltage for two conditions with xNa = 40μm. Only when the somatic voltage is artificially fixed to a slowly increasing potential (dashed), a sudden jump in the axonal voltage occurs (dotted), when the voltage control of the axonal voltage is lost around −55mV. In a dynamic situation, here a current clamp with injection of a constant current driving firing at 5 Hz, this jump disappears (solid line), the transition is more gradual.
Fig 2
Fig 2. Phase plot and linear response functions.
A Phase plots for the APs seen at the soma, somatic voltage rate of change vs. somatic voltage for different sodium channel positions xNa (legend in B). The local minima of all curves are aligned at (0mV, 0mV/ms). B Dynamic gain functions for different xNa, normalized. 95% confidence intervals are plotted as shaded areas, mostly hidden by the line width. All curves are above statistical significance threshold (see Methods). The input current correlation time was set to τ = 5ms.
Fig 3
Fig 3. Impact of initiation site distance and transfer impedance on dynamic gain.
A Phase plots for the AP waveforms at the initiation site. Moving the initiation site away from the soma reduces the lateral current during AP generation, leading to a more rapid initiation dynamics. The local minima of all curves are aligned at (0mV, 0mV/ms). The action potential waveforms are shown in S1 Fig. B Transfer impedance when the stimulus is transmitted from the soma to the AP initiation site. C Increasing xNa to 200μm decreases the high-frequency gain of the neuron model. D Increasing Ra to 750Ωcm reduces the impact of initiation site distance on dynamic gain (compare to Fig 2B). The transfer impedance effect dominates the dynamic gain. A larger xNa reduces the high-frequency gain.
Fig 4
Fig 4. AP initiation dynamics and dynamic gain comparisons for difference sodium peak conductances.
A Dynamic gain functions of neuron models with different sodium peak conductances for 1Hz firing. The CV is 0.9±0.05. B Phase plots of AP initiation dynamics of Brette’s models with different sodium peak conductances. xNa is fixed to 40μm. Sodium peak conductance g¯Na is increased 5 and 10 fold separately in comparison with the original model. To compare the AP initiation speed, each neuron model is injected with a constant input that generates 1Hz firing rate. C Dynamic gain functions of neuron models with different sodium peak conductances for 5Hz firing. The CV is 0.85±0.05. The inset in panel C shows the F-I curve for the three sodium peak conductance used. D Phase plots of AP initiation dynamics at 5Hz firing.
Fig 5
Fig 5. Cutoff frequencies of dynamic gain curves as a function of sodium peak conductance and AP initiation site.
A and B For each pair of AP initiation site and sodium peak conductance, the dynamic gain curve was calculated at 5Hz and 1Hz firing rates working points. CV values were fixed at 0.9 ± 0.05. C and D The dynamic gain curves were calculated at 5Hz and 1Hz firing rate with std of stimuli fixed at 0.07nA and 0.04nA. Cutoff frequency was the frequency to which the dynamic gain decayed by a factor of 2. Correlation time of background current was 5ms. xNa ranged from 0μm to 80μm. Sodium peak conductance ranged from 1g¯Na to 20g¯Na, represented on a logarithmic scale. Grey points represent calculated data, continuous surfaces are obtained by Voronoi interpolation to allow for a continuous color representation.
Fig 6
Fig 6. Impact of background current correlation time on dynamic gain.
Dynamic gain functions for different input current correlation times. Model properties as for Fig 2. xNa increases from = 20, 40 to 80μm (A, B, C). Line width indicates input correlation time (thin: τ = 5ms, wide: τ = 50ms).
Fig 7
Fig 7. Impact of voltage sensitivity of sodium current activation curve on voltage decoupling under current clamp and dynamic gain.
A Plot of axonal voltage at xNa vs. somatic voltage for different sodium channel positions. Solid lines are voltage traces for low voltage sensitivity ka = 6mV, dashed lines denote the traces for high voltage sensitivity ka = 0.1mV. B Dynamic gain functions for the different voltage sensitivities for xNa = 40μm and τ = 5ms. The dynamic gain curve for the intermediate value ka = 1mV and longer correlation times can be found in S3 Fig.
Fig 8
Fig 8. Increased impact of current correlation time for high voltage sensitivity.
Dynamic gain curves are plotted for A a short input current correlation time τ = 5ms and B a long correlation time of τ = 50ms. Dashed lines as in Fig 7B. Shaded areas are 95% confidence intervals. Colors denote different initiation site positions (see legend).
Fig 9
Fig 9. Cutoff frequencies of dynamic gain curves as a function of sodium peak conductance and voltage sensitivity of sodium activation curve.
A and B For each pair of voltage sensitivity and sodium peak conductance, the dynamic gain curve was calculated at 5Hz and 1Hz firing rates working points. CV values were fixed at 1.1 ± 0.05. C and D The dynamic gain curves were calculated at 5Hz and 1Hz firing rate with std of stimuli fixed at 0.04nA and 0.03nA. Correlation time of background current was 50ms. xNa fixed at 40μm. Sodium peak conductance ranged from 1g¯Na to 20g¯Na. ka ranged from 0.1 to 6mV. Conductance and sensitivity are represented on a logarithmic scale. Grey points represent calculated data, continuous surfaces are obtained by Voronoi interpolation to allow for a continuous color representation.
Fig 10
Fig 10. Effect of soma size on dynamic gain.
A Unnormalized dynamic gain curves for various soma sizes. Diameters and lengths for all the soma are shown in the legend panel in B. xNa was fixed to 40μm. The correlation time τ was fixed to 5ms. For each soma size, fixing surface area but reducing soma length to 2μm, the dynamic gain curves were recalculated and represented as black lines, which overlapped with corresponding colored lines. B Comparison of all the normalized dynamic gain curves. Increasing the soma size enhances the dynamic gain in the high-frequency regime for Brette’s original model.
Fig 11
Fig 11. Transfer impedance and AP initiation dynamics for different soma sizes.
A and B Dynamic gain functions of Brette’s model for a variety of soma sizes. ka is set to 6mV and 0.1mV respectively. xNa = 40μm. τ = 5ms. Legend panel in A. C AP initiation dynamics seen at the axon with ka = 6mV. D Transfer impedance for different soma sizes. The passive neuron models are identical for both ka values. E and F Axonal AP initiation dynamics with local minima aligned at (0mV, 0mV/ms).

References

    1. Thorpe S, Fize D, Marlot C. Speed of processing in the human visual system. Nature. 1996;381(6582):520–522. doi: 10.1038/381520a0 - DOI - PubMed
    1. Stanford TR, Shankar S, Massoglia DP, Costello MG, Salinas E. Perceptual decision making in less than 30 milliseconds. Nat Neurosci. 2010;13(3):379–385. doi: 10.1038/nn.2485 - DOI - PMC - PubMed
    1. Carandini M, Mechler F, Leonard CS, Movshon JA. Spike train encoding by regular-spiking cells of the visual cortex. J Neurophysiol. 1996;76(5):3425–41. doi: 10.1152/jn.1996.76.5.3425 - DOI - PubMed
    1. Köndgen H, Geisler C, Fusi S, Wang XJ, Lüscher HR, Giugliano M. The dynamical response properties of neocortical neurons to temporally modulated noisy inputs in vitro. Cereb Cortex. 2008;18(September):2086–2097. doi: 10.1093/cercor/bhm235 - DOI - PMC - PubMed
    1. Boucsein C, Tetzlaff T, Meier R, Aertsen A, Naundorf B. Dynamical response properties of neocortical neuron ensembles: multiplicative versus additive noise. J Neurosci. 2009;29(4):1006–1010. doi: 10.1523/JNEUROSCI.3424-08.2009 - DOI - PMC - PubMed

Publication types