. 2022 Jan 18;18(1):e1009490.
doi: 10.1371/journal.pcbi.1009490. eCollection 2022 Jan.

The evolutionary maintenance of Lévy flight foraging

Affiliations

The evolutionary maintenance of Lévy flight foraging

Winston Campeau et al. PLoS Comput Biol. .

Abstract

Lévy flight is a type of random walk that characterizes the behaviour of many natural phenomena studied across a multiplicity of academic disciplines; within biology specifically, the behaviour of fish, birds, insects, mollusks, bacteria, plants, slime molds, t-cells, and human populations. The Lévy flight foraging hypothesis states that because Lévy flights can maximize an organism's search efficiency, natural selection should result in Lévy-like behaviour. Empirical and theoretical research has provided ample evidence of Lévy walks in both extinct and extant species, and its efficiency across models with a diversity of resource distributions. However, no model has addressed the maintenance of Lévy flight foraging through evolutionary processes, and existing models lack ecological breadth. We use numerical simulations, including lineage-based models of evolution with a distribution of move lengths as a variable and heritable trait, to test the Lévy flight foraging hypothesis. We include biological and ecological contexts such as population size, searching costs, lifespan, resource distribution, speed, and consider both energy accumulated at the end of a lifespan and averaged over a lifespan. We demonstrate that selection often results in Lévy-like behaviour, although conditional; smaller populations, longer searches, and low searching costs increase the fitness of Lévy-like behaviour relative to Brownian behaviour. Interestingly, our results also evidence a bet-hedging strategy; Lévy-like behaviour reduces fitness variance, thus maximizing geometric mean fitness over multiple generations.


Conflict of interest statement

The authors have declared that no competing interests exist.

Figures

Fig 1
Fig 1. Examples of random walks.
Four random walks (top) of 104 segments with move lengths pulled from a discrete truncated power-law distribution with exponents u = 1.0, 2.0, 3.0 and 5.0, with random direction from {0, π/2, π, 3π/2}. The walks begin at a random location on a 1000 × 1000 toroidal environment and their power-law distribution (bottom) is shown as a histogram of 104 logged move lengths truncated to half the length of the environment. Walks with exponents near u = 1.0 exhibit ballistic movement, diffusive movement near u = 2.0, and superdiffusion for u ≥ 3.
Fig 2
Fig 2. Demonstration of a toroidal environment.
A set of five non-empty resource entries in a cross formation is centered at entry e0,0 and then translated to e5,5 on a 11 × 11 toroidal matrix environment.
Fig 3
Fig 3. Uniform random and Lévy dust environments.
Examples of 1000 × 1000 environments with 105 uniform random, Lévy dust dimensions u = 1.0, 2.0, and 3.0 distributed resources. There are 105 patches instead of n2 ⋅ 10−4 to more clearly reveal the nature of the distributions. Note that the homogeneity of patch distribution decreases with increasing u.
Fig 4
Fig 4. Continuity of θ over consecutive moves.
Distributions of direction, θ, for random walks with power-law exponents u = 1.0, 2.0, 3.0, and 5.0, within windows of 25 consecutive moves, over 104 moves.
Fig 5
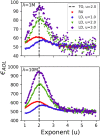
Fig 5. DO fitness curves.
The average energy over a lifespan ϵAOL, of populations of 5 ⋅ 104 DOs with foraging exponents 1 ≤ u ≤ 6 and lifespans λ = 1M (top) & λ = 10M (bottom) traversing all environments types (RU = Random Uniform [red ‘x’s], LD = Lévy Dust u = 1 [blue circles], u = 2 [green triangles], and u = 3 [purple diamonds]) with no searching costs. The fitness trends were captured with a sliding window of first moments. The theoretical optimal foraging exponent (TO) is indicated with the vertical dashed line u = 2.0.
Fig 6
Fig 6. Fitness variance and the effect of a searching cost.
The average energy over a lifespan ϵAOL, of populations of 5 ⋅ 104 with foraging exponents 1 ≤ u ≤ 6 and lifespans λ = 1M & λ = 10M traversing random uniform (RU) and Lévy dust (LD) dimension u = 1.0 environments. The fitness trends were captured with a sliding window of the first moment (WFM, red) and positive-only first moment (PWFM, blue), with two standard deviations surrounding the trend. The exponent which maximizes fitness, uMAX, is extracted from the sliding windows and marked with a dashed vertical line. Note that the first moments and standard deviations are superimposed in the zero-cost (χ = 0) plots.
Fig 7
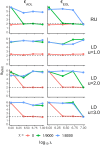
Fig 7. Optimal foraging exponents.
The exponent which maximizes fitness, uMAX, extracted from the sliding window of the positive-only first moments from the 5 ⋅ 104 after applying searching costs (χ = 0 [pink], χ = 1/9000 [green], χ = 1/8000 [blue]), as a function of log10 lifespan λ. The left column is the average of energy over a lifespan, ϵAOL, the right column is energy at the end of a lifespan, ϵEOL, and the rows are indexed by the resource distribution type (RU = Random Uniform, LD = Lévy Dust where u − 1 = fractal dimension).
Fig 8
Fig 8. DO fitness landscape with random uniform resources.
A matrix of surface plots of the top 1% performing DOs from sub-populations of the single-generation simulations which traversed random uniform environments. Fitness is determined by the average energy over a lifespan, ϵAOL. The matrix rows are indexed by lifespan λ, and the columns by the searching cost χ. A reference plot has been provided in order to interpret the axes of the individual surface plots; the x-axis is foraging exponent, the y-axis is population size, and the z-axis is frequency normalized to [0, 1].
Fig 9
Fig 9. DO fitness landscape with LD u = 1.0 resources.
A matrix of surface plots of the top 1% performing DOs from sub-populations of the single-generation simulations which traversed Lévy dust environments with dimension u = 1.0. Fitness is determined by the average energy over a lifespan, ϵAOL. The matrix rows are indexed by lifespan λ, and the columns by the searching cost χ. A reference plot has been provided in order to interpret the axes of the individual surface plots; the x-axis is foraging exponent, the y-axis is population size, and the z-axis is frequency normalized to [0, 1].
Fig 10
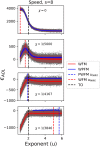
Fig 10. Increasing the speed of DOs results in ballistic optimums.
The final average energy over a lifespan ϵAOL, of 5 ⋅ 104 DOs with foraging exponents 1 ≤ u ≤ 6, lifespans λ = 5M, traveling with speed s = 8, in random uniform environments, and with an increasing searching cost χ, by row. The fitness trends were captured with a sliding window of the first moment (FM) and positive-only first moment (PFM), with two standard deviations surrounding the trend. The exponent which maximizes fitness, uMAX, is extracted from the sliding windows.
Fig 11
Fig 11. Evolution of DO foraging exponents.
Evolutionary simulations of DOs with lifespans of λ = 1M over 100 generations. (A) Searching costs χ = 0. (B) Searching costs χ = 1/8000. Each row comprises ten runs of an initial population of 1500 DOs, five runs starting with mean foraging exponent (denoted as FE) u = 1.0 (red), the remaining five with u = 5.0 (blue), both with σsv = 0.5. Each row also represents a different environment (RU = Random Uniform, LD = Lévy Dust where u−1 = fractal dimension). Note: we exclude the random uniform results as they were simply an intermediate result between the LD u = 1.0 and u = 2.0 results.
Fig 12
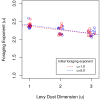
Fig 12. Testing the extrinsic hypothesis.
Determining whether the evolved foraging exponents from simulations with K = 1500, χ = 0, and σsv = (0.25, 0.5) positively correlate with the Lévy dust dimension. Simulations of populations with an initial mean foraging exponent of u = 1.0 are marked with red circles, u = 5.0 with blue circles, and their trends are marked with a colour corresponding dashed line; u = 1.0: r = −0.70 (P < 0.05, tdf=28 = −5.2), u = 5.0: r = −0.74 (P < 0.05, tdf=28 = −5.9). Note: jitter was added to the x-axis to help differentiate points.
Fig 13
Fig 13. Increasing the length of a lifespan selects for Lévy-like exponents.
The density curves of foraging exponents for the initial, intermediate, and final generations of evolutionary simulations with lifespans of λ = 2.5M and a searching cost χ = 1/8000. The first generations were composed of 1500 DOs with mean foraging exponents u = 1.0 or u = 5.0, and σsv = 0.5. The top row is the results from a LD dimension u = 1.0 resource distribution, the bottom LD dimension u = 3.0.
Fig 14
Fig 14. Competition between fixed Lévy and Brownian foraging exponents.
Competition simulations of equal-sized populations with fixed foraging exponents (denoted as FE), lifespans λ = 1M, and searching cost χ = 1/8000; Lévy-like u = 2.0 (red) versus Brownian-like u = 5.0 (blue). The carrying capacity of the top row is K = 20 DOs, the bottom row is K = 3000 DOs. The left column is DOs traversing LD environments with dimension u = 1.0, and the right column is fractal dimension u = 3.0.

References

    1. Mandelbrot BB. The Fractal Geometry of Nature. Henry Holt and Company; 1983.
    1. Viswanathan GM, Afanasyev V, Buldyrev SV, Murphy EJ, Prince PA, Stanley HE. Lévy flight search patterns of wandering albatrosses. Nature. 1996;381(6581):413–415. doi: 10.1038/381413a0 - DOI - PubMed
    1. Viswanathan GM, Buldyrev SV, Havlin S, da Luz MGE, Raposo EP, Stanley HE. Optimizing the success of random searches. Nature. 1999;401:911–914. doi: 10.1038/44831 - DOI - PubMed
    1. Wosniack ME, Santos MC, Raposo EP, Viswanathan GM, Luz dMGE. The evolutionary origins of Lévy walk foraging. PLOS Computational Biology. 2017;13(10):e1005774. doi: 10.1371/journal.pcbi.1005774 - DOI - PMC - PubMed
    1. Mariani MC, Liu Y. Normalized truncated Levy walks applied to the study of financial indices. Physica A: Statistical Mechanics and its Applications. 2007;377(2):590–598. doi: 10.1016/j.physa.2006.11.066 - DOI

Publication types