. 2022 Mar 1;163(3):bqac005.
doi: 10.1210/endocr/bqac005.

C-type Natriuretic Peptide-induced PKA Activation Promotes Endochondral Bone Formation in Hypertrophic Chondrocytes

Affiliations

C-type Natriuretic Peptide-induced PKA Activation Promotes Endochondral Bone Formation in Hypertrophic Chondrocytes

Keisho Hirota et al. Endocrinology. .

Abstract

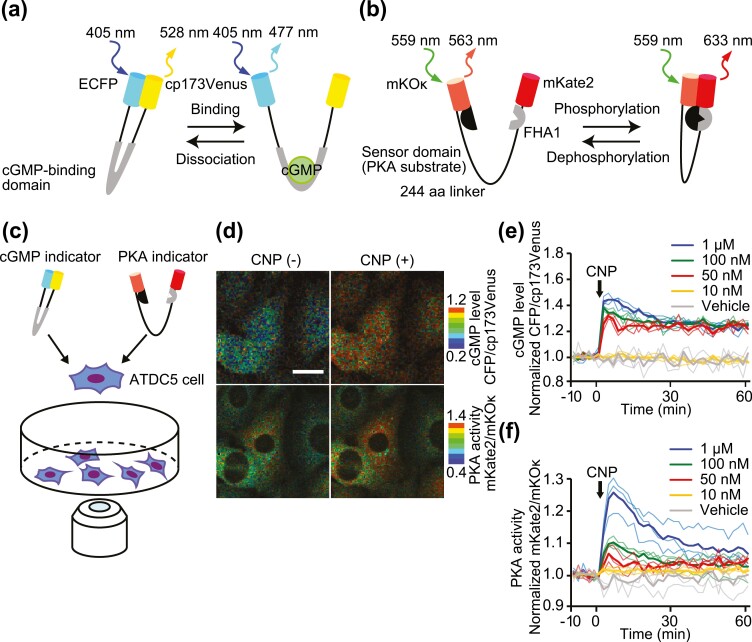
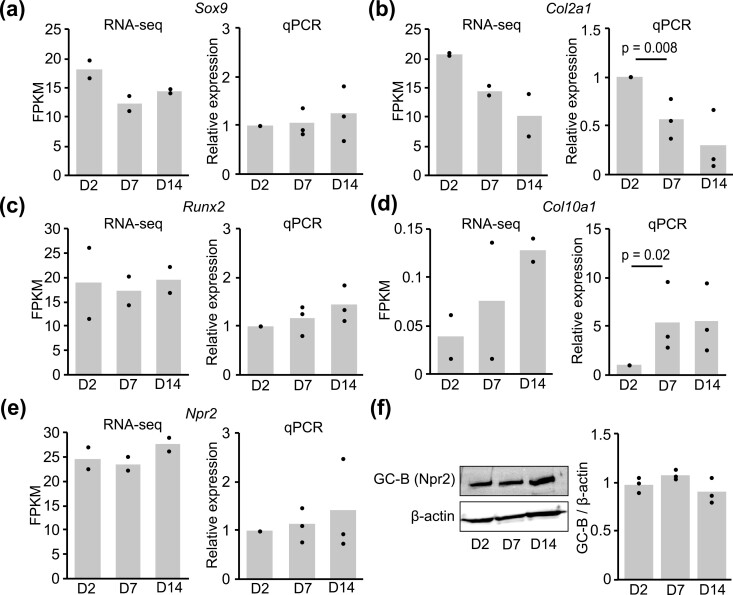
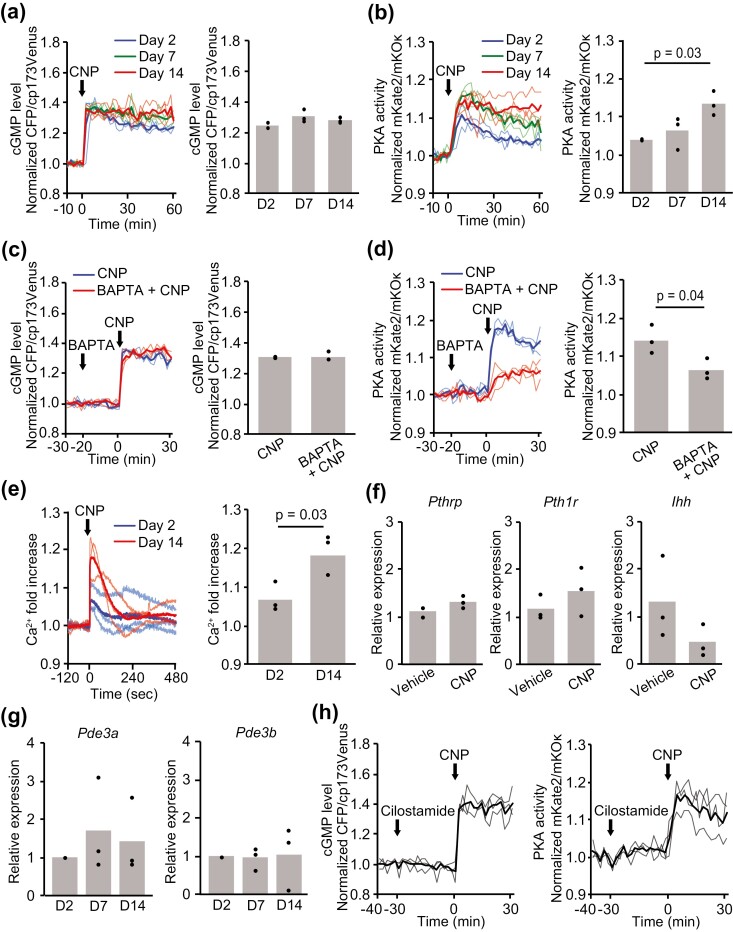
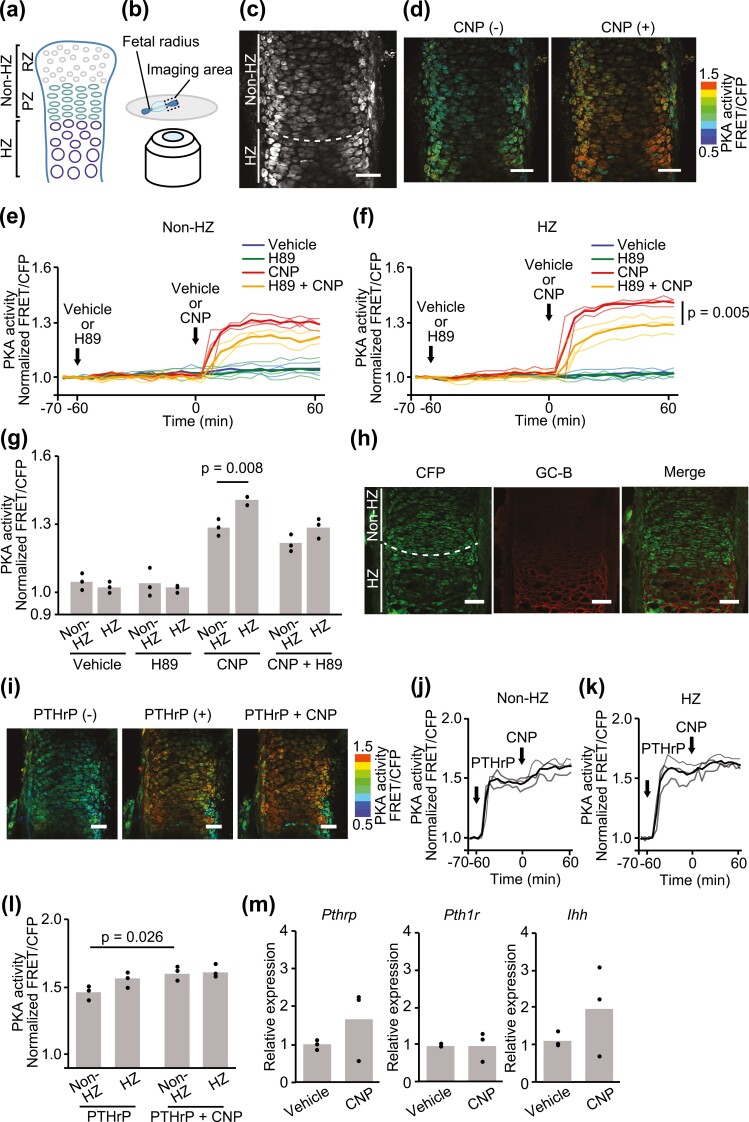
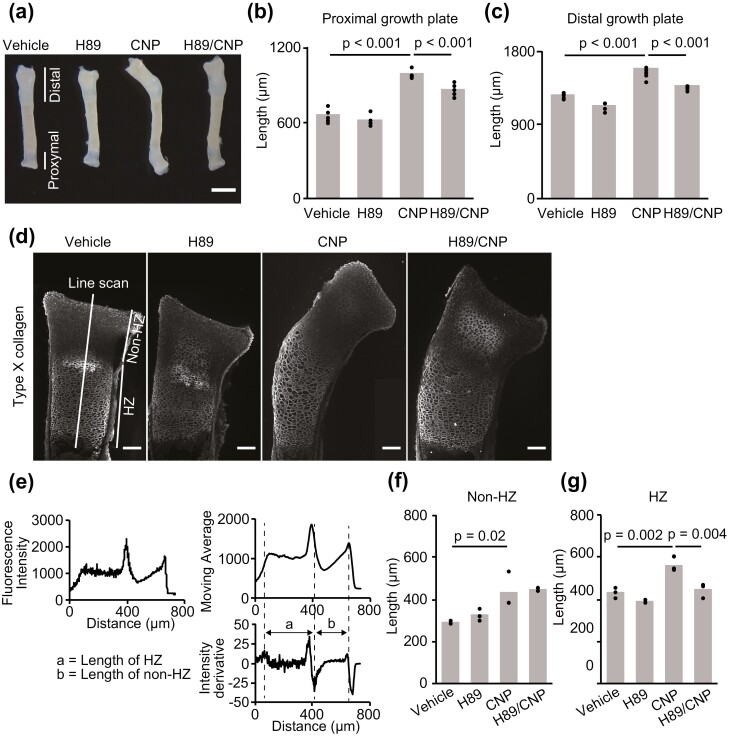
Longitudinal bone growth is achieved by a tightly controlled process termed endochondral bone formation. C-type natriuretic peptide (CNP) stimulates endochondral bone formation through binding to its specific receptor, guanylyl cyclase (GC)-B. However, CNP/GC-B signaling dynamics in different stages of endochondral bone formation have not been fully clarified, especially in terms of the interaction between the cyclic guanine monophosphate (cGMP) and cyclic adenosine monophosphate (cAMP) pathways. Here, we demonstrated that CNP activates the cAMP/protein kinase A (PKA) pathway and that this activation contributed to the elongation of the hypertrophic zone in the growth plate. Cells of the chondrogenic line ATDC5 were transfected with Förster resonance energy transfer (FRET)-based cGMP and PKA biosensors. Dual-FRET imaging revealed that CNP increased intracellular cGMP levels and PKA activities in chondrocytes. Further, CNP-induced PKA activation was enhanced following differentiation of ATDC5 cells. Live imaging of the fetal growth plate of transgenic mice, expressing a FRET biosensor for PKA, PKAchu mice, showed that CNP predominantly activates the PKA in the hypertrophic chondrocytes. Additionally, histological analysis of the growth plate of PKAchu mice demonstrated that CNP increased the length of the growth plate, but coadministration of a PKA inhibitor, H89, inhibited the growth-promoting effect of CNP only in the hypertrophic zone. In summary, we revealed that CNP-induced cGMP elevation activated the cAMP/PKA pathway, and clarified that this PKA activation contributed to the bone growth-promoting effect of CNP in hypertrophic chondrocytes. These results provide insights regarding the cross-talk between cGMP and cAMP signaling in endochondral bone formation and in the physiological role of the CNP/GC-B system.

Keywords: C-type natriuretic peptide; FRET biosensor; endochondral bone formation; live imaging; protein kinase A.


Figures

Figure 1.
Figure 1.
Dual-FRET imaging of cGMP concentration and PKA activity in ATDC5 cells. (A, B) Mechanism of action of the FRET-based cGMP (A) or PKA (B) biosensors. (A) cGMP binding to the cGMP biosensor induces conformational change and decreases in FRET. (B) Phosphorylation of the PKA biosensor by PKA induces increases in FRET. (C) Schematic diagram of the live cell imaging of ATDC5 cells co-expressing cGMP and PKA biosensors using the confocal microscope. (D) ATDC5 cells coexpressing cGMP and PKA biosensors were stimulated with CNP (100 nM). Images of the CFP/cp173Venus (upper panels) and mKate2/mKOκ (lower panels) ratios are shown in the IMD mode. Bar, 20 μm. (E, F) Time course of the CFP/cp173Venus (E) and mKate2/mKOκ (F) ratios normalized to the average before CNP stimulation. The cells were stimulated by each concentration of CNP. Solid lines represent the means; translucent lines represent the value of each experiment (n = 3).
Figure 2.
Figure 2.
Expression of chondrogenic differentiation marker genes. FPKM values and relative expression levels of Sox9 (A), Col2a1 (B), Runx2 (C), Col10a1 (D), and Npr2 (E) on days 2, 7, and 14 after induction of differentiation were obtained by RNA-Seq and quantitative real-time RT-PCR. In the results of RNA-Seq, each column represents the mean of 2 independent experiments, and plots represent each sample. In the results of RT-PCR, each column represents the mean of 3 independent experiments, and plots represent the mean of duplicate samples. Data are normalized against Hprt. (F) Total membrane proteins were extracted from ATDC5 cells on days 2, 7, and 14 after induction of differentiation and subjected to western blotting. The protein levels of GC-B (Npr2) were obtained and densitometry was carried out to evaluate the ratio of the intensity of the signals corresponding to GC-B to that of β-actin in the cells. Each column represents the mean of 3 independent experiments, and plots represent each sample.
Figure 3.
Figure 3.
Cell responses to CNP in each chondrogenic differentiation stage. (A, B) ATDC5 cells coexpressing cGMP and PKA biosensors were stimulated with CNP (100 nM) on days 2, 7, and 14 after the induction of differentiation. (A) Time course of the intracellular cGMP level represented as CFP/cp173Venus ratios and values at 60 minutes after CNP stimulation. (B) Time course of PKA activity represented as mKate2/mKOκ ratios and values at 60 minutes after CNP stimulation. CFP/cp173Venus and mKate2/mKOκ ratios are normalized to the average before CNP stimulation. (C, D) On day 14, ATDC5 cells coexpressing cGMP and PKA biosensors were stimulated with CNP (100 nM), following the addition of BAPTA-AM (32 μM). (C) Time course of the intracellular cGMP level represented as the CFP/cp173Venus ratio and (D) time course of PKA activity represented as the mKate2/mKOκ ratio normalized to the average before CNP stimulation. (E) ATDC5 cells expressing the Ca2+ biosensor were stimulated with CNP (100 nM) on days 2 and 14. The time course of the normalized fold increase of Ca2+ and the peak values after CNP stimulation are shown. Values were normalized to the average before CNP stimulation. (F) The relative expression levels of Pthrp, Pth1r, and Ihh in ATDC5 cells after 24 hours of treatment with CNP (100 nM) were obtained on day 14 by quantitative real-time RT-PCR. (G) The relative expression levels of Pde3a and Pde3b on days 2, 7, and 14 after induction of differentiation were obtained by quantitative real-time RT-PCR. (H) On day 14, ATDC5 cells coexpressing cGMP and PKA biosensors were stimulated with CNP (100 nM), following the addition of cilostamide (1 μM). Time course of the intracellular cGMP level represented as the CFP/cp173Venus ratio and time course of PKA activity represented as the mKate2/mKOκ ratio normalized to the average before cilostamide stimulation. In (A-G), each column represents the mean of 3 independent experiments, and plots represent the value of each sample.
Figure 4.
Figure 4.
PKA response to CNP in the PKAchu growth plate. (A) Structure of the growth plate. The growth plate was composed of resting (RZ), proliferative (PZ), prehypertrophic, and hypertrophic (HZ) zones. In this study, RZ and PZ were included in the nonhypertrophic zone (non-HZ) and the prehypertrophic zones were included in the HZ. (B) A schematic diagram of the imaging system. Radial explants of PKAchu mice were fixed on the glass bottom dish using agarose. Proximal growth plates were observed using a multiphoton fluorescence microscope under ex vivo culture conditions. (C) CFP image of the fetal proximal radial growth plate of PKAchu mice. A white dashed line divides the growth plate into the non-HZ and HZ as indicated. (D) The radial growth plates of PKAchu mice were stimulated with CNP (100 nM). FRET/CFP ratio images are shown in the IMD mode. Bar, 50 μm. (E-G) The radial growth plates of PKAchu mice were stimulated with CNP (100 nM), following the addition of vehicle or H89 (20 nM). (E, F) Time course of PKA activity represented as the normalized FRET/CFP ratio in the (E) non-HZ and (f) HZ. (G) Normalized FRET/CFP ratios at 60 min. (h) GC-B staining of the proximal radial growth plates at E17.5. Bar, 50 μm. (I-L) The radial growth plates of PKAchu mice were stimulated with CNP (100 nM), following the addition of PTHrP (100 nM). (I) FRET/CFP ratio images are shown in the IMD mode. Bar, 50 μm. (J, K) Time course of PKA activity represented as the normalized FRET/CFP ratio in the (J) non-HZ and (K) HZ. (G) Normalized FRET/CFP ratios at 0 minutes (PTHrP) and 60 minutes (PTHrP + CNP). (M) The relative expression levels of Pthrp, Pth1r, and Ihh in growth plate chondrocytes after 24 hours of treatment with CNP (100 nM) under organ culture conditions were obtained by quantitative real-time RT-PCR. Each column represents the mean of 3 independent experiments, and plots represent the value of each sample. FRET/CFP ratios are normalized to the average value before drug treatment.
Figure 5.
Figure 5.
Histological analysis of the growth plate of PKAchu mice. (A) Gross appearance of radial explants incubated with vehicle, H89, CNP, or both H89 and CNP (H89/CNP) for 3 days. Bar, 1 mm. (B, C) Length of the (B) proximal and (C) distal growth plates of the vehicle, H89, CNP, or H89/CNP-treated groups at the end of the organ culture period. Each column represents the mean of 5 or 6 independent experiments, and plots represent the value of each sample. (D) Type X collagen staining of the proximal growth plates of each group at the end of the organ culture period. Fluorescence intensity along the long axis of the proximal growth plate was acquired using the line scan function in MetaMorph. Bar, 50 μm. (E) Scheme of the measurement of histological sections. The value of fluorescence intensity is shown in the left upper panel. Right upper and lower panels: moving average of fluorescence intensity and its derivative. Dashed lines represent the end of the HZ, the border between the HZ and non-HZ, and the end of the epiphysis, respectively. The length of the HZ is shown with the letter a and the length of the non-HZ is shown with the letter b in the right lower panel. (F, G) Length of the (F) non-HZ and (G) HZ of the vehicle, H89, CNP, and H89/CNP-treated groups. Each column represents the mean of 3 independent experiments, and plots represent the value of each sample.

References

    1. Kronenberg HM. Developmental regulation of the growth plate. Nature. 2003;423(6937):332-336. - PubMed
    1. Kozhemyakina E, Lassar AB, Zelzer E. A pathway to bone: signaling molecules and transcription factors involved in chondrocyte development and maturation. Development. 2015;142(5):817-831. - PMC - PubMed
    1. Nakao K, Ogawa Y, Suga S, Imura H. Molecular biology and biochemistry of the natriuretic peptide system. II: natriuretic peptide receptors. J Hypertens. 1992;10(10):1111-1114. - PubMed
    1. Yasoda A, Ogawa Y, Suda M, et al. . Natriuretic peptide regulation of endochondral ossification. Evidence for possible roles of the C-type natriuretic peptide/guanylyl cyclase-B pathway. J Biol Chem. 1998;273(19):11695-11700. - PubMed
    1. Yasoda A, Komatsu Y, Chusho H, et al. . Overexpression of CNP in chondrocytes rescues achondroplasia through a MAPK-dependent pathway. Nat Med. 2004;10(1):80-86. - PubMed

Publication types

MeSH terms