

Sensitivity of wastewater-based epidemiology for detection of SARS-CoV-2 RNA in a low prevalence setting
- PMID: 35042077
- PMCID: PMC8720482
- DOI: 10.1016/j.watres.2021.118032
Sensitivity of wastewater-based epidemiology for detection of SARS-CoV-2 RNA in a low prevalence setting
Abstract
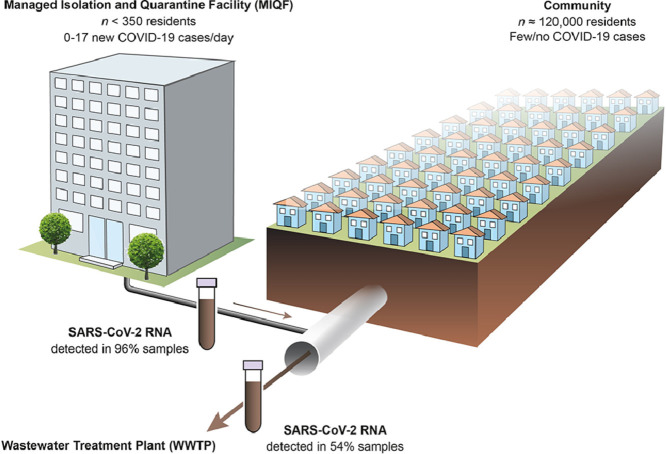
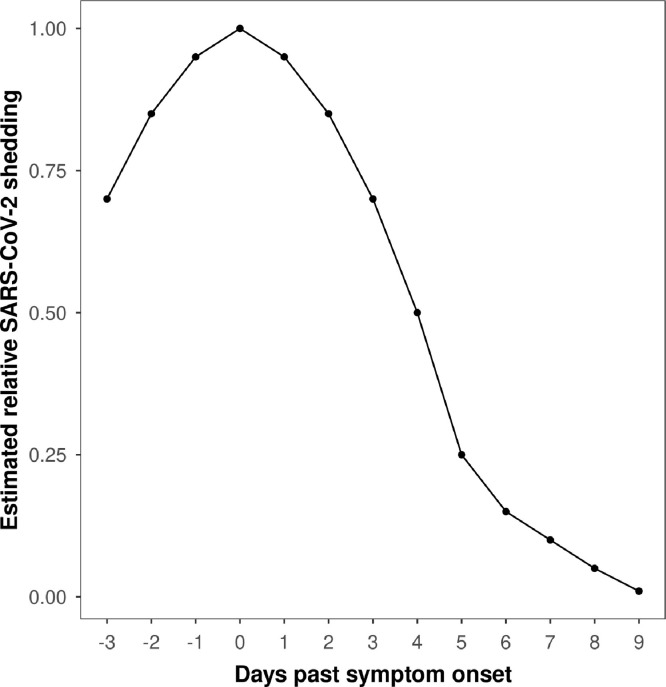
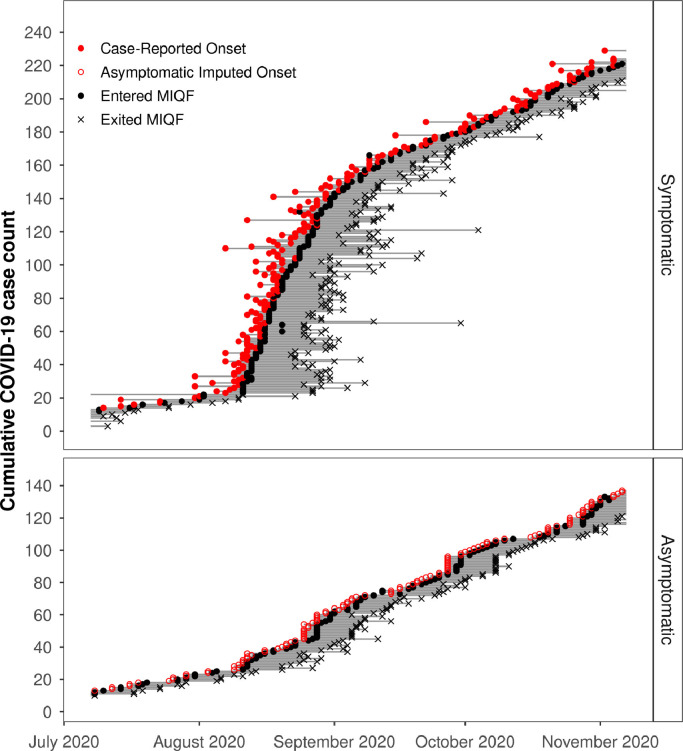
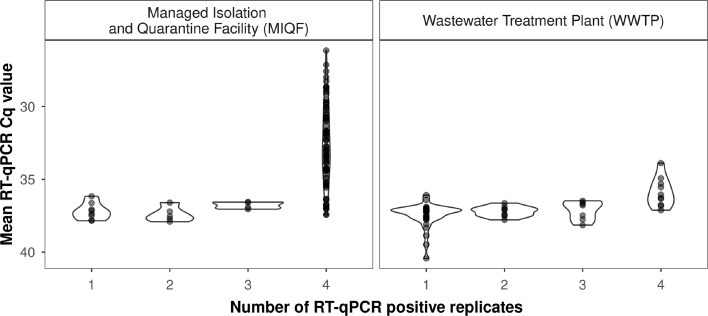
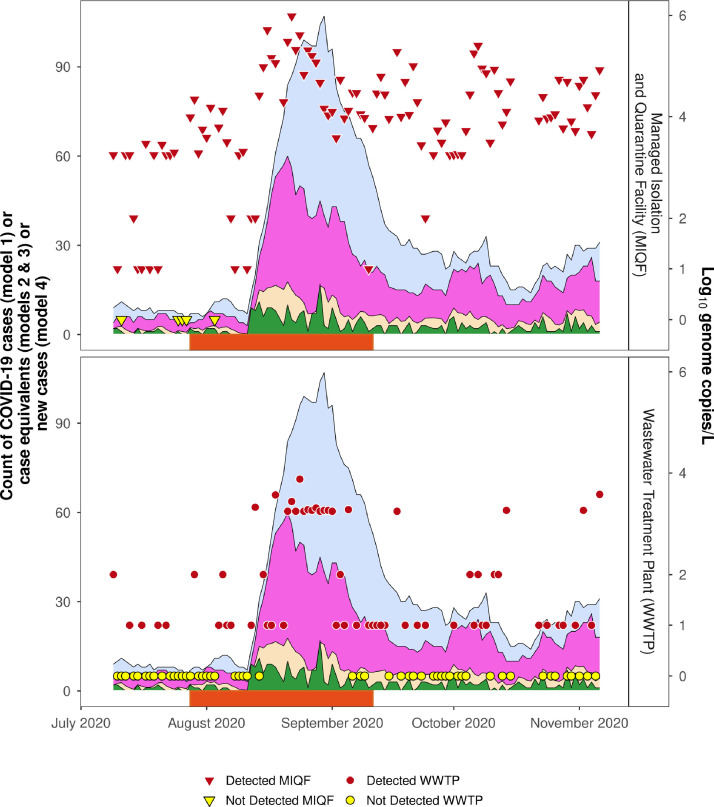
To assist public health responses to COVID-19, wastewater-based epidemiology (WBE) is being utilised internationally to monitor SARS-CoV-2 infections at the community level. However, questions remain regarding the sensitivity of WBE and its use in low prevalence settings. In this study, we estimated the total number of COVID-19 cases required for detection of SARS-CoV-2 RNA in wastewater. To do this, we leveraged a unique situation where, over a 4-month period, all symptomatic and asymptomatic cases, in a population of approximately 120,000, were precisely known and mainly located in a single managed isolation and quarantine facility (MIQF) building. From 9 July to 6 November 2020, 24-hr composite wastewater samples (n = 113) were collected daily from the sewer outside the MIQF, and from the municipal wastewater treatment plant (WWTP) located 5 km downstream. New daily COVID-19 cases at the MIQF ranged from 0 to 17, and for most of the study period there were no cases outside the MIQF identified. SARS-CoV-2 RNA was detected in 54.0% (61/113) at the WWTP, compared to 95.6% (108/113) at the MIQF. We used logistic regression to estimate the shedding of SARS-CoV-2 RNA into wastewater based on four infectious shedding models. With a total of 5 and 10 COVID-19 infectious cases per 100,000 population (0.005% and 0.01% prevalence) the predicated probability of SARS-CoV-2 RNA detection at the WWTP was estimated to be 28 and 41%, respectively. When a proportional shedding model was used, this increased to 58% and 87% for 5 and 10 cases, respectively. In other words, when 10 individuals were actively shedding SARS-CoV-2 RNA in a catchment of 100,000 individuals, there was a high likelihood of detecting viral RNA in wastewater. SARS-CoV-2 RNA detections at the WWTP were associated with increasing COVID-19 cases. Our results show that WBE provides a reliable and sensitive platform for detecting infections at the community scale, even when case prevalence is low, and can be of use as an early warning system for community outbreaks.
Keywords: COVID-19; New Zealand; PEG precipitation; RT-qPCR; Viral shedding.
Copyright © 2021 Elsevier Ltd. All rights reserved.
Conflict of interest statement
None.
Figures

References
-
- AJMC Staff. (2021) A Timeline of COVID-19 Developments in 2020. https://www.ajmc.com/view/a-timeline-of-covid19-developments-in-2020. Accessed on 30 March 2021.
-
- Baker M.G., Wilson N., Anglemyer A. Successful elimination of Covid-19 transmission in New Zealand. N. Engl. J. Med. 2020;383(8):e56. https://doi.org/10.1056/NEJMc2025203. - PMC - PubMed
-
- Baldovin T., Amoruso I., Fonzo M., Buja A., Baldo V., Cocchio S., Bertoncello C. SARS-CoV-2 RNA detection and persistence in wastewater samples: an experimental network for COVID-19 environmental surveillance in Padua, Veneto Region (NE Italy) Sci. Total Environ. 2021;760 https://doi.org/10.1016/j.scitotenv.2020.143329. - PMC - PubMed
-
- Barril P.A., Pianciola L.A., Mazzeo M., Ousset M.J., Jaureguiberry M.Y., Alessandrello M., Sánchez G., Oteiza J.M. Evaluation of viral concentration methods for SARS-CoV-2 recovery from wastewaters. Sci. Total Environ. 2021;756 https://doi.org/10.1016/j.scitotenv.2020.144105. - PMC - PubMed
-
- Betancourt W.Q., Schmitz B.W., Innes G.K., Prasek S.M., Pogreba Brown K.M., Stark E.R., Foster A.R., Sprissler R.S., Harris D.T., Sherchan S.P., Gerba C.P., Pepper I.L. COVID-19 containment on a college campus via wastewater-based epidemiology, targeted clinical testing and an intervention. Sci. Total Environ. 2021;779 https://doi.org/10.1016/j.scitotenv.2021.146408. - PMC - PubMed
MeSH terms
Substances
LinkOut - more resources
Full Text Sources
Medical
Miscellaneous
