. 2022 Mar;603(7902):679-686.
doi: 10.1038/s41586-022-04411-y. Epub 2022 Jan 7.

Rapid epidemic expansion of the SARS-CoV-2 Omicron variant in southern Africa

Raquel Viana #  1 Sikhulile Moyo #  2   3   4 Daniel G Amoako #  5 Houriiyah Tegally #  6 Cathrine Scheepers #  5   7 Christian L Althaus  8 Ugochukwu J Anyaneji  6 Phillip A Bester  9   10 Maciej F Boni  11 Mohammed Chand  12 Wonderful T Choga  3 Rachel Colquhoun  13 Michaela Davids  14 Koen Deforche  15 Deelan Doolabh  16 Louis du Plessis  17   18 Susan Engelbrecht  19 Josie Everatt  5 Jennifer Giandhari  6 Marta Giovanetti  20   21 Diana Hardie  16   22 Verity Hill  13 Nei-Yuan Hsiao  16   22   23 Arash Iranzadeh  24 Arshad Ismail  5 Charity Joseph  12 Rageema Joseph  16 Legodile Koopile  2 Sergei L Kosakovsky Pond  25 Moritz U G Kraemer  17 Lesego Kuate-Lere  26 Oluwakemi Laguda-Akingba  27   28 Onalethatha Lesetedi-Mafoko  29 Richard J Lessells  6 Shahin Lockman  2   30 Alexander G Lucaci  25 Arisha Maharaj  6 Boitshoko Mahlangu  5 Tongai Maponga  19 Kamela Mahlakwane  19   31 Zinhle Makatini  32 Gert Marais  16   22 Dorcas Maruapula  2 Kereng Masupu  4 Mogomotsi Matshaba  4   33   34 Simnikiwe Mayaphi  35 Nokuzola Mbhele  16 Mpaphi B Mbulawa  36 Adriano Mendes  14 Koleka Mlisana  37   38 Anele Mnguni  5 Thabo Mohale  5 Monika Moir  39 Kgomotso Moruisi  26 Mosepele Mosepele  4   40 Gerald Motsatsi  5 Modisa S Motswaledi  4   41 Thongbotho Mphoyakgosi  36 Nokukhanya Msomi  42 Peter N Mwangi  10   43 Yeshnee Naidoo  6 Noxolo Ntuli  5 Martin Nyaga  10   43 Lucier Olubayo  23   24 Sureshnee Pillay  6 Botshelo Radibe  2 Yajna Ramphal  6 Upasana Ramphal  6 James E San  6 Lesley Scott  44 Roger Shapiro  2   30 Lavanya Singh  6 Pamela Smith-Lawrence  26 Wendy Stevens  44 Amy Strydom  14 Kathleen Subramoney  32 Naume Tebeila  5 Derek Tshiabuila  6 Joseph Tsui  17 Stephanie van Wyk  39 Steven Weaver  25 Constantinos K Wibmer  5 Eduan Wilkinson  39 Nicole Wolter  5   45 Alexander E Zarebski  17 Boitumelo Zuze  2 Dominique Goedhals  10   46 Wolfgang Preiser  19   31 Florette Treurnicht  32 Marietje Venter  14 Carolyn Williamson  16   22   23   47 Oliver G Pybus  17 Jinal Bhiman  5   7 Allison Glass  1   48 Darren P Martin  23   47 Andrew Rambaut  13 Simani Gaseitsiwe  2   3 Anne von Gottberg  5   45 Tulio de Oliveira  49   50   51
Affiliations

Rapid epidemic expansion of the SARS-CoV-2 Omicron variant in southern Africa

Raquel Viana et al. Nature. 2022 Mar.

Abstract

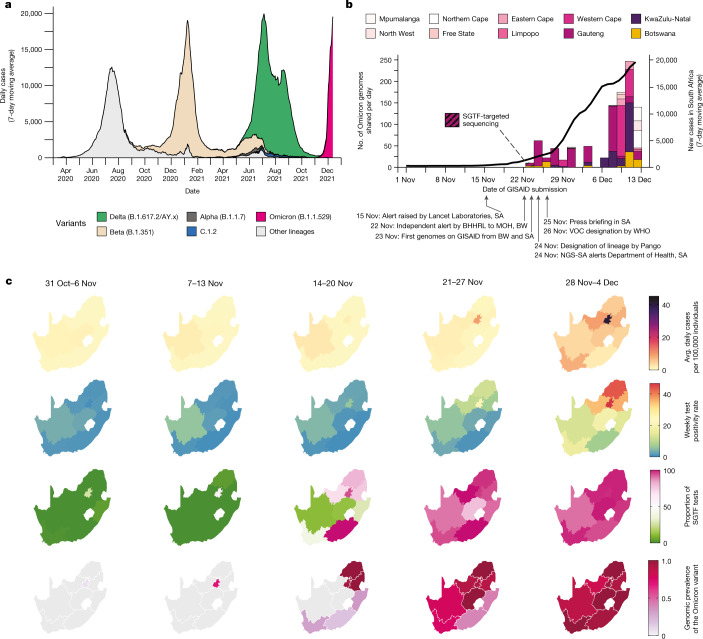
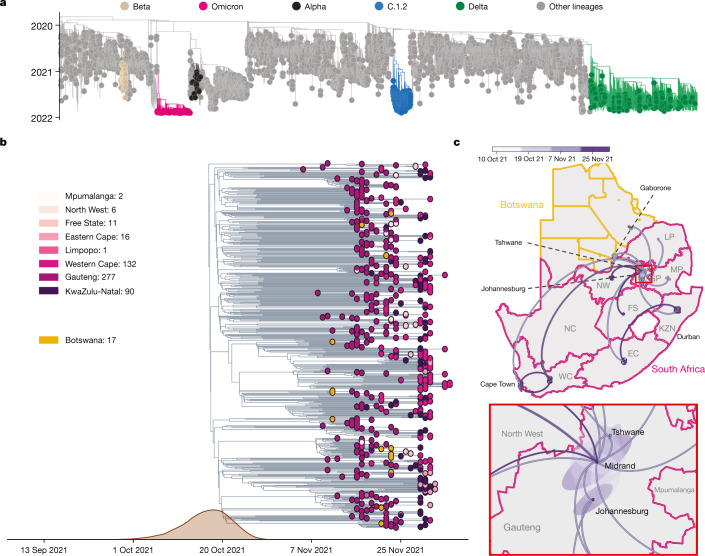
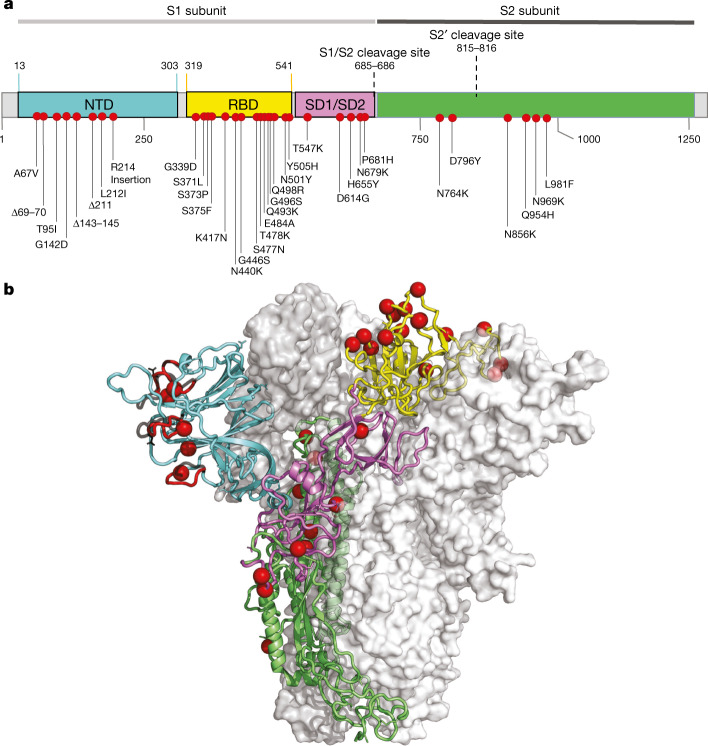
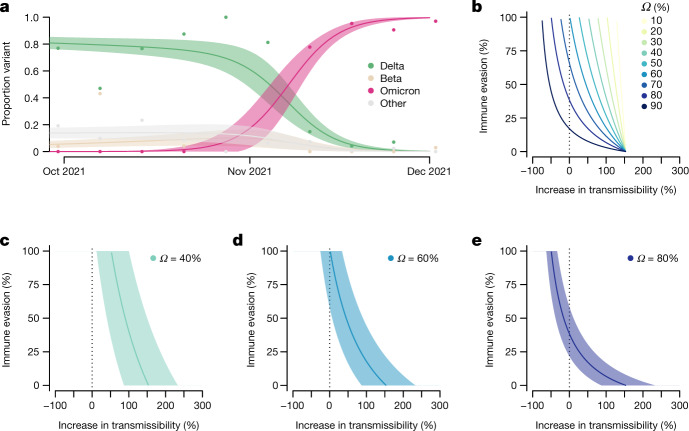
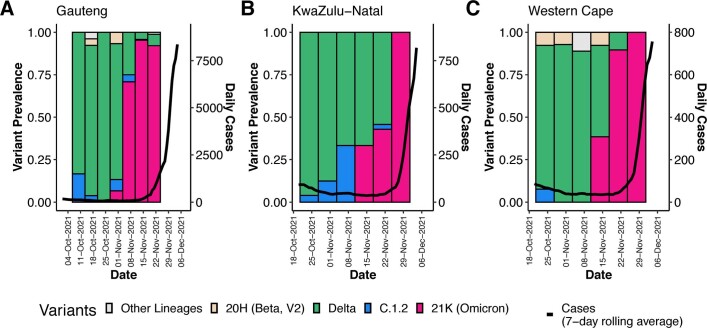
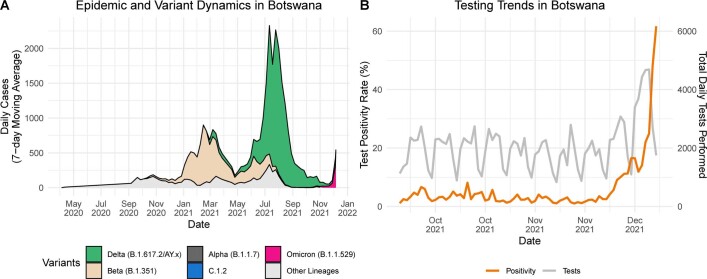
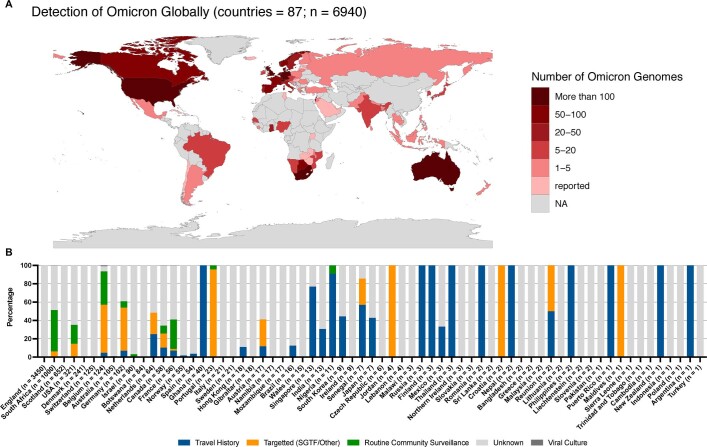
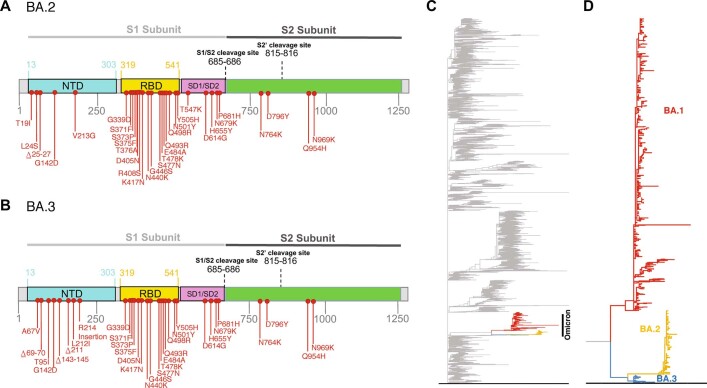
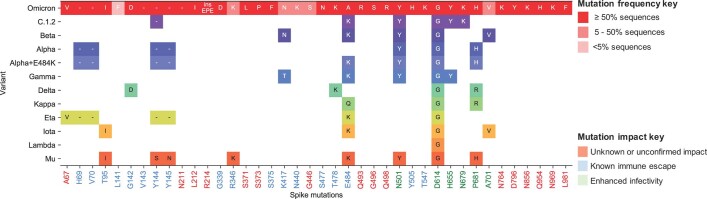
The SARS-CoV-2 epidemic in southern Africa has been characterized by three distinct waves. The first was associated with a mix of SARS-CoV-2 lineages, while the second and third waves were driven by the Beta (B.1.351) and Delta (B.1.617.2) variants, respectively1-3. In November 2021, genomic surveillance teams in South Africa and Botswana detected a new SARS-CoV-2 variant associated with a rapid resurgence of infections in Gauteng province, South Africa. Within three days of the first genome being uploaded, it was designated a variant of concern (Omicron, B.1.1.529) by the World Health Organization and, within three weeks, had been identified in 87 countries. The Omicron variant is exceptional for carrying over 30 mutations in the spike glycoprotein, which are predicted to influence antibody neutralization and spike function4. Here we describe the genomic profile and early transmission dynamics of Omicron, highlighting the rapid spread in regions with high levels of population immunity.


Conflict of interest statement

The authors declare no competing interests.

Figures

Fig. 1
Fig. 1. Detection of Omicron variant.
a, The progression of daily reported cases in South Africa from March 2020 to December 2021. The 7-day rolling average of daily case numbers is coloured by the inferred proportion of variants responsible for the infections, as calculated by genomic surveillance data on GISAID. b, Timeline of Omicron detection in Botswana and South Africa. Bars represent the number of Omicron genomes shared per day, according to the date they were uploaded to GISAID; the line represents the 7-day moving average of daily new cases in South Africa. BHHRL, Botswana Harvard HIV Reference Laboratory; BW, Botswana; NGS-SA, Network for Genomic Surveillance in South Africa; SA, South Africa. c, Weekly progression of average daily cases per 100,000 individuals, test positivity rates, proportion of SGTF tests (on the TaqPath COVID-19 PCR assay) and genomic prevalence of Omicron in nine provinces of South Africa for five weeks from 31 October to 4 December 2021. Note that, because of heterogeneous use of the TaqPath PCR assay across provinces, the proportion of SGTF tests illustrated for the Eastern Cape province in weeks of 14–20 November and 21–27 November 2021 are based on only 2 and 4 data points, respectively. Genomic prevalence here is equivalent to the proportion of weekly surveillance sequences genotyped as being Omicron.
Fig. 2
Fig. 2. Evolution of Omicron.
a, Time-resolved maximum likelihood phylogeny of 13,295 SARS-CoV-2 genomes; 9,944 of these are from Africa (denoted with tip point circle shapes). Alpha, Beta and Delta VOCs and the C.1.2 lineage, recently circulating in South Africa, are denoted in black, brown, green and blue, respectively. The newly identified SARS-CoV-2 Omicron variant is shown in pink. Genomes of other lineages are shown in grey. b, Time-resolved maximum clade credibility phylogeny of the Omicron cluster of southern African genomes (n = 553), with locations indicated. The posterior distribution of the TMRCA is also shown. c, Spatiotemporal reconstruction of the spread of the Omicron variant in southern Africa with an inset of Gauteng province. Circles represent nodes of the maximum clade credibility phylogeny, coloured according to their inferred time of occurrence (scale in the top panel). Shaded areas represent the 80% HPD interval and depict the uncertainty of the phylogeographical estimates for each node. Solid curved lines denote the links between nodes and the directionality of movement is anticlockwise along the curve. EC, Eastern Cape; FS, Free State; GP, Gauteng; KZN, KwaZulu-Natal; LP, Limpopo; MP, Mpumalanga; NC, Northern Cape; NW, North West; WC, Western Cape.
Fig. 3
Fig. 3. Molecular profile of BA.1.
a, Amino acid mutations on the spike gene of the BA.1 variant. b, The structure of the SARS-CoV-2 spike trimer, showing a single spike protomer in cartoon view. The NTD, RBD, subdomains 1 and 2, and the S2 protein are shown in cyan, yellow, pink, and green, respectively. The red spheres indicate the alpha carbon positions for each omicron variant residue. NTD-specific loop insertions/deletions are shown in red, with the original loop shown in transparent black.
Fig. 4
Fig. 4. Growth of Omicron in Gauteng, South Africa, and the relationship between potential increase in transmissibility and immune evasion.
a, Omicron rapidly outcompeted Delta in November 2021. Model fits are based on a multinomial logistic regression. Dots represent the weekly proportions of variants. b, The relationship between the potential increase in transmissibility and immune evasion strongly depends on the assumed level of current population immunity against Delta that is afforded by previous infections during earlier epidemic waves and/or vaccination (Ω). ce, The relationship for a population immunity of 40% (c), 60% (d) and 80% (e) against infection and transmission with Delta. The dark vertical dashed line indicates equal transmissibility of Omicron compared to Delta. The shaded areas correspond to the 95% CIs of the model estimates.
Extended Data Fig. 1
Extended Data Fig. 1. Progression of daily recorded cases and variant proportions in Gauteng (A), KwaZulu-Natal (B) and Western Cape (C) provinces between October and December 2021.
A sharp increase in the 7-day rolling average of the number of cases is observed in all three of the biggest provinces in South Africa at the emergence of the Omicron variant.
Extended Data Fig. 2
Extended Data Fig. 2. Epidemic Progression in Botswana.
A) Epidemic and variant dynamics in Botswana from May 2020 to December 2021, with the 7-day rolling average of the number of recorded cases coloured by the proportion of variants as inferred by genomic surveillance data available on GISAID. At the end of November 2021, a big Delta-driven wave was coming to its end and an Omicron wave was starting at the end of November 2021. B) Trends in testing numbers and positivity rates in Botswana between October and December 2021, showing a sharp increase in positivity rate mid-November 2021.
Extended Data Fig. 3
Extended Data Fig. 3. Global distribution of Omicron.
(A) Detection of Omicron globally. Shown are the locations for which Omicron genomes have been deposited on GISAID as of December 16, 2021. Those labelled as “reported” referred to the country from which Omicron has been reported to the WHO but there is currently no sequencing data available in GISAID, all data comes from GISAID and the WHO weekly epidemiology report Edition 70 dated December 14, 2021 (https://reliefweb.int/sites/reliefweb.int/files/resources/20211207_Weekly_Epi_Update_69-%281%29.pdf). Countries are coloured according to the number of genomes deposited with warmer colours representing more genomes. (B) Omicron transmission globally. Shown are countries for which Omicron sequencing data is available on GISAID. Proportions of sequences are coloured according to sampling strategy or additional host/location information from either travel history, targeted sequencing (specifically for SGTF, vaccine breakthroughs, outbreaks, contact tracing or other reasons), routine surveillance or unknown if no information has been provided. Countries are ordered by the number of sequences available on GISAID as of December 16, 2021.
Extended Data Fig. 4
Extended Data Fig. 4. Related Lineages BA.2 and BA.3 Molecular Profile and Evolutionary Origins.
A) Amino-acid mutations on the spike gene of the BA.2 B) Amino-acid mutations on the spike gene of the BA.3 C) Raw maximum likelihood phylogeny of 13,462 SARS-CoV-2 genomes, including 148 BA.2 and 19 BA.3. The newly identified SARS-CoV-2 Omicron variant is shown in colour versus grey for all other lineages. D) A zoomed-in view of the Omicron clade showing the evolutionary relationship between BA.1, BA.2 and BA.3.
Extended Data Fig. 5
Extended Data Fig. 5. BA.1 spike mutations shared with other VOC/VOIs.
All spike mutations seen in BA.1 are listed at the top in red and coloured according to prevalence. Prevalence was calculated by number of mutation detections / total number of sequences. However, primer drop-outs have affected the RBD region spanning K417N, N440K and G446S, and so it is likely that these mutations may actually be more prevalent than indicated here. For the VOC/VOIs only mutations that are shared with Omicron and seen in ≥50% of the respective VOC/VOI sequences are shown and are coloured according to Nextstrain clade. The mutations listed at the bottom are shaded according to known immune escape (blue), enhanced infectivity (green) or for unknown/unconfirmed impact (red).
Extended Data Fig. 6
Extended Data Fig. 6. Maximum-likelihood trees (inferred with RAxML v8.2.12) for genome regions bounding the consensus recombination breakpoints detected in lineages BA.1, BA.2 and BA.3.
The trees include SARS-CoV-2 genome sequences sampled in 2021 (N = 221) together with 13 sequences representing the BA.1, BA.2 and BA.3 lineages. Whereas in trees for regions 1 and 3 BA.2 and BA.3 cluster together with high bootstrap support, BA.1 is a well-supported albeit more distantly related sibling lineage. The a 897nt region 2 segment (encoding the N-terminal domain of spike) includes 67 polymorphic sites with a maximum 8nt difference between strains, showing little bootstrap support for any sibling or clade relationships except the membership of certain viruses in WHO-designated clades (Lambda, Omicron, Gamma). Despite Omicron lineages BA.1 and BA.3 clustering with certain Delta and Eta viruses and Omicron BA.2 clustering with a distinct set of Delta viruses (all on the basis of several key nucleotide positions), trees based on region 2 show no statistical support for the three Omicron lineages having distinct evolutionary origins. Bootstrap values are shown on branches with relevant values magnified for readability. All trees were rooted on the Wuhan-Hu-1 sequence.

Comment in

References

    1. Tegally H, et al. Sixteen novel lineages of SARS-CoV-2 in South Africa. Nat. Med. 2021;27:440–446. - PubMed
    1. Tegally H, et al. Detection of a SARS-CoV-2 variant of concern in South Africa. Nature. 2021;592:438–443. - PubMed
    1. Tegally, H. et al. Rapid replacement of the Beta variant by the Delta variant in South Africa. Preprint at medRxiv10.1101/2021.09.23.21264018 (2021).
    1. Martin, D. P. et al. Selection analysis identifies unusual clustered mutational changes in Omicron lineage BA.1 that likely impact Spike function. Preprint at bioRxiv10.1101/2022.01.14.476382 (2022). - PMC - PubMed
    1. Faria NR, et al. Genomics and epidemiology of the P.1 SARS-CoV-2 lineage in Manaus, Brazil. Science. 2021;372:815–821. - PMC - PubMed

Publication types

Substances

Supplementary concepts