. 2022 May 10;6(9):2932-2946.
doi: 10.1182/bloodadvances.2021006073.

Analysis of preplatelets and their barbell platelet derivatives by imaging flow cytometry

Affiliations

Analysis of preplatelets and their barbell platelet derivatives by imaging flow cytometry

Samuel Kemble et al. Blood Adv. .

Abstract

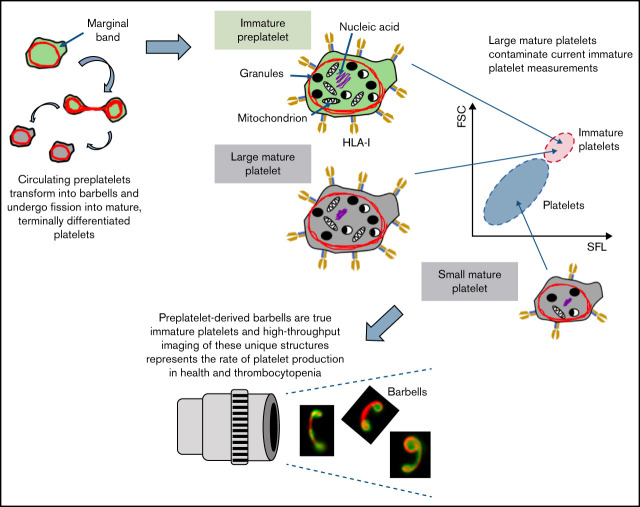
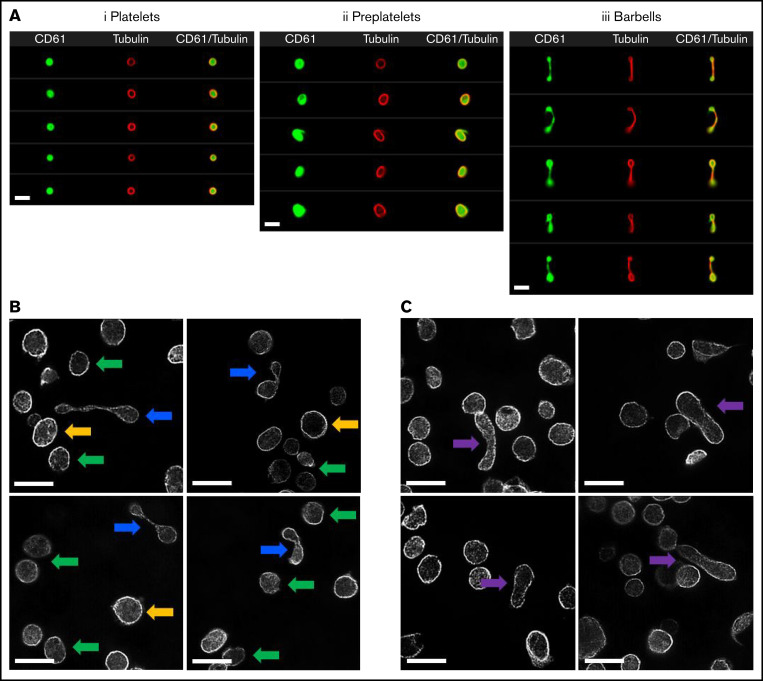
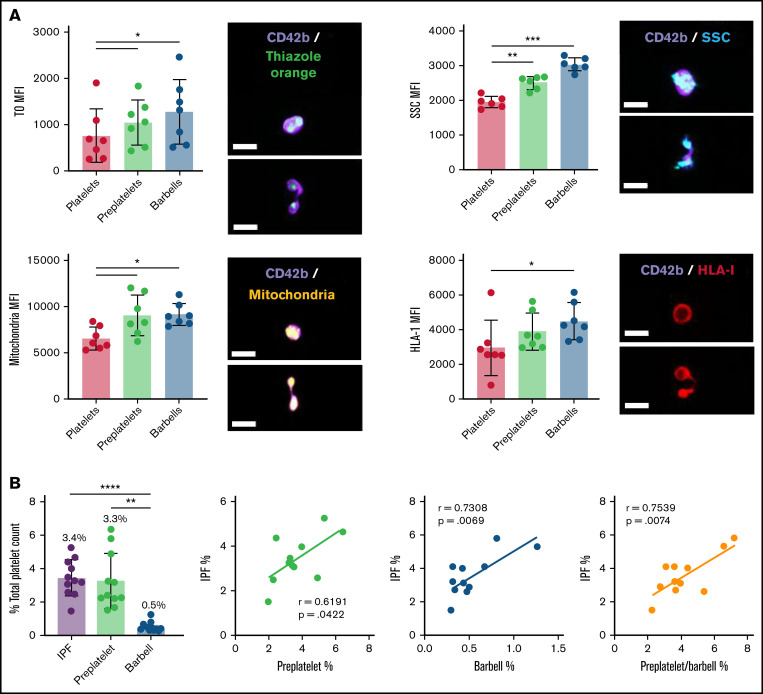
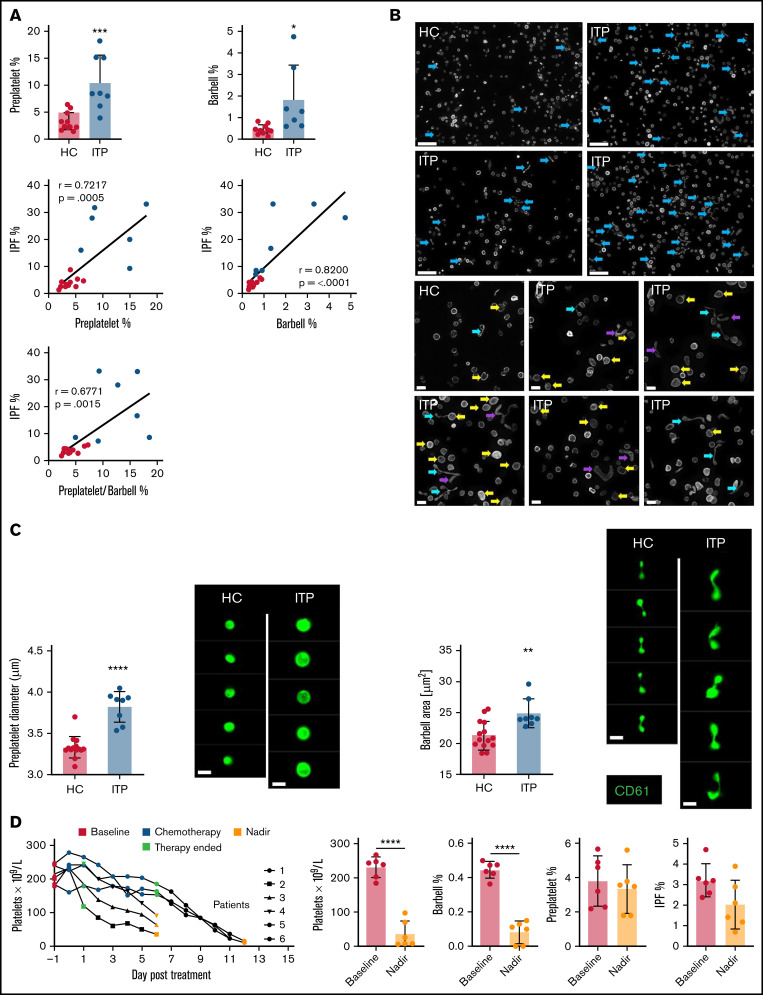
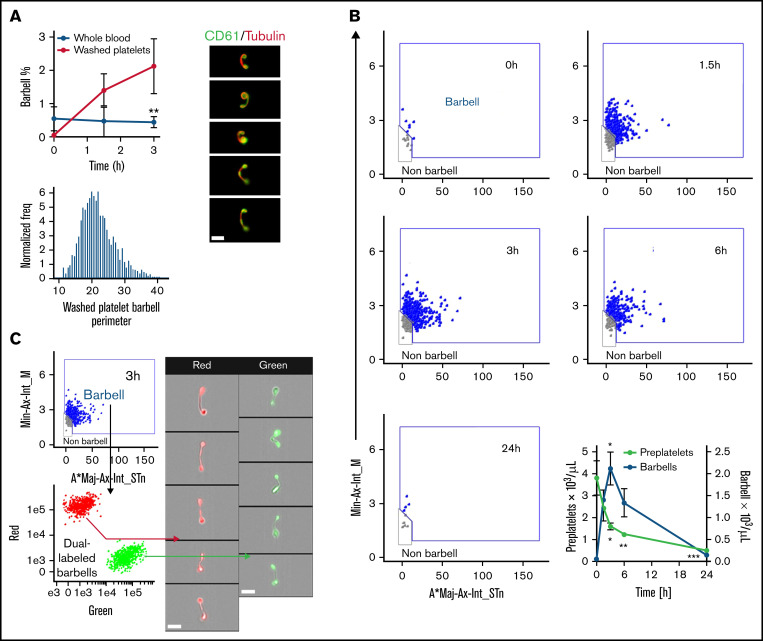
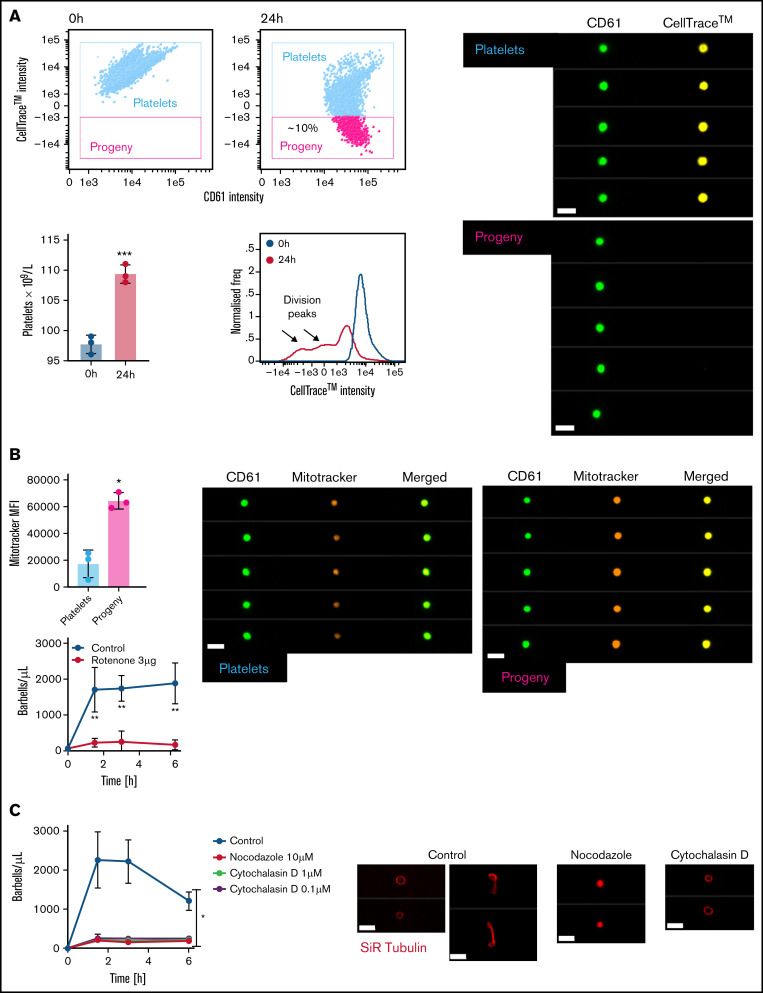
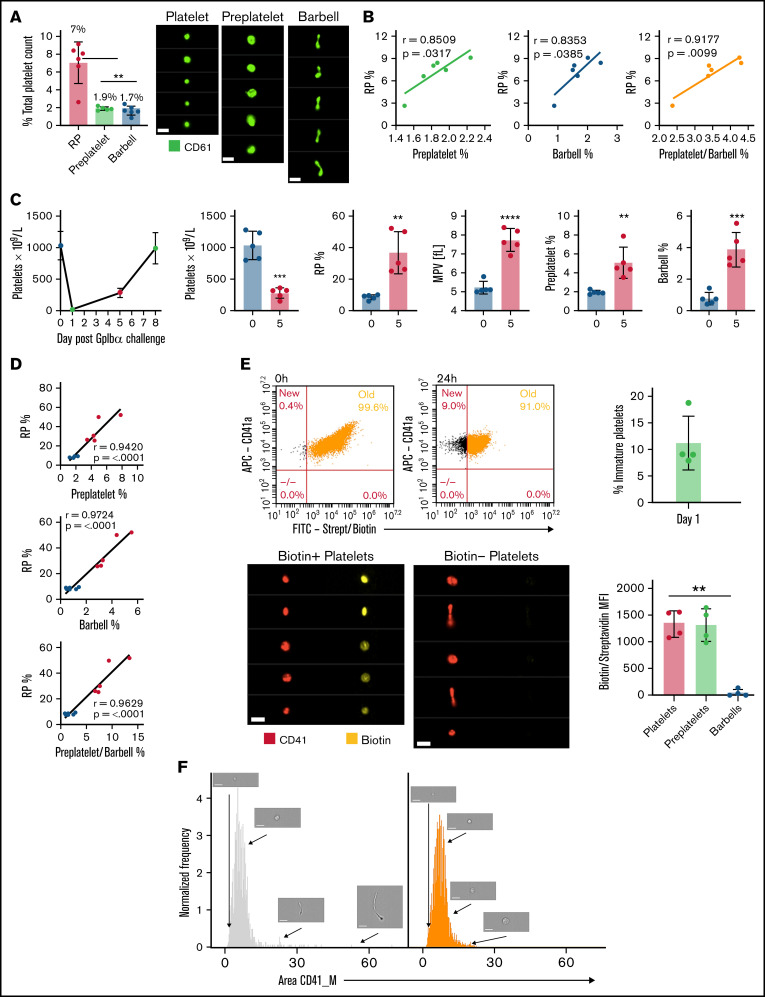
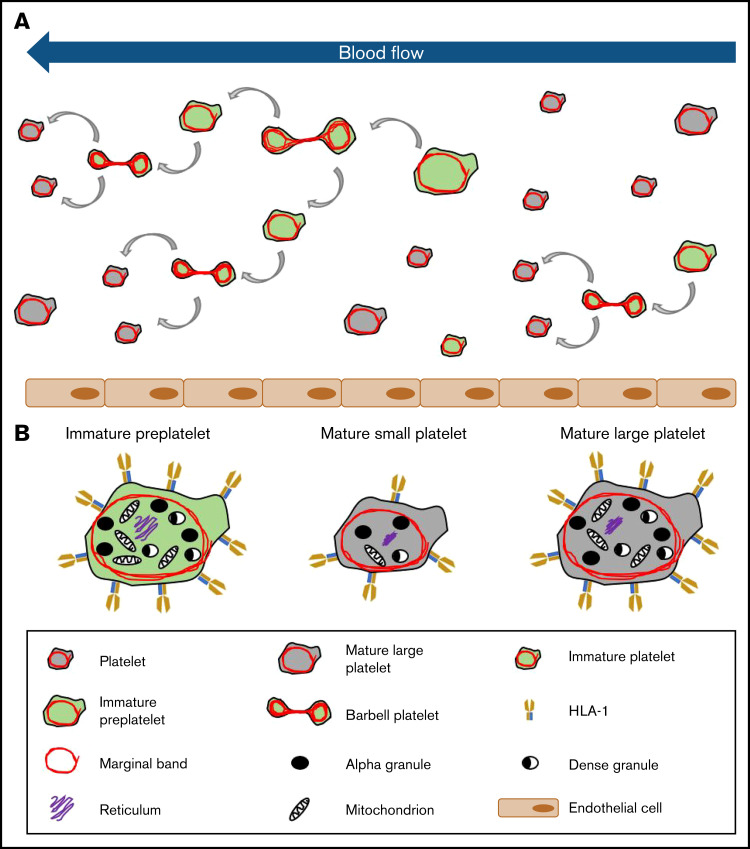
Circulating large "preplatelets" undergo fission via barbell platelet intermediates into two smaller, mature platelets. In this study, we determine whether preplatelets and/or barbells are equivalent to reticulated/immature platelets by using ImageStream flow cytometry and super-resolution microscopy. Immature platelets, preplatelets, and barbells were quantified in healthy and thrombocytopenic mice, healthy human volunteers, and patients with immune thrombocytopenia or undergoing chemotherapy. Preplatelets and barbells were 1.9% ± 0.18%/1.7% ± 0.48% (n = 6) and 3.3% ± 1.6%/0.5% ± 0.27% (n = 12) of total platelet counts in murine and human whole blood, respectively. Both preplatelets and barbells exhibited high expression of major histocompatibility complex class I with high thiazole orange and Mitotracker fluorescence. Tracking dye experiments confirmed that preplatelets transform into barbells and undergo fission ex vivo to increase platelet counts, with dependence on the cytoskeleton and normal mitochondrial respiration. Samples from antibody-induced thrombocytopenia in mice and patients with immune thrombocytopenia had increased levels of both preplatelets and barbells correlating with immature platelet levels. Furthermore, barbells were absent after chemotherapy in patients. In mice, in vivo biotinylation confirmed that barbells, but not all large platelets, were immature. This study demonstrates that a subpopulation of large platelets are immature preplatelets that can transform into barbells and undergo fission during maturation.


Figures

None
Graphical abstract
Figure 1.
Figure 1.
Imaging of platelets, preplatelets, and barbells in normal human blood. (A) Healthy control trisodium citrate blood was labeled immediately after phlebotomy with FITC anti-CD61 and AF674 SiR tubulin (4 μM) for 30 minutes at 37°C, and 10 000 CD61+ platelet images were acquired with ISFC. SiR tubulin labeling clearly depicts the marginal band of platelets, preplatelets (ii), and barbell platelets (iii), discriminated by ISFC (×60 magnification). Images are representative of a single experiment (n = 5). Bars represent 7 μm. (B) Platelet-rich plasma were separated from citrated whole blood immediately after phlebotomy at 37°C and were labeled for α-tubulin and imaged using super-resolution structured illumination microscopy. Original magnification, ×100; n = 3. Circular platelets (≤3 μm; green arrows) and preplatelets (≥3 μm; yellow arrows) are shown along with barbell platelets (blue arrows). (C) Circular platelets are shown along with intermediate elongated preplatelets (purple arrows). Bars represent 5 μm.
Figure 2.
Figure 2.
Quantification of RPs, preplatelets, and barbells in human whole blood. Healthy control trisodium citrate–anticoagulated whole blood was labeled immediately after phlebotomy with anti-CD42b BV421 and TO, Mitotracker AF599, or anti-HLA-I APC (n = 5; bar represents 7 μm), and granularity was determined by SCC light. (A) Representative images of preplatelets and barbells with each label are shown. Mean fluorescence intensity (MFI) was normalized to the cellular perimeter. (B) Under the same conditions, citrate blood was labeled with anti-CD61 FITC and CD62p BV421 for 15 minutes at 37°C, %IPF platelets was measured by Sysmex XN1000, and preplatelets and barbells were quantified by ISFC and correlated with IPF (n = 12). (A-B) One-way analysis of variance with Dunnett’s multiple-comparisons test ±1 standard deviation; (B) Pearson’s correlation coefficient. *P < .05; **P < .01; ***P < .001; ****P < .0001.
Figure 3.
Figure 3.
Quantifying reticulated platelets, preplatelets, and barbells in acquired thrombocytopenia. All measurements were performed in trisodium citrate–anticoagulated whole blood. (A) Healthy control (HC; green dots; n = 12) and ITP (red dots; n = 7) blood was incubated at 37°C for 1.5 hours; platelet count, MPV, and IPF were measured by the XN1000 hematology analyzer (Sysmex); and preplatelets and barbells were measured by ISFC with correlations between IPF% and preplatelets and/or barbells. (B) α-Tubulin immunofluorescence imaging of control and ITP platelet-rich plasma displaying preplatelets (yellow arrows), barbells (blue arrows), and elongated preplatelets (purple arrows; n = 3; Leica DM6000 wide-field microscope, ×60 magnification; bars represent 5 μm). (C) Mean diameter of preplatelets and area of barbell platelets measured by ISFC in healthy control blood (n = 15) vs ITP blood (n = 8; bar represents 7 μm). (D) Blood samples were taken from patients with high-grade lymphoma or myeloma before chemotherapy (baseline; day −1), 5-7 days after stem cell autograft (nadir). Platelet counts and IPF were measured by the XN1000 analyzer and preplatelets and barbells by ISFC (n = 6). (A-B,D) Unpaired t-test ±1 standard deviation. (A) Pearson’s correlation coefficient. *P < .05, **P < .01, ***P < .001; ****P < .0001.
Figure 4.
Figure 4.
Kinetics of preplatelet maturation. (A) Whole blood and washed platelets anticoagulated with trisodium citrate (citrate blood) was incubated for 3 hours at 37°C to determine change in barbell formation quantified by ISFC at 0, 1.5, and 3 hours and labeled with FITC anti-CD61 and AF674 SiR tubulin (4 μM; n = 6). Washed platelet barbell perimeter measured by ISFC (n = 6). SiR tubulin live-cell labeling of washed platelet barbells (n = 3; bar represents 7 μm). (B-C) Experiments were conducted with washed platelets from human control citrate blood incubated in M199 medium at 37°C for a maximum of 24 hours. (B) Barbell platelet formation at 0, 1.5, 3, 6, and 24 hour time points (visualized using the image flow cytometry barbell gate described in supplemental Figure 3). Quantification of preplatelets and barbells at 0, 1.5, 3, 6, and 24 hour time points (n = 10). (C) before incubation, washed platelets were labeled with either CellTrace™ green (0.2 μg/mL) or red (1 μg/mL) cytosolic dyes, mixed, and incubated for 3 hours to demonstrate that barbells originate from single platelets (n = 3; imaged by ISFC, ×60 magnification; bars represent 7 μm). A*Maj-Ax-Int, area × major axis intensity; Min-Ax-Int, minor axis intensity. (A-B) Two-way analysis of variance with Bonferroni multiple-comparisons test ±1 standard deviation. *P < .05, **P < .01, ***P < .001.
Figure 5.
Figure 5.
Mapping preplatelet maturation in vitro. Washed platelets were labeled with 2 μg/mL of CellTrace™ yellow cytosolic dye and incubated in serum-free M199 medium for 24 hours. (A) Scatterplots demonstrate the appearance of a discrete population of platelets termed “progeny,” which display a decrease in CellTrace™ yellow MFI (images depicted by CD61 and CellTrace™ fluorescence, using ISFC, ×60 magnification). Percentage increase in platelet count; the CellTrace™ fluorescence profile at 0 and 24 hours is also demonstrated. (B) AF599 Mitotracker Ros CMX MFI of platelets and platelet progeny with representative images and the effect of rotenone (3 μg/mL) on barbell formation when incubating washed platelets for 6 hours. (C) Washed platelets were incubated for 6 hours with nocodazole (10 μM) or cytochalasin D (1 or 0.1 μM), and barbells were quantified by ISFC. To show the effect of either cytoskeletal drug, marginal band morphology was depicted by using AF674 SiR tubulin live-cell labeling (n = 3). (A-C) Bars represent 7 μm. (A) Paired t-test, (B) Mann-Whitney U test and Wilcoxon test, and (C) 2-way analysis of variance. (A-C) ±1 standard deviation. *P < .05; **P < .01; ***P ≤ .001.
Figure 6.
Figure 6.
Preplatelets are newly formed immature reticulated platelets. (A) Trisodium citrate–anticoagulated whole blood from WT mice was incubated for 1.5 hours at 37°C, and percentages of RPs identified by flow cytometry and preplatelets and barbells identified by ISFC using anti-CD61-FITC were quantified. Bars represent 7 μm. (B) Preplatelets and/or barbells correlated with RPs (n = 6). (C) Mice (n = 5) were treated with a GPIbα polyclonal antibody (1.5 μg/mL), and platelet counts and MPV were measured by an ABX Pentra 60 (Horiba) hematology analyzer and RPs by flow cytometry with TO labeling on day 0, 1, 5, or 7. (D) Also, preplatelets and barbells were quantified by ISFC with FITC CD61 at days 0 (before platelet depletion) and 5 (after platelet engraftment) and correlated with RPs. Mice (n = 4) were injected IV twice with NHS biotin (4 mg/mL) to label all circulating blood cells with biotin, bled 0 and 24 hours later, and labeled with APC anti-CD41 and FITC-conjugated streptavidin. (E) All circulating platelets were verified as biotin positive at baseline, and newly formed platelets at 24 hours after biotinylation were determined to be biotin negative. Representative ISFC images show biotin-positive and -negative platelet morphology (×60 magnification). Bars represent 7 μm. Biotin MFI of platelets, preplatelets, and barbells was also measured by ISFC at 24 hours. (F) ISFC to determine the size distribution of biotin-negative (immature) and -positive (mature) platelets 24 hours after injection (representative images are depicted with brightfield ISFC imaging, ×60 lens) Bars represent 7 μm. (A,E) One-way analysis of variance with Tukey test, (B,D) Pearson’s correlation coefficient, and (C) unpaired t-test. (A,C,E) ±1 standard deviation. **P < .01; ***P < .001; ****P < .0001.
Figure 7.
Figure 7.
Model of platelet maturation in the bloodstream. (A) Circulating platelets are heterogeneous in size and age. Immature platelets >3 μm in diameter are termed preplatelets (identified by green cytoplasm). These platelet progenitor cells mature by continuously transforming into barbell platelets and undergoing fission into 2 smaller platelets until reaching a size threshold of <3 μm in diameter. Under steady-state production, not all large platelets are immature. Unlike preplatelets, these lack the capacity to undergo maturation. Therefore, mature platelets consist of small and large platelets (identified by gray cytoplasm). (B) Barbell platelets originate from immature preplatelets consisting of a greater nucleic acid content, granule content, number of mitochondria, and HLA I expression, compared with mature small platelets. In contrast, mature large platelets contain a similar number of granules and mitochondria, which are nonspecifically labeled with dyes used for measuring IPF and RPs. Large, mature platelets express slightly less HLA I than immature preplatelets, which could separate preplatelets from mature, large platelets.

References

    1. Machlus KR, Italiano JE Jr. The incredible journey: from megakaryocyte development to platelet formation. J Cell Biol. 2013;201(6):785-796. - PMC - PubMed
    1. Kaushansky K. The molecular mechanisms that control thrombopoiesis. J Clin Invest. 2005;115(12):3339-3347. - PMC - PubMed
    1. Ault KA, Knowles C. In vivo biotinylation demonstrates that reticulated platelets are the youngest platelets in circulation. Exp Hematol. 1995;23(9):996-1001. - PubMed
    1. Ingram M, Coopersmith A. Reticulated platelets following acute blood loss. Br J Haematol. 1969;17(3):225-229. - PubMed
    1. Kienast J, Schmitz G. Flow cytometric analysis of thiazole orange uptake by platelets: a diagnostic aid in the evaluation of thrombocytopenic disorders. Blood. 1990;75(1):116-121. - PubMed

Publication types