. 2022 Jan;12(1):210343.
doi: 10.1098/rsob.210343. Epub 2022 Jan 19.

Daughter centrioles assemble preferentially towards the nuclear envelope in Drosophila syncytial embryos

Affiliations

Daughter centrioles assemble preferentially towards the nuclear envelope in Drosophila syncytial embryos

Neil H J Cunningham et al. Open Biol. 2022 Jan.

Abstract

Centrosomes are important organizers of microtubules within animal cells. They comprise a pair of centrioles surrounded by the pericentriolar material, which nucleates and organizes the microtubules. To maintain centrosome numbers, centrioles must duplicate once and only once per cell cycle. During S-phase, a single new 'daughter' centriole is built orthogonally on one side of each radially symmetric 'mother' centriole. Mis-regulation of duplication can result in the simultaneous formation of multiple daughter centrioles around a single mother centriole, leading to centrosome amplification, a hallmark of cancer. It remains unclear how a single duplication site is established. It also remains unknown whether this site is pre-defined or randomly positioned around the mother centriole. Here, we show that within Drosophila syncytial embryos daughter centrioles preferentially assemble on the side of the mother facing the nuclear envelope, to which the centrosomes are closely attached. This positional preference is established early during duplication and remains stable throughout daughter centriole assembly, but is lost in centrosomes forced to lose their connection to the nuclear envelope. This shows that non-centrosomal cues influence centriole duplication and raises the possibility that these external cues could help establish a single duplication site.

Keywords: Drosophila; centriole; centriole duplication; centrosome; microtubules.


Conflict of interest statement

We declare we have no competing interests.

Figures
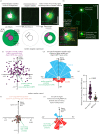
Figure 1.
Figure 1.
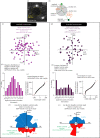
Analysis of dual-colour FRAP data reveals that the site of daughter centriole assembly is non-random. (a) Confocal images show a centrosome within an embryo expressing Spd-2-GFP (green) and Sas-4-mCherry (magenta) prior to photobleaching (left), immediately after photobleaching (centre) and after fluorescence recovery (right). The diagrams below are cartoon representations of how the proteins behave before and after photobleaching. Note that the recovering Sas-4-mCherry signal (daughter centriole) is offset from the centre of the recovering Spd-2-GFP signal (mother centriole). (b) Confocal image shows a pair of centrosomes (top unbleached, bottom recovering from bleaching) on opposite sides of the nuclear envelope (mid--late S-phase). The nuclear envelope and how angles from the future spindle axis are calculated are indicated. (c) Graph displays the estimated positions of daughter centrioles (magenta circles) relative to the estimated position of their respective mother centrioles (position 0,0 on the graph) and the future spindle axis (positive y-axis) obtained from Spd-2-GFP (mother) Sas-4-mCherry (daughter) data. (d) Rose plot representing the angle at which daughter centrioles (marked by Sas-4-mCherry) form in relation to the future spindle axis (0°). Each segment corresponds to a single duplication event. Blue and red segments indicate daughter centriole assembly occurring less than or more than 90° from the future spindle axis, respectively. (e) Graph displays the positions of the centre of recovering RFP-Cnn signal relative to recovering Spd-2-GFP signal (position 0,0 on the graph) and the future spindle axis (positive y-axis) obtained from the control Spd-2-GFP (mother) RFP-Cnn (mother) data. (f) Rose plot (as in (d)) representing the angle relative to the future spindle axis (0°) formed by a line running between the recovering Spd-2-GFP and RFP-Cnn signals. (g) Graph showing the distance between the centre of the recovering Spd-2-GFP signal (mother centriole) and the recovering Sas-4-mCherry signal (daughter centriole, magenta) or the recovering RFP-Cnn signal (mother centriole). The datasets were compared using a Mann–Whitney test.
Figure 2.
Figure 2.
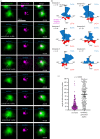
The site of daughter centriole assembly is random in centrosomes that have detached from the nuclear envelope. (a,b) Confocal image (a) and cartoon representation (b) show a pair of centrosomes in S-phase within an embryo expressing GFP-Cnn-T1133A (greyscale). Note that one centrosome is attached to and one centrosome is detached from the nuclear envelope. Cartoon in (b) indicates how the angles of daughter centriole assembly from the nuclear axis were measured. (cj) Graphs display results from analysing the estimated position of daughter centrioles relative to the estimated position of their respective mother centrioles (position 0,0 on the graph) and the nuclear axis (positive y-axis) in centrosomes that have either remained attached to (cf) or that have detached from (dj) the nuclear envelope within embryos expressing GFP-Cnn-T1133A and Sas-4-mCherry. Estimated positions of the daughter centrioles were determined from analysing the centre of fluorescence recovery of GFP-Cnn-T1133A (mother) and Sas-4-mCherry (daughter). Graphs in (c) and (g) show the estimated positions of the daughter centrioles; (d) and (h) are frequency distributions of the angles at which daughter centrioles form in relation to the nuclear axis (0°); (e) and (i) are normal QQ plots showing that the angles in (e), but not in (i), conform well to a Normal distribution; Rose plots in (f) and (j) represent the angle at which daughter centrioles form in relation to the mother centriole and the nuclear axis (0°). Each segment corresponds to a single duplication event. Blue and red segments indicate daughter centriole assembly occurring less than or more than 90° from the nuclear axis, respectively.
Figure 3.
Figure 3.
Cnn-T1133A centrosomes that have detached from the nuclear envelope remain correctly oriented with respect to the imaging axis. (a,b) Airyscan images of centrosomes that are either attached to (a) or detached from (b) the nuclear envelope within embryos expressing GFP-Cnn-T1133A and Sas-4-mCherry in a cnn null mutant background. Examples with a clear central hole (top panels), a partial central hole (middle panels), and a no clear central hole (bottom panels) are shown. (c) Graph shows the percentage of each centrosome type in either attached or detached centrosomes, as indicated. Datasets were compared using a χ2 contingency analysis. (d) Graph shows the distances between the estimated positions of mother and daughter centrioles from the Spd-2-GFP/Sas-4-mCherry FRAP data in either attached or detached centrosomes, as indicated. The datasets were compared using a Mann–Whitney test.
Figure 4.
Figure 4.
Daughter centrioles initially form preferentially towards the nuclear envelope and retain a stable position throughout S-phase. (a) Airyscan images of a centrosome in an embryo expressing Spd-2-GFP (green) and Sas-4-mCherry (magenta) progressing through S-phase. Approximate times after centrosome splitting are indicated—images were collected approximately every minute. The position of the nuclear envelope (as determined by the exclusion of fluorescence from the nucleus) is indicated by the dotted blue line. The Sas-4-mCherry signals for mother (m) and daughter (d) centrioles are also indicated. (b) Rose plot graphs display the angle at which daughter centrioles form in relation to the mother centriole and the nuclear axis (0°) as calculated from time-lapse Airyscan images that followed centrosomes throughout S-phase. Each segment corresponds to a single duplication event. Blue and red segments indicate daughter centriole assembly occurring less than or more than 90° from the nuclear axis, respectively. Each rose plot corresponds to a given timepoint, with timepoint 1 occurring approximately 1 min after centrosome splitting and there being an approximately 1-min gap between timepoints. The numbers of events for each timepoint are indicated; this varies due to the varying ability to resolve the two centrioles through time. (c) Graph shows the change in the angle of the daughter centriole (angle deviation) with respect to the mother centriole and the nuclear axis that occurred between timepoints from real data (left dataset) or randomly generated angles (right dataset). Each point on the graph represents an individual angle deviation. The median and 95% CIs are shown. The p-value indicates that the two datasets have a different distribution (Kolmogorov–Smirnov test).

Similar articles

Cited by

References

    1. Conduit PT, Wainman A, Raff JW. 2015. Centrosome function and assembly in animal cells. Nat. Rev. Mol. Cell Biol. 16, 611-624. (10.1038/nrm4062) - DOI - PubMed
    1. Loncarek J, Bettencourt-Dias M. 2018. Building the right centriole for each cell type. J. Cell Biol. 217, 823-835. (10.1083/jcb.201704093) - DOI - PMC - PubMed
    1. Woodruff JB, Wueseke O, Hyman AA. 2014. Pericentriolar material structure and dynamics. Phil. Trans. R. Soc. B 369, 20130459. (10.1098/rstb.2013.0459) - DOI - PMC - PubMed
    1. Banterle N, Gönczy P. 2017. Centriole biogenesis: from identifying the characters to understanding the plot. Annu. Rev. Cell Dev. Biol. 33, 23-49. (10.1146/annurev-cellbio-100616-060454) - DOI - PubMed
    1. Firat-Karalar EN, Stearns T. 2014. The centriole duplication cycle. Phil. Trans. R. Soc. B 369, 20130460. (10.1098/rstb.2013.0460) - DOI - PMC - PubMed

Publication types

Substances

LinkOut - more resources