. 2022 Jan 26;289(1967):20211694.
doi: 10.1098/rspb.2021.1694. Epub 2022 Jan 19.

Functionally distinct tree species support long-term productivity in extreme environments

Affiliations

Functionally distinct tree species support long-term productivity in extreme environments

Léo Delalandre et al. Proc Biol Sci. .

Abstract

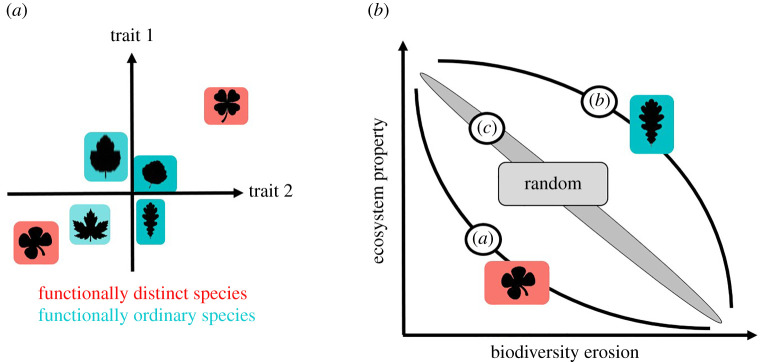
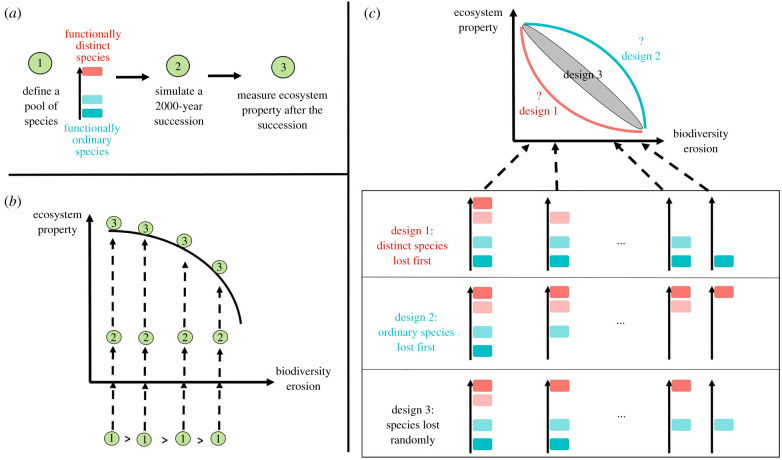
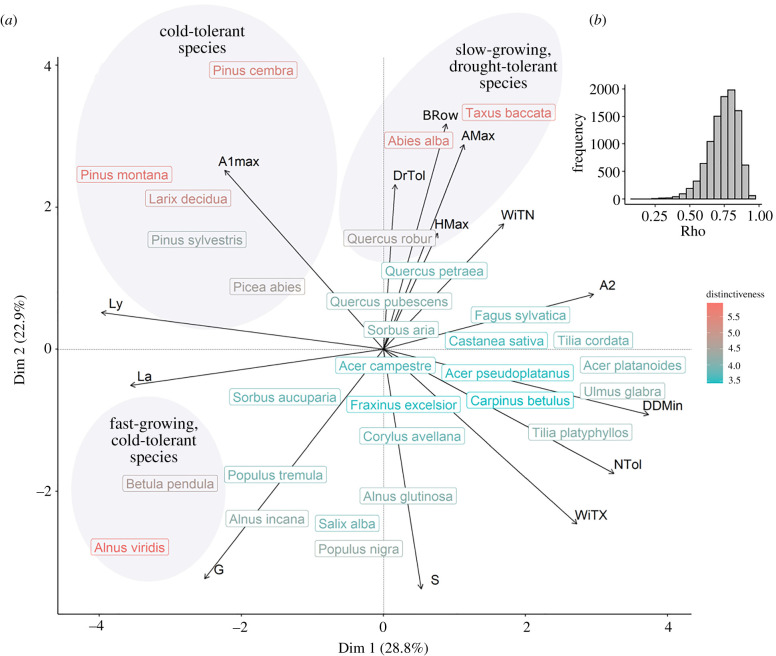
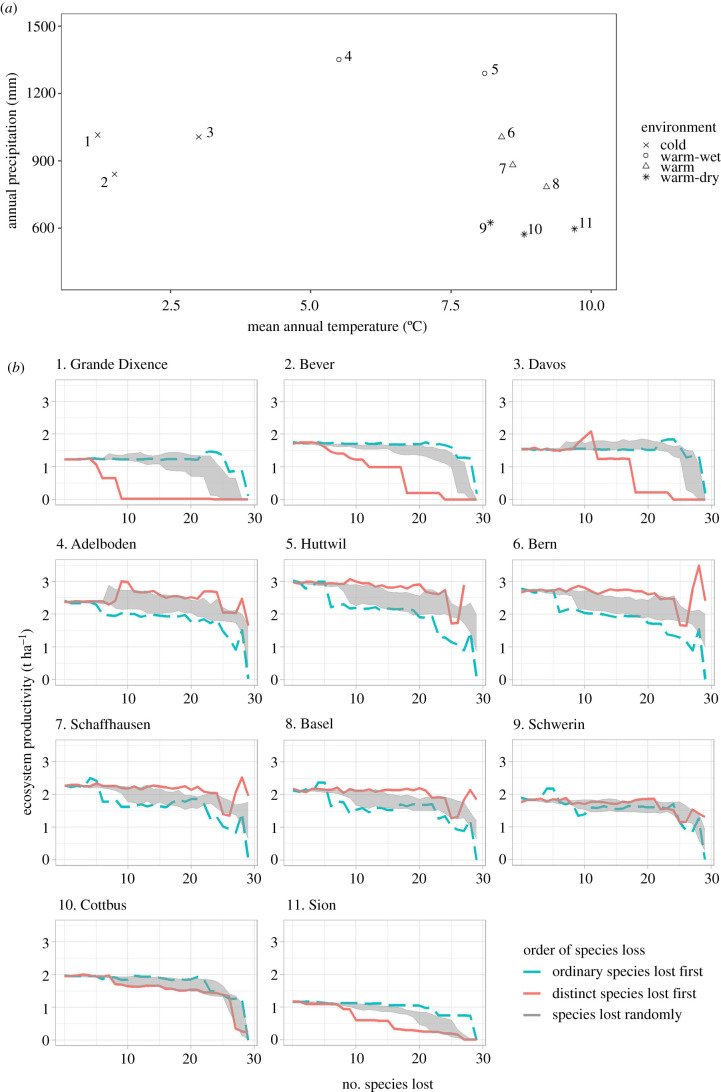
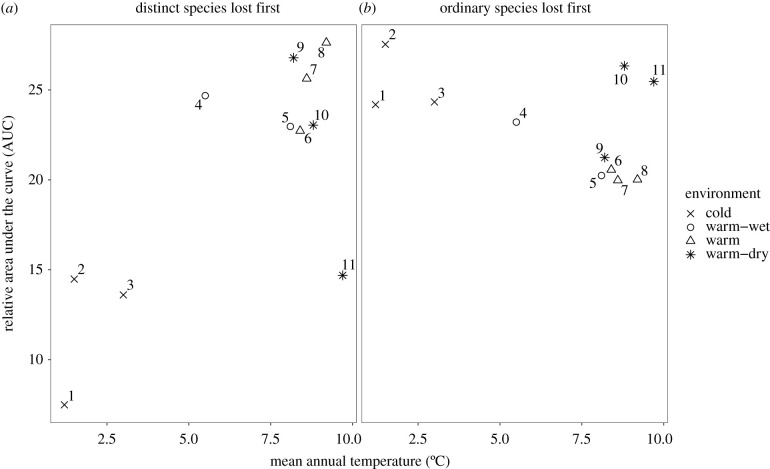
Despite evidence of a positive effect of functional diversity on ecosystem productivity, the importance of functionally distinct species (i.e. species that display an original combination of traits) is poorly understood. To investigate how distinct species affect ecosystem productivity, we used a forest-gap model to simulate realistic temperate forest successions along an environmental gradient and measured ecosystem productivity at the end of the successional trajectories. We performed 10 560 simulations with different sets and numbers of species, bearing either distinct or indistinct functional traits, and compared them to random assemblages, to mimic the consequences of a regional loss of species. Long-term ecosystem productivity dropped when distinct species were lost first from the regional pool of species, under the harshest environmental conditions. On the contrary, productivity was more dependent on ordinary species in milder environments. Our findings show that species functional distinctiveness, integrating multiple trait dimensions, can capture species-specific effects on ecosystem productivity. In a context of an environmentally changing world, they highlight the need to investigate the role of distinct species in sustaining ecosystem processes, particularly in extreme environmental conditions.

Keywords: biodiversity and ecosystem functioning; forest-gap model; functional distinctiveness; functional rarity; productivity; virtual ecology.


Figures

Figure 1.
Figure 1.
Conceptual framework of the study (adapted from [8]). A species is schematically represented by a leaf. (a) Six species are located in a two-dimensional functional trait space. Ordinary species (blue background) are those located in the centre of the distribution in that space, whereas distinct species (red background, clover shape) are away from that centre. (b) Diagram showing the expected level of ecosystem property (in this study, productivity) as biodiversity declines, in the hypothesis that distinct phenotypes support important functions in the ecosystem. Orders of species loss are distinct first (a), ordinary first (b) or random (c). (Online version in colour.)
Figure 2.
Figure 2.
Experimental design. (a) A simulation followed three steps. Species were ranked according to their distinctiveness, which is represented by a gradient of colours, from blue (ordinary species, bottom of the arrow) to red (distinct species, top of the arrow). (b) To implement biodiversity loss scenarios, simulations were made using several pools of species. Each pool on the x-axis is a subset of the pool located at its left (which is represented by the sign >). For each pool of species, a simulation was made and the ecosystem productivity was measured and represented on the y-axis. (c) The process was repeated for three designs. Design 3, in which species were lost randomly, was repeated 30 times to give a null distribution against which the results of designs 1 and 2 could be plotted. (Online version in colour.)
Figure 3.
Figure 3.
Position of the species in the trait space and distinctiveness computation. (a): Position of the species on the two first axes of a PCA computed on ForCEEPS traits. Species are labelled. Their distinctiveness is coded by a gradient of colour, from blue (functionally ordinary species) to red (functionally distinct species). The 30% most distinct species are evidenced by three grey circles, and the name of strategies describing their trait combinations is given. (b): Sensitivity of distinctiveness ranking to the traits used. Traits were bootstrapped 10 000 times, and for each bootstrap, the new distinctiveness ranking was correlated with the one computed on all the traits, using Spearman's rank correlation coefficient. The distribution of rho is given (mean = 0.739, median = 0.747, s.d. = 0.096). Parameters are, in alphabetic order: Amax: maximum age (years); A1max and A2: crown size allometry parameters; Brown: Browsing susceptibility of seedlings (from 1, least susceptible, to 5, most susceptible); DDMin: minimal required annual degree-days sum (°C); DrTol: drought tolerance index (unitless, continuous from 0, sensitive, to 1, tolerant); G: optimal growth (unitless); HMax: maximum height (m); La: shade tolerance of adults (from 0, tolerant, to 1, sensitive); Ly: shade tolerance of seedlings (from 0, tolerant, to 1, sensitive); NTol: soil nitrogen requirements (from 1, weak requirements, to 5, strong requirements); S: allometry between diameter and height (unitless); WiTN: monthly minimum winter temperature tolerated for regeneration (°C); WiTX: monthly maximum winter temperature tolerated for regeneration (°C). (Online version in colour.)
Figure 4.
Figure 4.
Changes in productivity of the simulated forests caused by species loss in different environmental conditions. (a) The 11 sites are numbered and located by dots in a temperature/precipitation graph, and classified into four categories. (b) The consequences on ecosystem productivity of the loss of functionally distinct species (red continuous line), ordinary species (blue dashed line), or of random species losses (grey surface), are shown for each site, and the correspondence with site number in (a) is given. (Online version in colour.)
Figure 5.
Figure 5.
Relative AUC of each scenario of species loss (distinct species lost first (a), or ordinary species lost first (b); cf. figure 2). For each site, in each of the two scenarios, relative AUC corresponds to the sum of the productivity of all the 30 simulations, divided by the productivity of the site when all the 30 species were present in the regional pool, to allow intersite comparison. Sites are numbered from 1 to 11 and classified into four categories, following figure 4.

References

    1. Hooper DU, et al. 2005. Effects of biodiversity on ecosystem functioning: a consensus of current knowledge. Ecol. Monogr. 75, 3-35. (10.1890/04-0922) - DOI
    1. Loreau M. 2010. Linking biodiversity and ecosystems: towards a unifying ecological theory. Phil. Trans. R. Soc. B 365, 49-60. (10.1098/rstb.2009.0155) - DOI - PMC - PubMed
    1. Mouillot D, Villéger S, Scherer-Lorenzen M, Mason NWH. 2011. Functional structure of biological communities predicts ecosystem multifunctionality. PLoS ONE 6, e17476. (10.1371/journal.pone.0017476) - DOI - PMC - PubMed
    1. Díaz S, Lavorel S, deBello F, Quétier F, Grigulis K, Robson TM. 2007. Incorporating plant functional diversity effects in ecosystem service assessments. Proc. Natl Acad Sci. USA 104, 20 684-20 689. (10.1073/pnas.0704716104) - DOI - PMC - PubMed
    1. Garnier E, et al. 2004. Plant functional markers capture ecosystem properties during secondary succession. Ecology 85, 2630-2637. (10.1890/03-0799) - DOI

Publication types

LinkOut - more resources