. 2022 Feb;32(2):337-356.
doi: 10.1101/gr.275387.121. Epub 2022 Jan 18.

The asymmetric distribution of RNA polymerase II and nucleosomes on replicated daughter genomes is caused by differences in replication timing between the lagging and the leading strand

Affiliations

The asymmetric distribution of RNA polymerase II and nucleosomes on replicated daughter genomes is caused by differences in replication timing between the lagging and the leading strand

Rahima Ziane et al. Genome Res. 2022 Feb.

Abstract

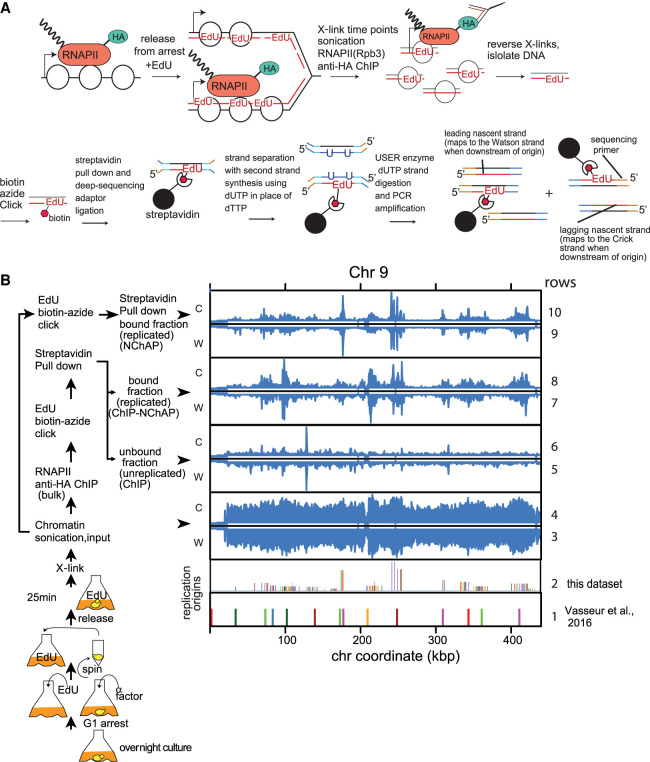
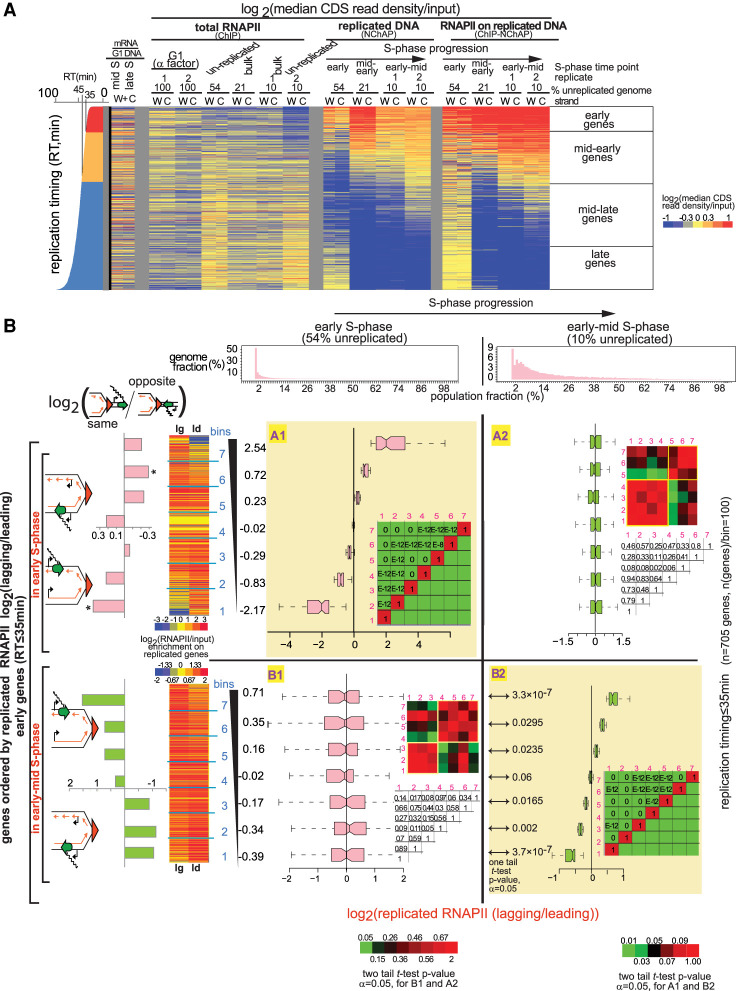
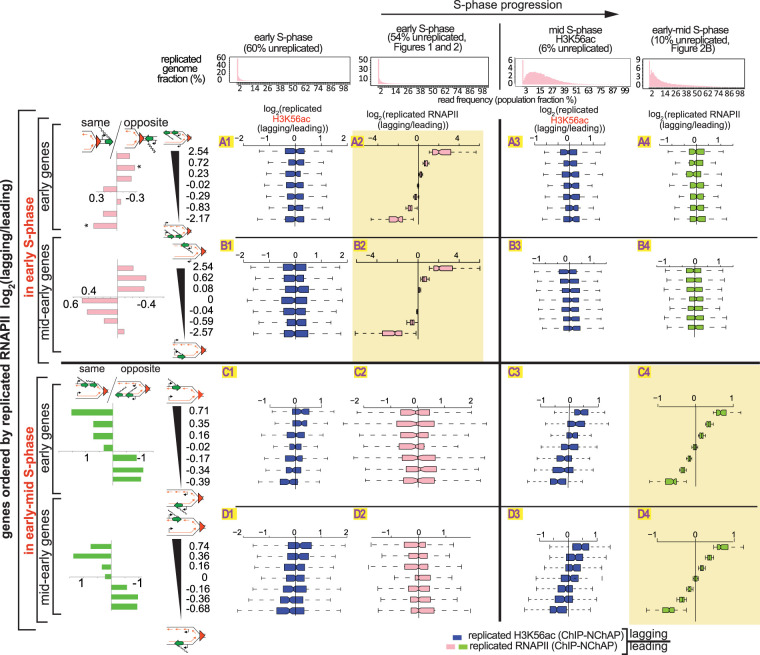
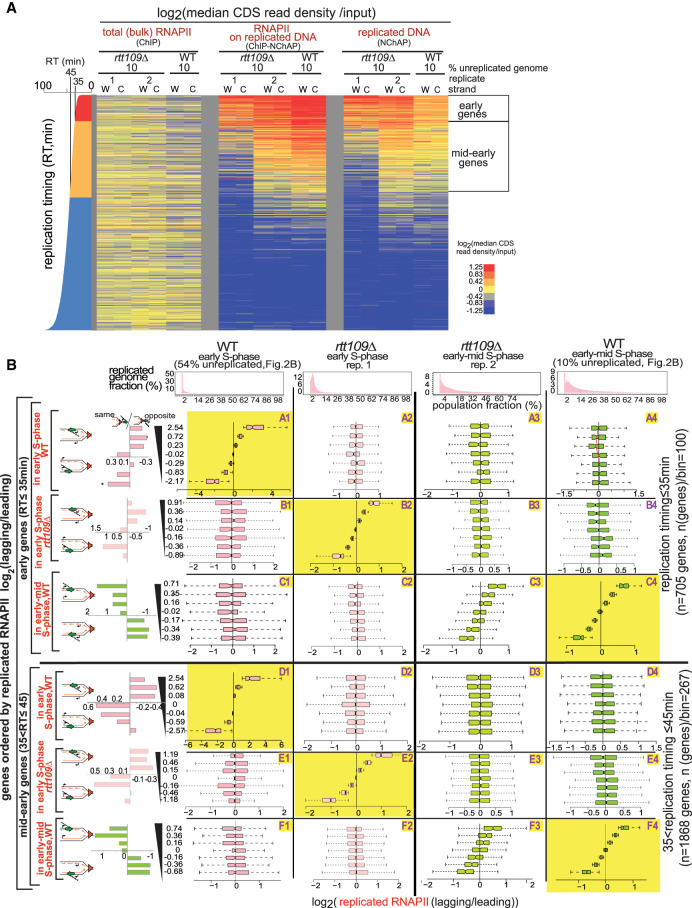
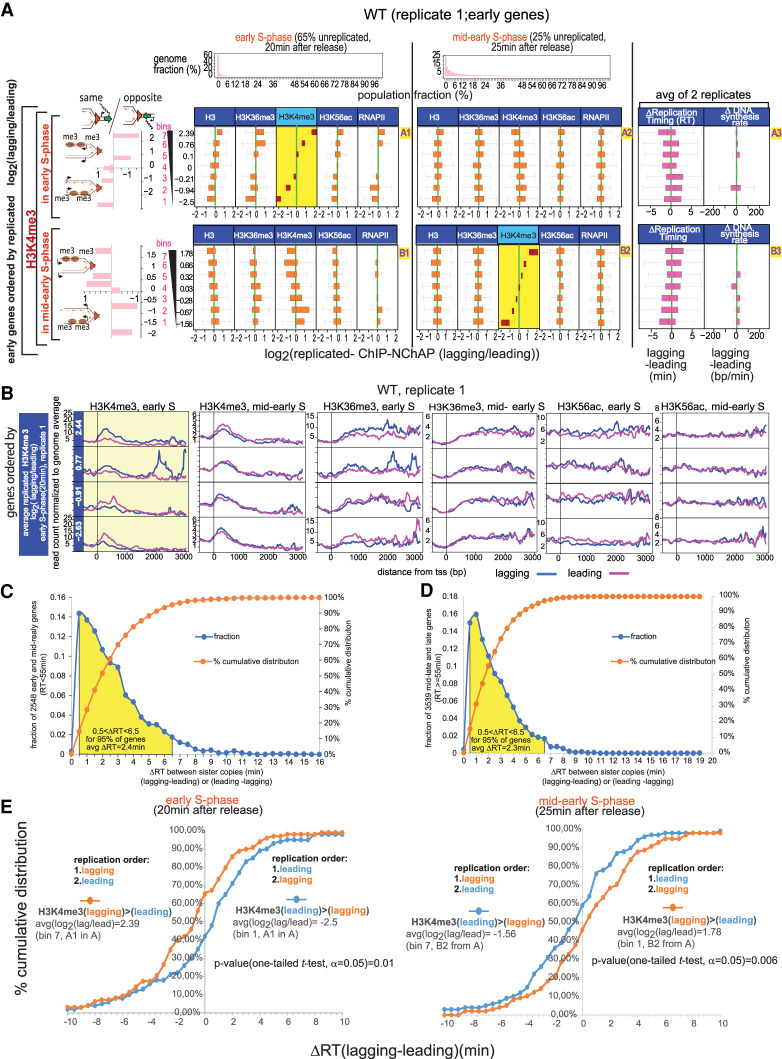
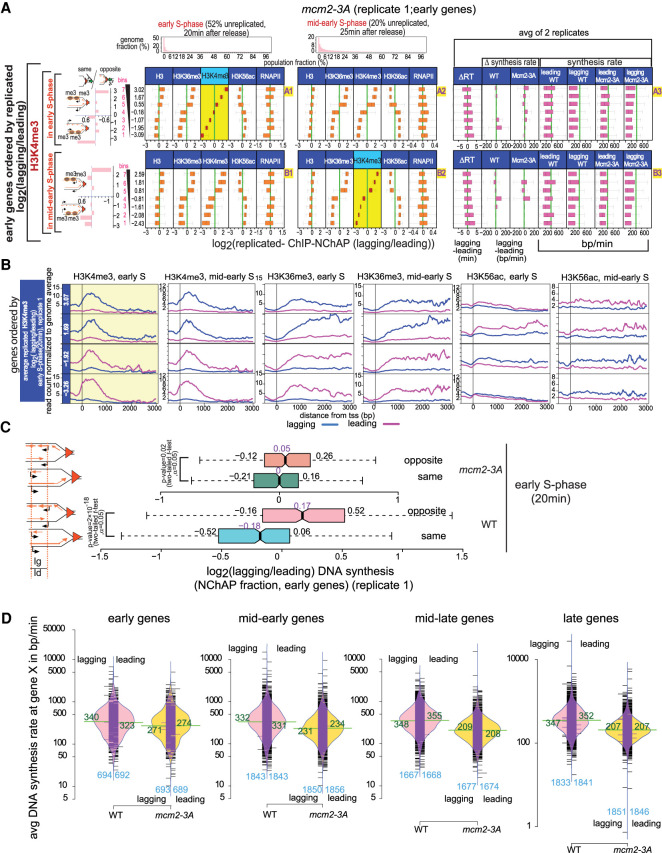
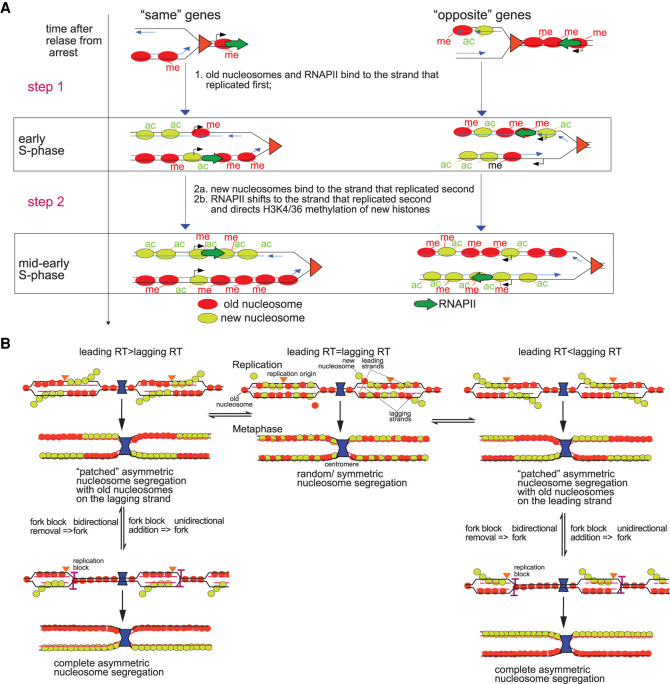
Chromatin features are thought to have a role in the epigenetic transmission of transcription states from one cell generation to the next. It is unclear how chromatin structure survives disruptions caused by genomic replication or whether chromatin features are instructive of the transcription state of the underlying gene. We developed a method to monitor budding yeast replication, transcription, and chromatin maturation dynamics on each daughter genome in parallel, with which we identified clusters of secondary origins surrounding known origins. We found a difference in the timing of lagging and leading strand replication on the order of minutes at most yeast genes. We propose a model in which the majority of old histones and RNA polymerase II (RNAPII) bind to the gene copy that replicated first, while newly synthesized nucleosomes are assembled on the copy that replicated second. RNAPII enrichment then shifts to the sister copy that replicated second. The order of replication is largely determined by genic orientation: If transcription and replication are codirectional, the leading strand replicates first; if they are counterdirectional, the lagging strand replicates first. A mutation in the Mcm2 subunit of the replicative helicase Mcm2-7 that impairs Mcm2 interactions with histone H3 slows down replication forks but does not qualitatively change the asymmetry in nucleosome distribution observed in the WT. We propose that active transcription states are inherited simultaneously and independently of their underlying chromatin states through the recycling of the transcription machinery and old histones, respectively. Transcription thus actively contributes to the reestablishment of the active chromatin state.


Figures

Figure 1.
Figure 1.
RNAPII ChIP-NChAP in early S phase. (A) Diagram of the RNAPII ChIP-NChAP experiment. (B) RNAPII distribution on Chromosome 9 from chromatin fractions diagrammed on the left, in early S phase 25 min after release from G1 arrest. The positions of replication origins are shown in rows 1 and 2—(1) identified in Vasseur et al. (2016); and (2) from this data set. Read counts from all fractions were grouped in 50-bp bins and first normalized to the genome average read count and then to the highest peak value in each chromosome. W and C are reads from Watson and Crick strands, respectively.
Figure 2.
Figure 2.
RNAPII is distributed asymmetrically on replicated gene copies. (A) Heat map of median RNAPII occupancies in coding regions (CDS) of all yeast genes that are not cell cycle-regulated. Reads from promoter regions have been excluded from median read density calculations. Each line is an individual gene and columns represent occupancy values for (W)atson and (C)rick gene copies for different G1- and S-phase time points. S-phase time points are defined by the fraction of the genome that has not yet been replicated: (Early S phase) 54% of the genome is unreplicated over the whole cell population; (mid-early S phase) 21% unreplicated; (early-mid S phase; replicates 1 and 2) 10% unreplicated. The represented fractions are bulk RNAPII (ChIP), replicated DNA (NChAP), and RNAPII on replicated DNA (ChIP-NChAP). The first two columns on the left represent mRNA enrichment over G1 genomic DNA in mid and late S (in the absence of EdU) (Vasseur et al. 2016). Genes are ordered by replication timing of the Watson strand, shown in the bar graph on the left (RT) (Vasseur et al. 2016). (B) Box plot distributions of lagging/leading RNAPII ratios. The figure is organized into a grid. Rows A and B represent the data sets whose lagging/leading ratios were used to sort early genes: (row A) early genes in early S phase; (row B) early genes in early-mid S phase. Columns 1 and 2 represent S-phase time points: (1) early; (2) early-mid S phase. The header row shows the distribution of replicated genome fractions as described in the “Data Analysis” section of Supplemental Material. The 54% unreplicated and the 10% unreplicated (replicate 1) RNAPII ChIP-NChAP from A are, respectively, used as reference points for early and early-mid S phase throughout the article. Early replicating genes in fields A1 and B2 have been sorted by decreasing lagging/leading RNAPII occupancy in early S phase and early-mid S phase, respectively, and divided into seven bins (y-axis) (yellow background), and box plot distribution of RNAPII lagging/leading ratios (x-axis) have been determined for each bin in each time point. The average lagging/leading ratios for each gene bin are indicated in the y-axis on the left. For example, the bottom group of genes (bin 1) in A1 has, on average, 5.6 times more RNAPII on the leading copy than on the lagging in early S phase. The heat maps on the left show RNAPII enrichment on replicated DNA (ChIP-NChAP fractions) for the lagging (lg) and leading (ld) copies of the genes in the seven bins. The bar graphs on the left show the enrichment of “same” genes for each bin indicated in the y-axis calculated as the ratio of “same” orientation genes versus “opposite” genes for each bin normalized to the same/opposite ratio of all 705 early genes (rows A and B; [*] P-value of hypergeometric test < 0.05). The heat map insets in each field show the P-values of the pairwise two tailed t-test for two independent samples (α = 0.05) for each bin pair. The color bars on the bottom left or bottom right correspond to heat maps for fields B1 and A2 or A1 and B2, respectively. The corresponding P-values are also shown in the tables on the right of the box plot graphs within each field (E–12 = 10−12 and E–8 = 10−8). The P-values of the pairwise one-tailed t-test for two independent samples (α = 0.05) between early and early-mid S phase for each bin in row B are shown in B2 on the left of the box plots.
Figure 3.
Figure 3.
The asymmetric distribution of RNAPII on daughter chromatids is independent of the asymmetric distribution of new histones. Box plot distributions of lagging/leading ratios for replicated H3K56ac (dark blue) and replicated RNAPII (pink and green for early and early-mid S phase, respectively) in early (columns 1 and 2, respectively) and mid and early-mid (columns 3 and 4, respectively) S phase for early (rows A and C) and mid-early genes (rows B and D). (Header) Distribution of genome read densities, columns: (1) early S phase (MNase-NChAP, 60% unreplicated); (2) early S phase from Figure 2 (54% unreplicated); (3) bulk H3K56ac ChIP, mid S phase (6% unreplicated); (4) early-mid S phase (NChAP) from Figure 2B (10% unreplicated). (Rows A and B) Early and mid-early genes have been sorted by increasing lagging/leading RNAPII ratios from early S phase (Fig. 2B), respectively, and then divided into seven bins as in Figure 2B (y-axis), and box plot distributions of H3K56ac lagging/leading ratios (x-axis) from early (left) and mid (right) S phase have been determined (dark blue boxes) and compared with RNAPII lagging/leading ratios from early and early-mid S phase (pink and green boxes, respectively). The bar graphs on the left show the “same” gene enrichment calculated as in Figure 2B for gene bins indicated in the y-axis of each row on the right. (Rows C and D) As rows A and B but sorted by increasing lagging/leading RNAPII occupancy from early-mid S phase (Fig. 2B).
Figure 4.
Figure 4.
RNAPII is distributed asymmetrically in the absence of H3K56ac in rtt109Δ cells. (A) Heat map of median RNAPII occupancies in coding regions of yeast genes not regulated by the cell cycle, as in Figure 2A. (Columns, from left) Early-mid S phase after release from G1 arrest in rtt109Δ (early S phase [rep.1] and early-mid S phase [rep. 2]) and WT (10% unreplicated, from Fig. 2B), from total RNAPII (ChIP), replicated RNAPII (ChIP-NChAP), and replicated DNA (NChAP) fractions. Even though both rtt109Δ time points have 10% of their genome still unreplicated, replicate1 is at an earlier stage of genome replication than replicate 2 because a greater number of genes have been replicated in more cells in replicate 2 than in replicate 1 (mid-early genes are more “red” and “yellow” in the NChAP fraction of replicate 2 compared with replicate 1; also compare the distributions of percentage replicated genome fractions between replicate 1 and 2 in B). (B) Box plot distributions of replicated RNAPII lagging/leading ratios from early S phase (WT) to early-mid S phase (WT and rtt109Δ, columns 1–4) for early (rows A–C) and mid-early genes (rows D–F). (Header) Distribution of genome read densities as in Figure 2B. (Rows A and D) Genes have been sorted by increasing lagging/leading RNAPII occupancy in early S phase (WT, Fig. 2B) and divided into seven bins, as in Figure 2B (y-axis), and box plot distributions of replicated RNAPII lagging/leading ratios (x-axis) have been determined for each bin at indicated time points. (Rows B, E and C, F) As rows A and C except that genes have been ordered by increasing lagging/leading RNAPII ratios from rtt109Δ (early S phase, replicate 1) or early-mid S phase (WT) (Fig. 2B), respectively. The bar graphs on the left show “same” gene enrichments calculated as in Figure 2B for gene bins indicated in the y-axis of each row on the right. The RNAPII distribution pattern between leading and lagging strand gene copies in rtt109Δ cells from replicate 2 (fields C3 and F3) correlates with WT (fields C4 and F4), indicating that the asymmetric distribution of RNAPII on replicated DNA is independent of the distribution of H3K56ac.
Figure 5.
Figure 5.
Old nucleosomes are recycled to the daughter chromatid that replicated first. (A) Box plot distributions of lagging/leading ChIP-NChAP ratios for H3, H3K36me3, H3K4me3, H3K56ac, and RNAPII from early (column 1) and mid-early S phase (column 2) for early genes from the same WT culture (biological replicate 1). The histograms in the header show the distribution of genome read densities for each NChAP (replicated DNA) fraction at indicated time points in S phase, as in Figure 2B. (Rows A and B) Genes have been sorted by decreasing lagging/leading ratios of H3K4me3 in early S phase (row A) and mid-early S phase (row B) (yellow background), and divided into seven bins (y-axis on the left), as in Figure 2B. Box plot distributions of lagging/leading ratios (x-axis) for the chromatin features indicated in the headers have been determined for each bin. Average lagging/leading H3K4me3 ratios in early S phase for each bin are shown on the y-axis on the left. The bar graphs on the left show the “same” gene enrichment for gene bins indicated in the y-axis of each row on the right. Column 3 shows box plot distributions for the difference in replication timing (ΔRT) between the lagging and the leading strand for each gene (RT for each gene is the median RT of all 50-bp segments in the CDS of any given gene, averaged from two replicate time courses in Supplemental Fig. S10) (left) and ΔDNA synthesis rate (average difference between lagging and leading DNA synthesis rates for each gene in the bin) (right). Synthesis rates were calculated as in Supplemental Figure S11 using replication timing from Supplemental Figure S10 and ROADs (replication origin-associated domains) determined from NChAP fractions of the 20- and 25-min time points of two biological replicates (replicate 1 from Fig. 5A and replicate 2 from Supplemental Fig. S7A). (B) Average TSS (transcription start site)-centered metagene profiles of ChIP-NChAP fractions indicated in the header, from WT cells (replicate 1) from gene bins from A sorted according to the average log2 (lagging/leading) ratios for H3K4me3 in early S phase. Only the two bottom (bins 1–2) and top (bins 6–7) bins are shown. The value of the average ratio for each bin is indicated in the blue strip on the left. (C) Distribution of the differences in replication timing between sister gene copies (ΔRT, lagging-leading and leading-lagging) in WT cells for all early and mid-early genes. The yellow surface shows 95% of early and mid-early genes whose ΔRT is between 0.5 and 6.5 min. “avgΔRT = 2.4 min” is the average of the 95% of the gene population represented under the yellow surface (n = 0.95 × 2548 = 2421). (D) As in C, for mid-late and late genes with RT ≥ 55 min. (E) Cumulative distribution of differences in replication timing between the lagging and the leading sister gene copy (ΔRT) for the top bin 7 (orange) and bottom bin 1 (blue) from field A3 (ordered by H3K4me3 log2[lagging/leading] in early S phase, left panel) and field B3 (ordered by H3K4me3 log2[lagging/leading] in mid-early S phase, right panel).
Figure 6.
Figure 6.
Chromatin maturation in mcm2-3A cells. (A) Box plot distributions of lagging/leading ChIP-NChAP ratios for H3, H3K36me3, H3K4me3, H3K56ac, and RNAPII from early (column 1) and mid-early S phase (column 2) for early genes measured in the same culture of mcm2-3A mutant cells (biological replicate 1). The histograms on top show the distribution of genome read densities for each NChAP (replicated DNA) fraction at indicated time points in S phase. (Rows A and B) Genes have been sorted by decreasing lagging/leading occupancy of H3K4me3 in early S phase (row A) and mid-early S phase (row B), respectively (yellow background), and divided into seven bins (y-axis on the left). Box plot distribution of lagging/leading ratios (x-axis) for the chromatin features indicated in the header have been determined for each bin, as in Figure 5A. The bar graphs on the left show the “same” gene enrichment for gene bins indicated in the y-axis of each row on the right. Column 3 shows box plot distributions for, from left to right, the difference in replication timing (ΔRT) between the lagging and the leading strand for each gene in mcm2-3A cells; ΔDNA synthesis rates (lagging-leading) in WT and mcm2-3A cells for each gene in the bin; and average leading and lagging DNA synthesis rates in WT and mcm2-3A cells used to obtain the ΔDNA synthesis rates in Figure 5A for WT and in this figure for mutant cells. Synthesis rates for mcm2-3A were calculated as in Supplemental Figure S11 using replication timing from Supplemental Figure S10 and ROADs determined from NChAP fractions of the 20- and 25-min time points of two biological replicates (replicate 1 from Fig. 6A; replicate 2 from Supplemental Fig. S9A). (B) Average TSS-centered metagene profiles of ChIP-NChAP fractions indicated in the header from mcm2-3A cells (replicate 1) from gene bins from A sorted according to the average log2(lagging/leading) ratios for H3K4me3 in early S phase. Only the two bottom (bins 1,2) and top (bins 6,7) bins are shown. The value of the average ratio for each bin is indicated in the blue strip on the left. (C) Box plot distribution of DNA synthesis bias (log2[lagging/leading] of the NChAP fraction) for early replicating “opposite” and “same” genes in early S phase (20 min after release from G1 arrest) for WT replicate 1 (Fig. 5A) and mcm2-3A replicate 1 (Fig. 6A). (D) Bean plot of lagging and leading strand synthesis rate distribution (from Supplemental Figs. S10, S11) at early, mid-early, mid-late, and late genes for WT and mcm2-3A strains. The mean for each distribution is shown in green. The number of genes in each distribution is shown in blue on the bottom of the plot. The black bars represent individual data points. The bulk of synthesis rates in mcm2-3A are lower than in WT. Rates are constant in WT for all genes, but they gradually decrease as a function of replication timing in mcm2-3A mutants.
Figure 7.
Figure 7.
Differences in replication timing between lagging and leading gene copies shape the distribution of old and new nucleosomes along sister chromatids. (A) Model for chromatin assembly on daughter chromatids. Nucleosome deposition follows a two-step process. (Step 1) “Old” nucleosomes (red) and RNAPII (green arrow) bind first to the leading strand behind the fork while the lagging strand is still replicating when transcription and replication travel in the same direction. When transcription and replication travel in opposite directions, old nucleosomes and RNAPII are deposited on the lagging strand that replicated first. New nucleosomes (light green) will be incorporated into the strand that replicated first mostly at promoters and ends of genes through replication independent turnover, although some will outcompete old nucleosomes for binding to other sites in the CDS. (Step 2) When replication of the other strand catches up, it will be mostly populated by new nucleosomes (2a) and RNAPII will then “switch” from the early replicating strand to the late one and direct H3K4 and H3K36 methylation of new histones by Set1p and Set2p, respectively, on the second gene copy (2b). (B) Modulation of the replication timing of replicated gene copies determines the pattern of old and new nucleosome segregation.

References

    1. Alabert C, Groth A. 2012. Chromatin replication and epigenome maintenance. Nat Rev Mol Cell Biol 13: 153–167. 10.1038/nrm3288 - DOI - PubMed
    1. Bae HJ, Dubarry M, Jeon J, Soares LM, Dargemont C, Kim J, Geli V, Buratowski S. 2020. The Set1 N-terminal domain and Swd2 interact with RNA polymerase II CTD to recruit COMPASS. Nat Commun 11: 2181. 10.1038/s41467-020-16082-2 - DOI - PMC - PubMed
    1. Bannister AJ, Kouzarides T. 2011. Regulation of chromatin by histone modifications. Cell Res 21: 381–395. 10.1038/cr.2011.22 - DOI - PMC - PubMed
    1. Blank HM, Papoulas O, Maitra N, Garge R, Kennedy BK, Schilling B, Marcotte EM, Polymenis M. 2020. Abundances of transcripts, proteins, and metabolites in the cell cycle of budding yeast reveal coordinate control of lipid metabolism. Mol Biol Cell 31: 1069–1084. 10.1091/mbc.E19-12-0708 - DOI - PMC - PubMed
    1. Buratowski S, Moazed D. 2005. Gene regulation: expression and silencing coupled. Nature 435: 1174–1175. 10.1038/4351174b - DOI - PubMed

Publication types

MeSH terms