

Anthropometric and adiposity indicators and risk of type 2 diabetes: systematic review and dose-response meta-analysis of cohort studies
- PMID: 35042741
- PMCID: PMC8764578
- DOI: 10.1136/bmj-2021-067516
Anthropometric and adiposity indicators and risk of type 2 diabetes: systematic review and dose-response meta-analysis of cohort studies
Abstract
Objective: To present a comprehensive review of the association between measures of body weight, waist, and fat, and different ratios of these measures, and the risk of type 2 diabetes.
Design: Systematic review and dose-response meta-analysis of cohort studies.
Data sources: PubMed, Scopus, and Web of Science up to 1 May 2021.
Review methods: Cohort studies looking at the association between general or central adiposity and body fat content and the risk of type 2 diabetes in the general adult population were included. Two of the authors extracted the data in duplicate. Random effects dose-response meta-analyses were performed to estimate the degree of the associations. Curvilinear associations were modelled with a one stage weighted mixed effects meta-analysis.
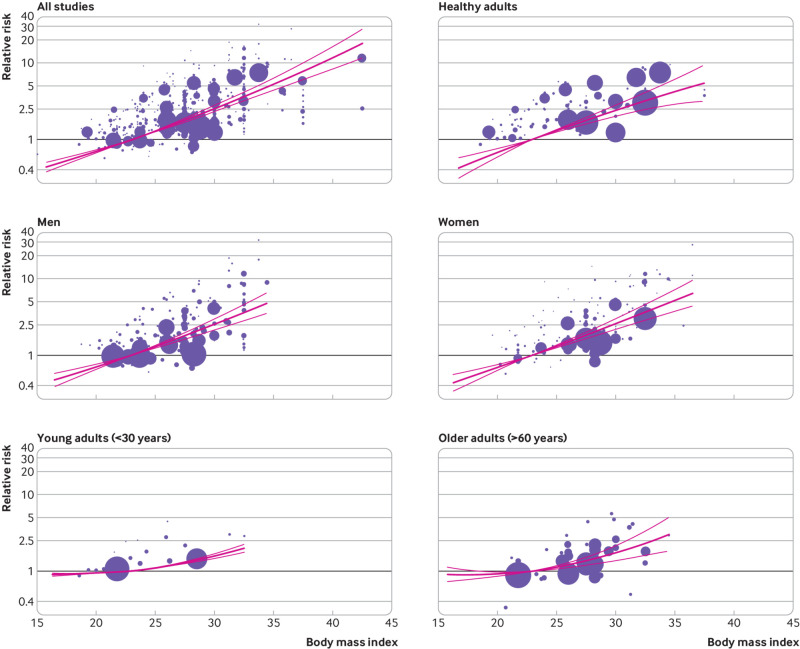
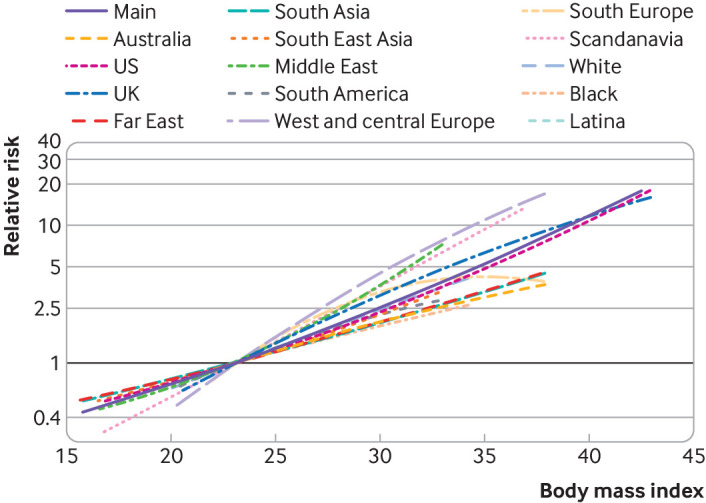
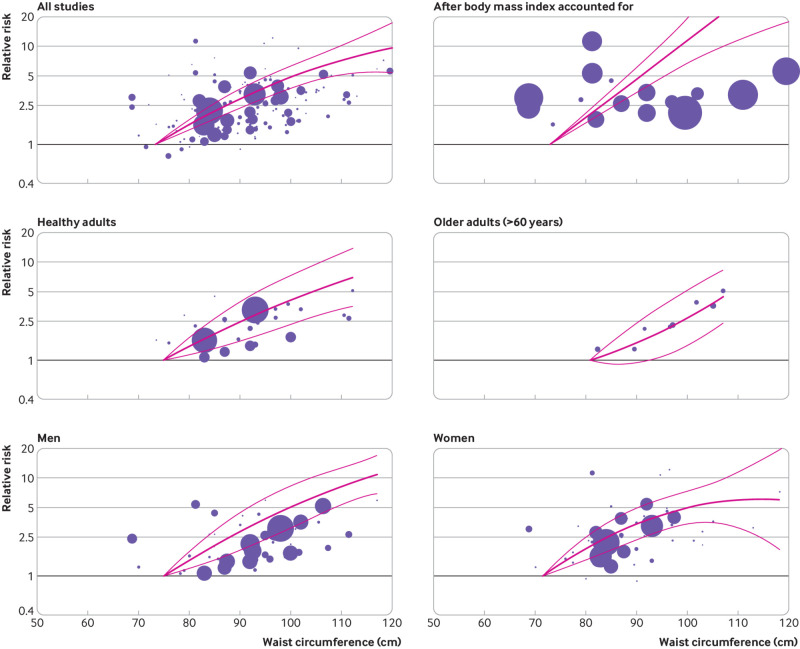
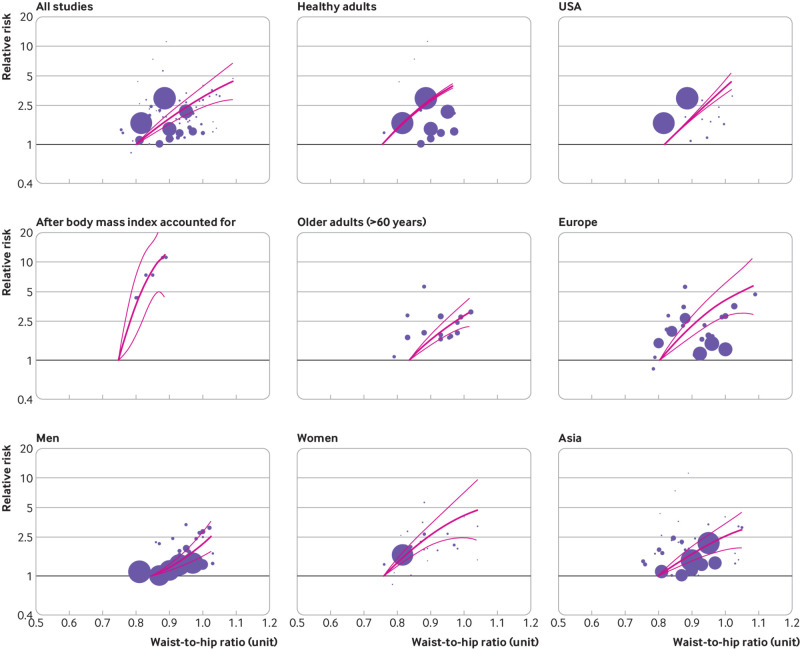
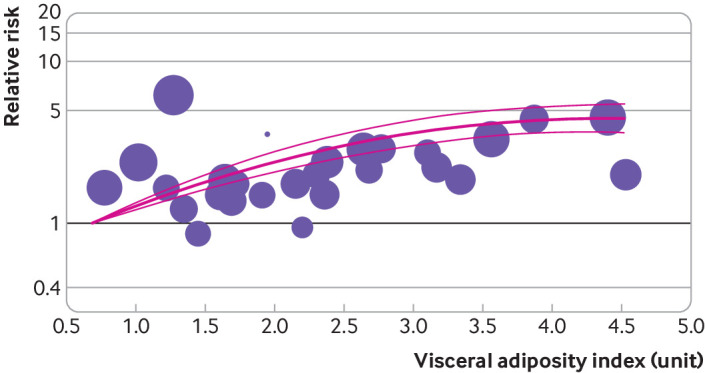
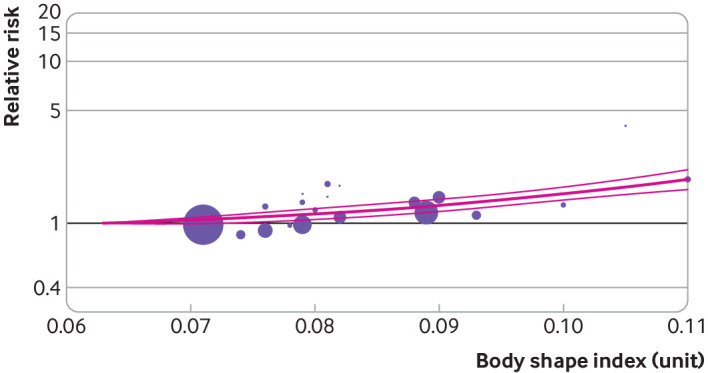
Results: 216 cohort studies with 2.3 million individuals with type 2 diabetes among 26 million participants were identified. Relative risks were 1.72 (95% confidence interval 1.65 to 1.81; n=182 studies) for an increase in body mass index of 5 units, 1.61 (1.52 to 1.70; n=78) for a 10 cm larger waist circumference, 1.63 (1.50 to 1.78; n=34) for an increase in waist-to-hip ratio of 0.1 units, 1.73 (1.51 to 1.98; n=25) for an increase in waist-to-height ratio of 0.1 units, 1.42 (1.27 to 1.58; n=9) for an increase in visceral adiposity index of 1 unit, 2.05 (1.41 to 2.98; n=6) for a 10% higher percentage body fat, 1.09 (1.05 to 1.13, n=5) for an increase in body shape index of 0.005 units, 2.55 (1.59 to 4.10, n=4) for a 10% higher body adiposity index, and 1.11 (0.98 to 1.27; n=14) for a 10 cm larger hip circumference. A strong positive linear association was found between body mass index and the risk of type 2 diabetes. Positive linear or monotonic associations were also found in all regions and ethnicities, without marked deviation from linearity at a specific cut-off value. Indices of central fatness, independent of overall adiposity, also had positive linear or monotonic associations with the risk of type 2 diabetes. Positive linear or monotonic associations were also found for total and visceral fat mass, although the number of studies was small.
Conclusions: A higher body mass index was associated with a greater risk of developing type 2 diabetes. A larger waist circumference, independent of overall adiposity, was strongly and linearly associated with the risk of type 2 diabetes.
Systematic review registration: PROSPERO CRD42021255338.
© Author(s) (or their employer(s)) 2019. Re-use permitted under CC BY-NC. No commercial re-use. See rights and permissions. Published by BMJ.
Conflict of interest statement
Competing interests: All authors have completed the ICMJE uniform disclosure form at www.icmje.org/disclosure-of-interest/ and declare: no support from any organisation for the submitted work; no financial relationships with any organisations that might have an interest in the submitted work in the previous three years; no other relationships or activities that could appear to have influenced the submitted work.
Figures
References
-
- Abarca-Gómez L, Abdeen ZA, Hamid ZA, et al. NCD Risk Factor Collaboration (NCD-RisC) . Worldwide trends in body-mass index, underweight, overweight, and obesity from 1975 to 2016: a pooled analysis of 2416 population-based measurement studies in 128·9 million children, adolescents, and adults. Lancet 2017;390:2627-42. 10.1016/S0140-6736(17)32129-3 - DOI - PMC - PubMed
Publication types
MeSH terms
LinkOut - more resources
Full Text Sources
Medical