. 2022 Feb 23;42(8):1604-1617.
doi: 10.1523/JNEUROSCI.1954-20.2021. Epub 2022 Jan 18.

Impaired Oligodendrocyte Maturation Is an Early Feature in SCA3 Disease Pathogenesis

Affiliations

Impaired Oligodendrocyte Maturation Is an Early Feature in SCA3 Disease Pathogenesis

Kristen H Schuster et al. J Neurosci. .

Abstract

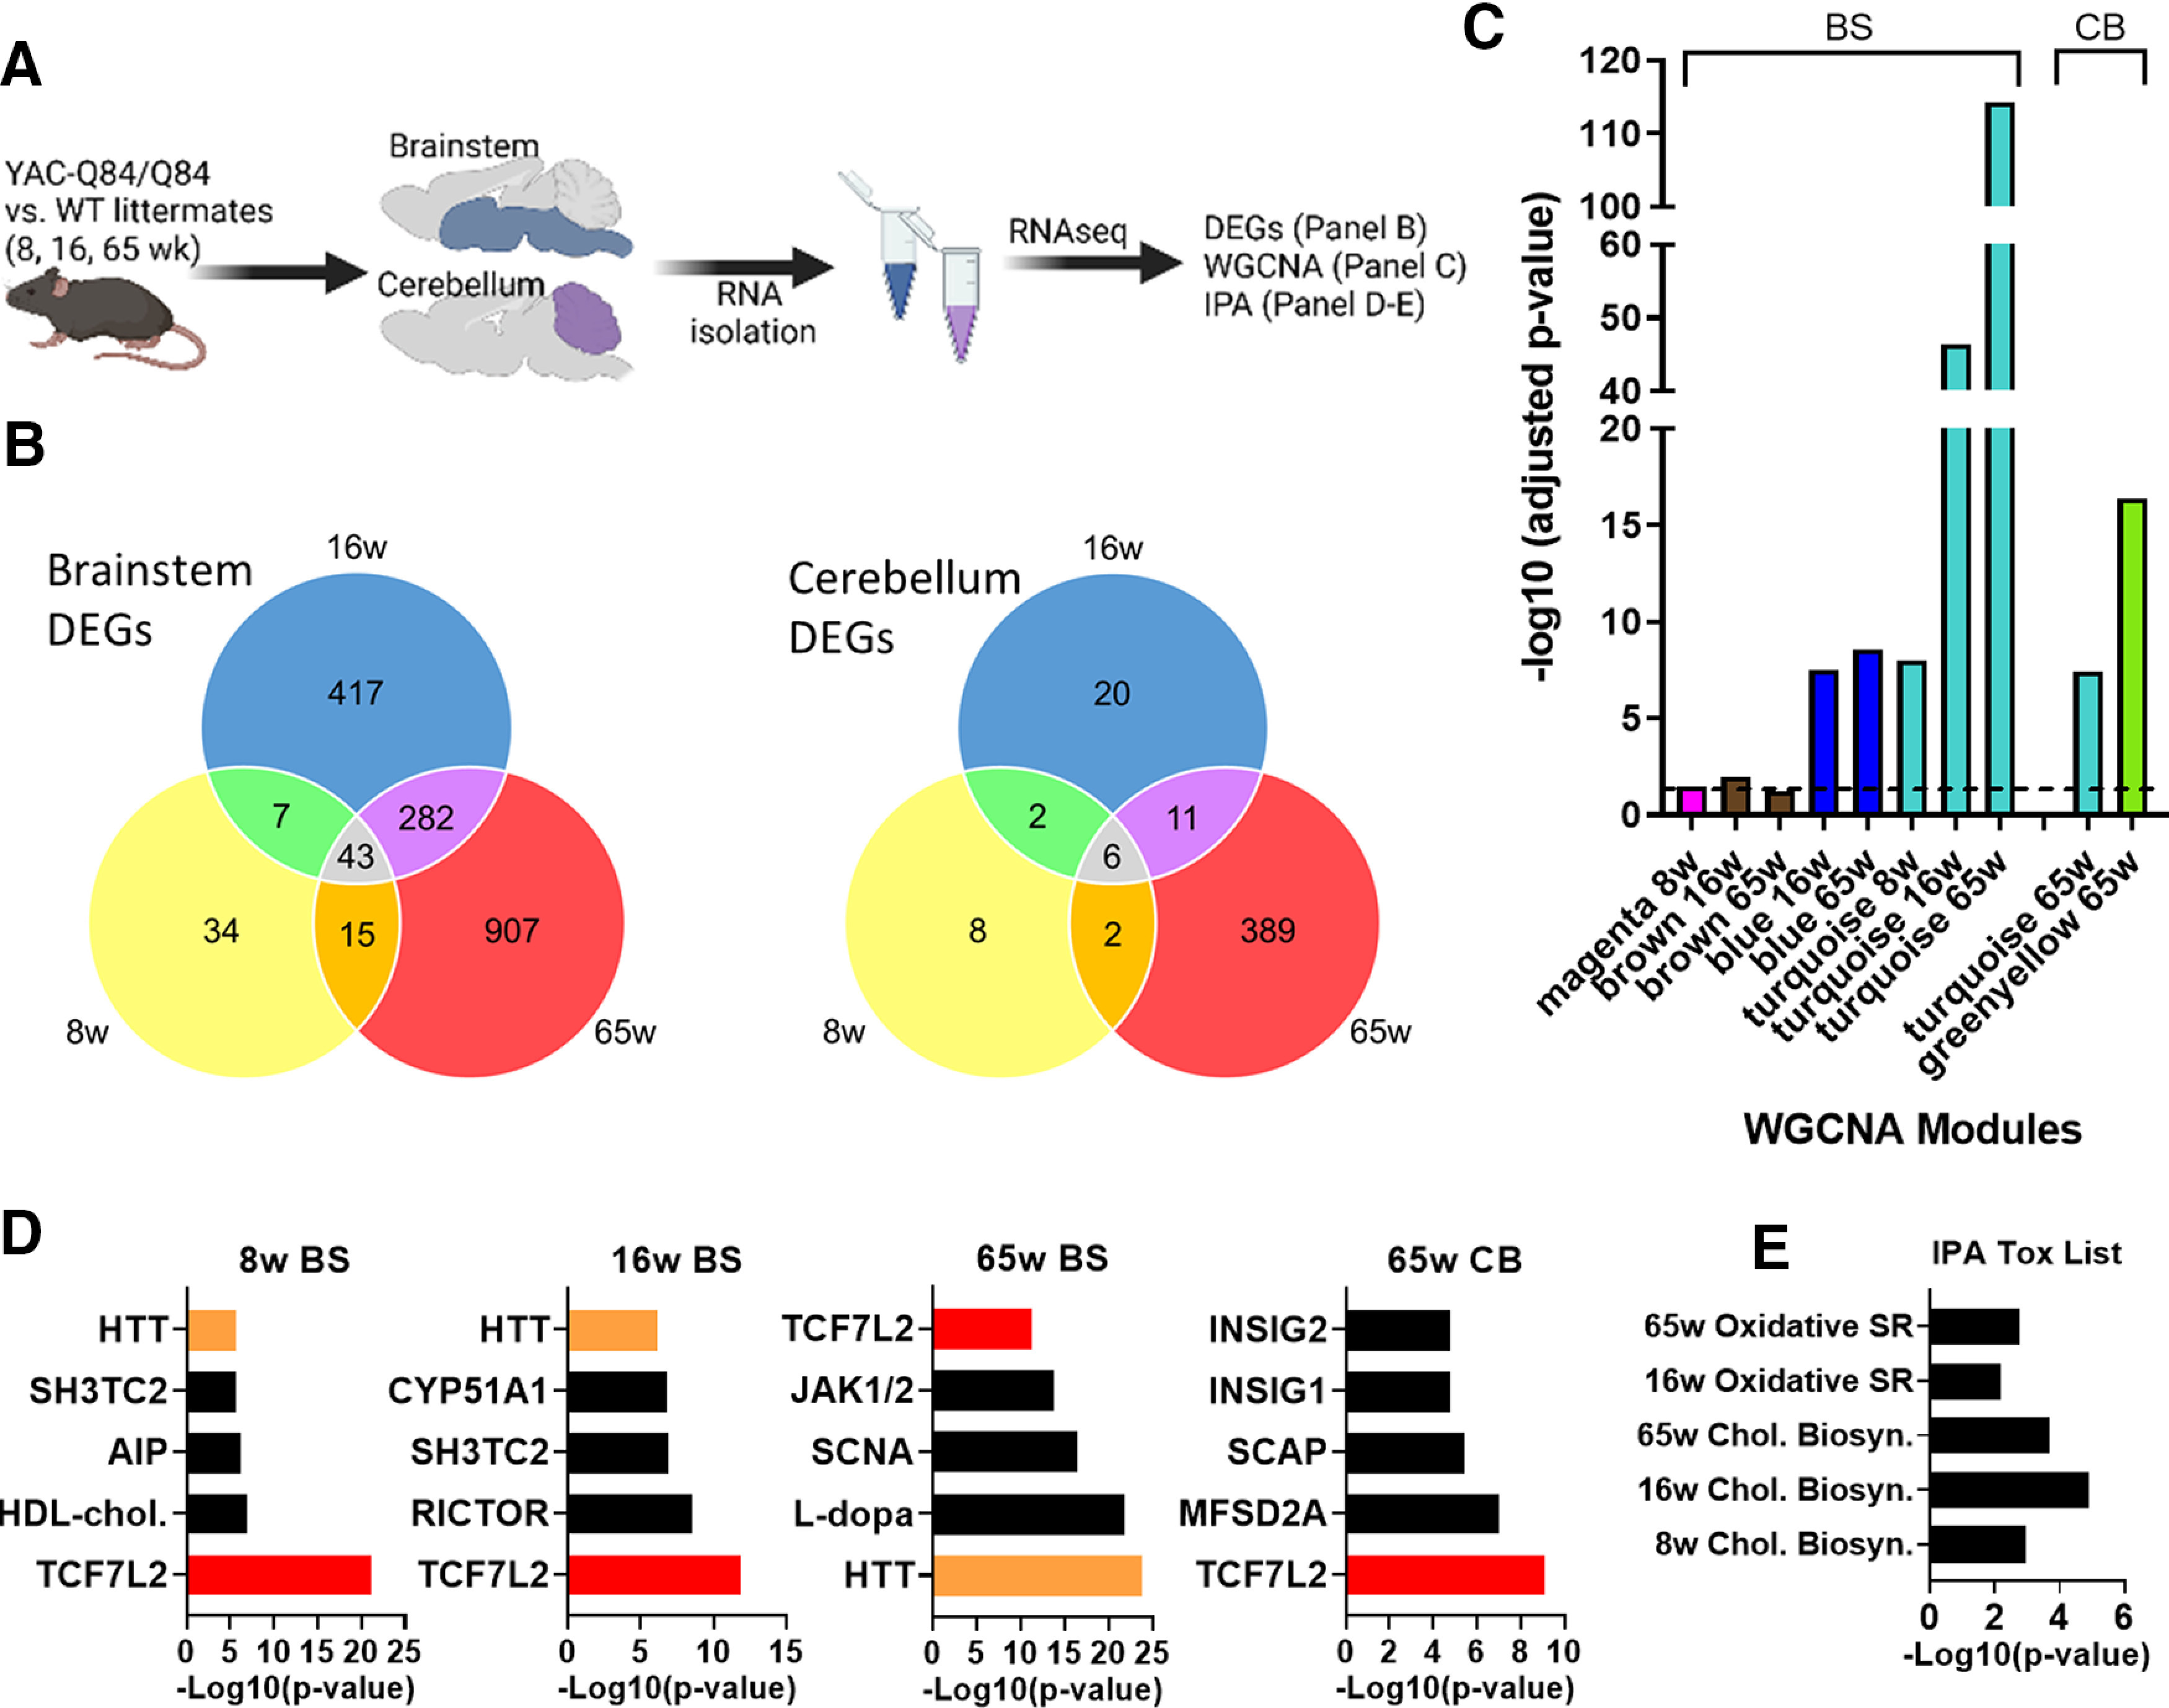
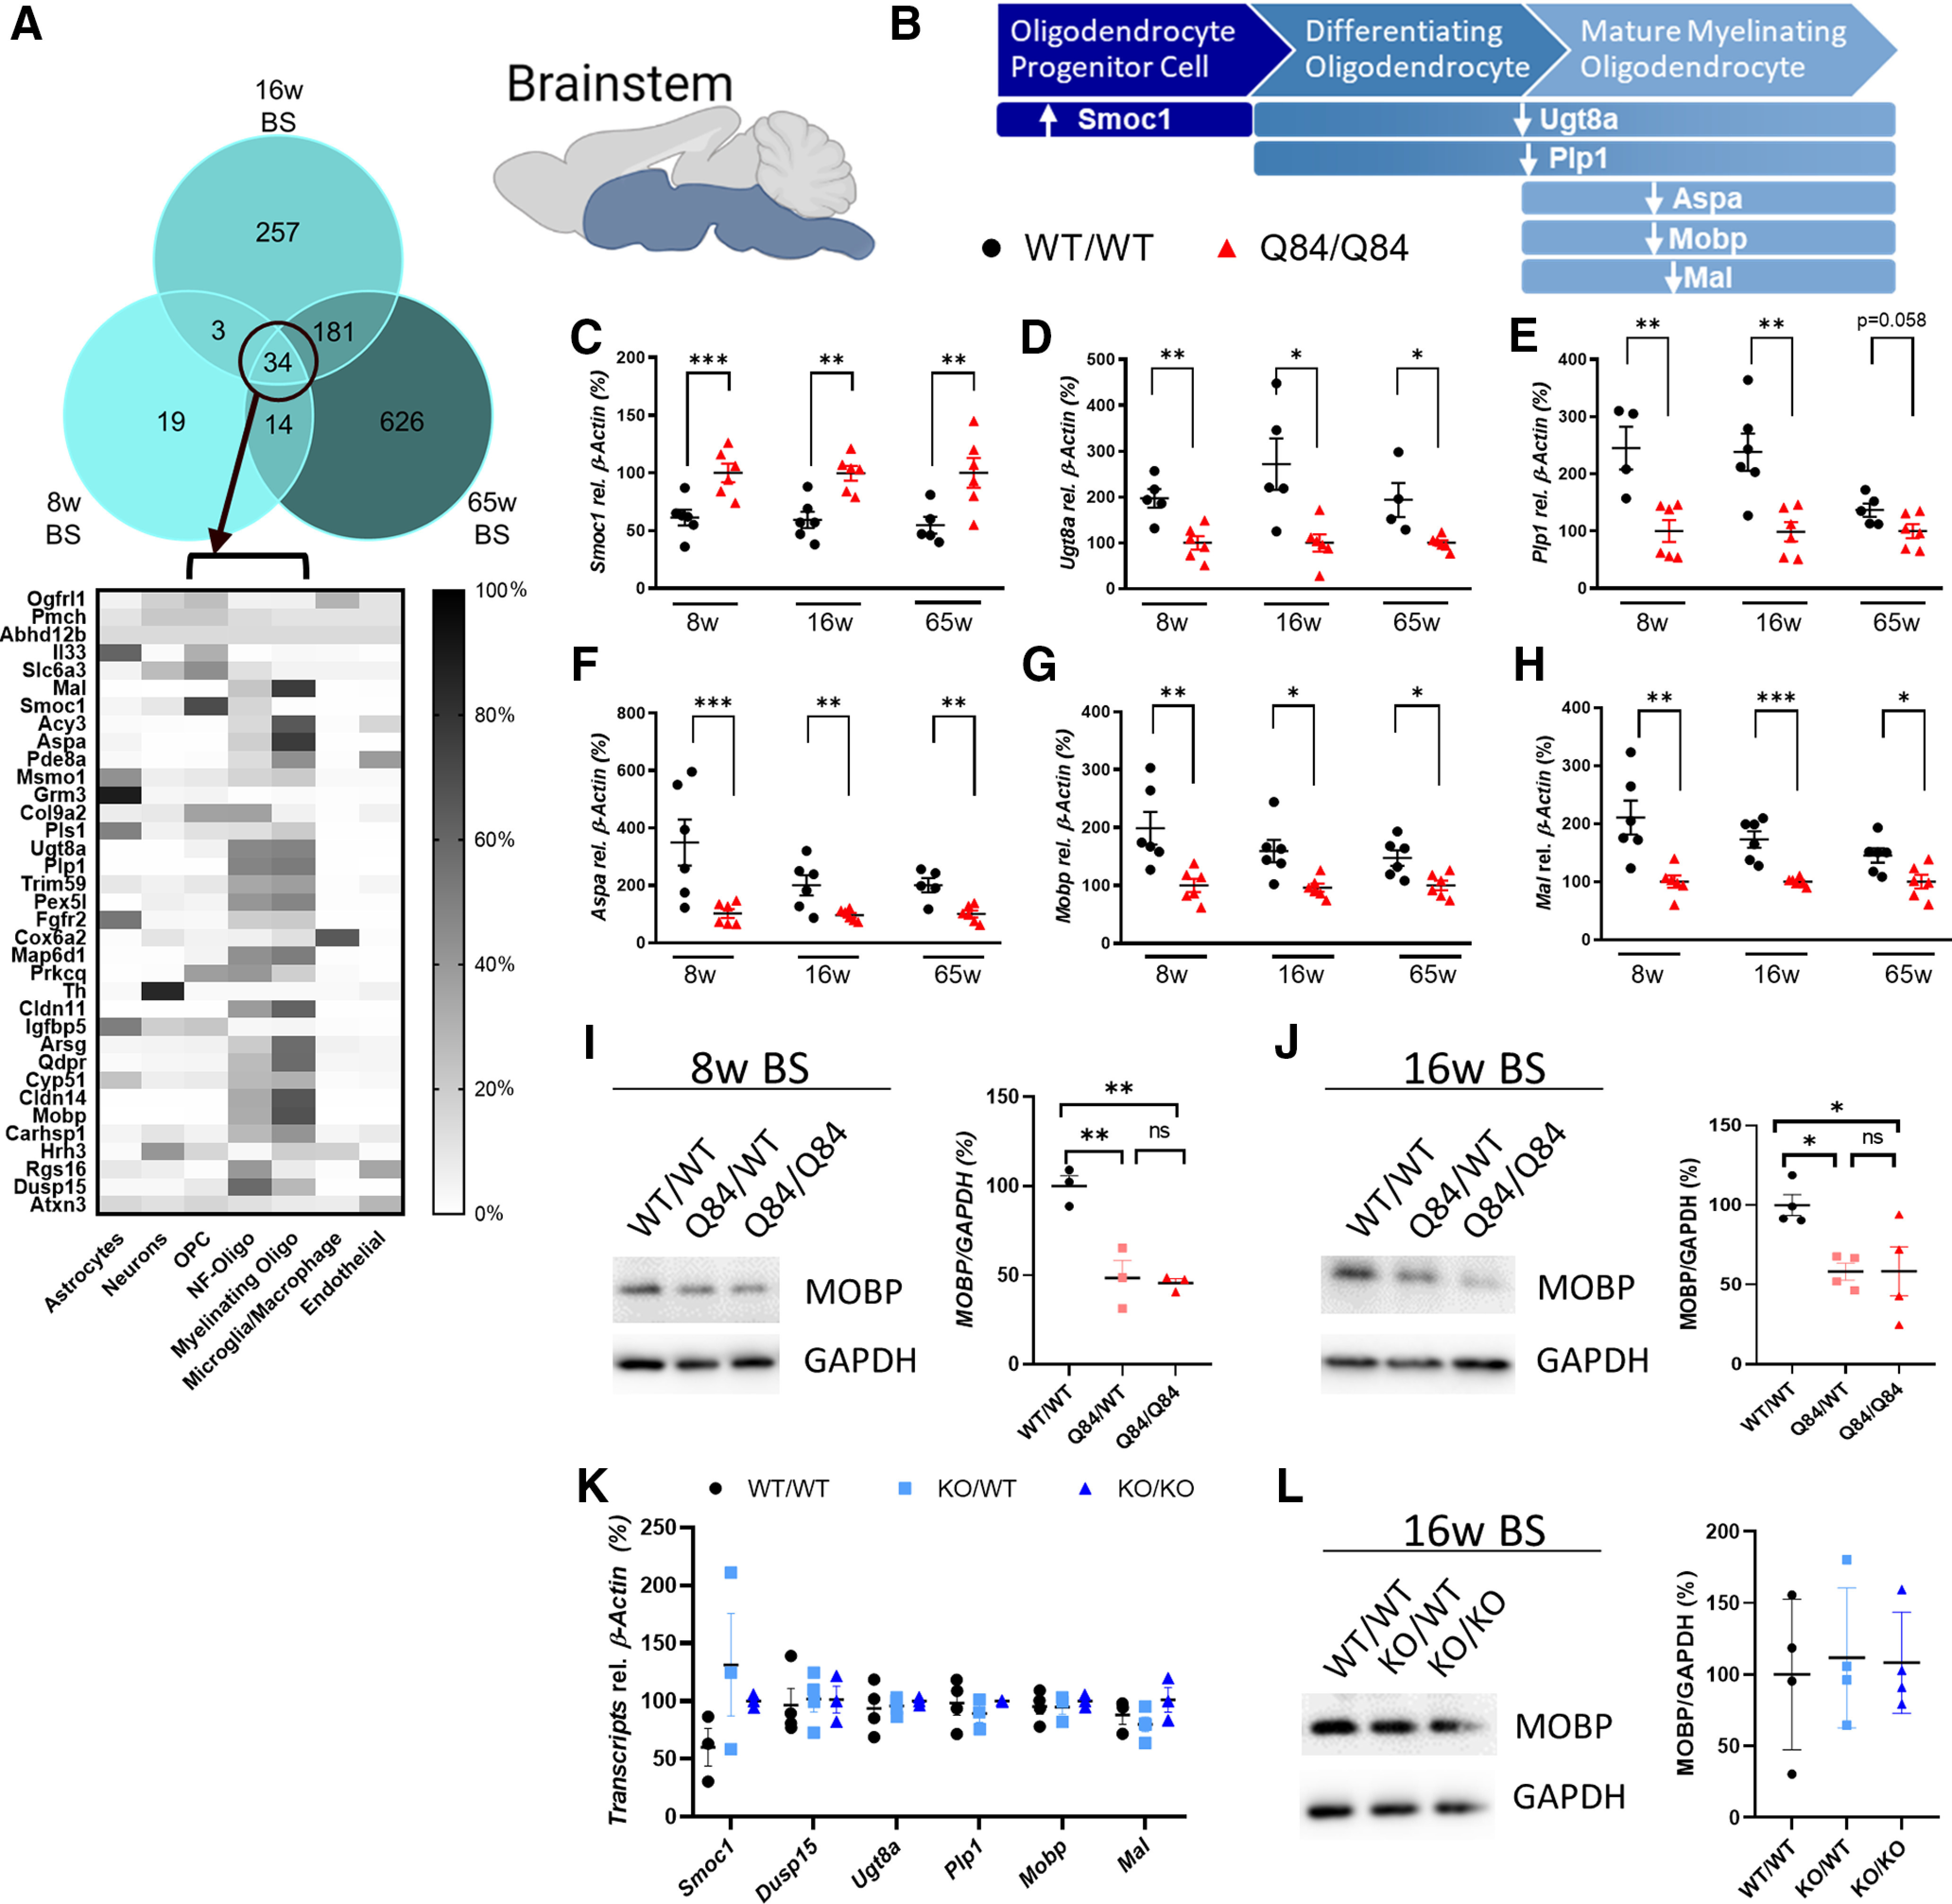
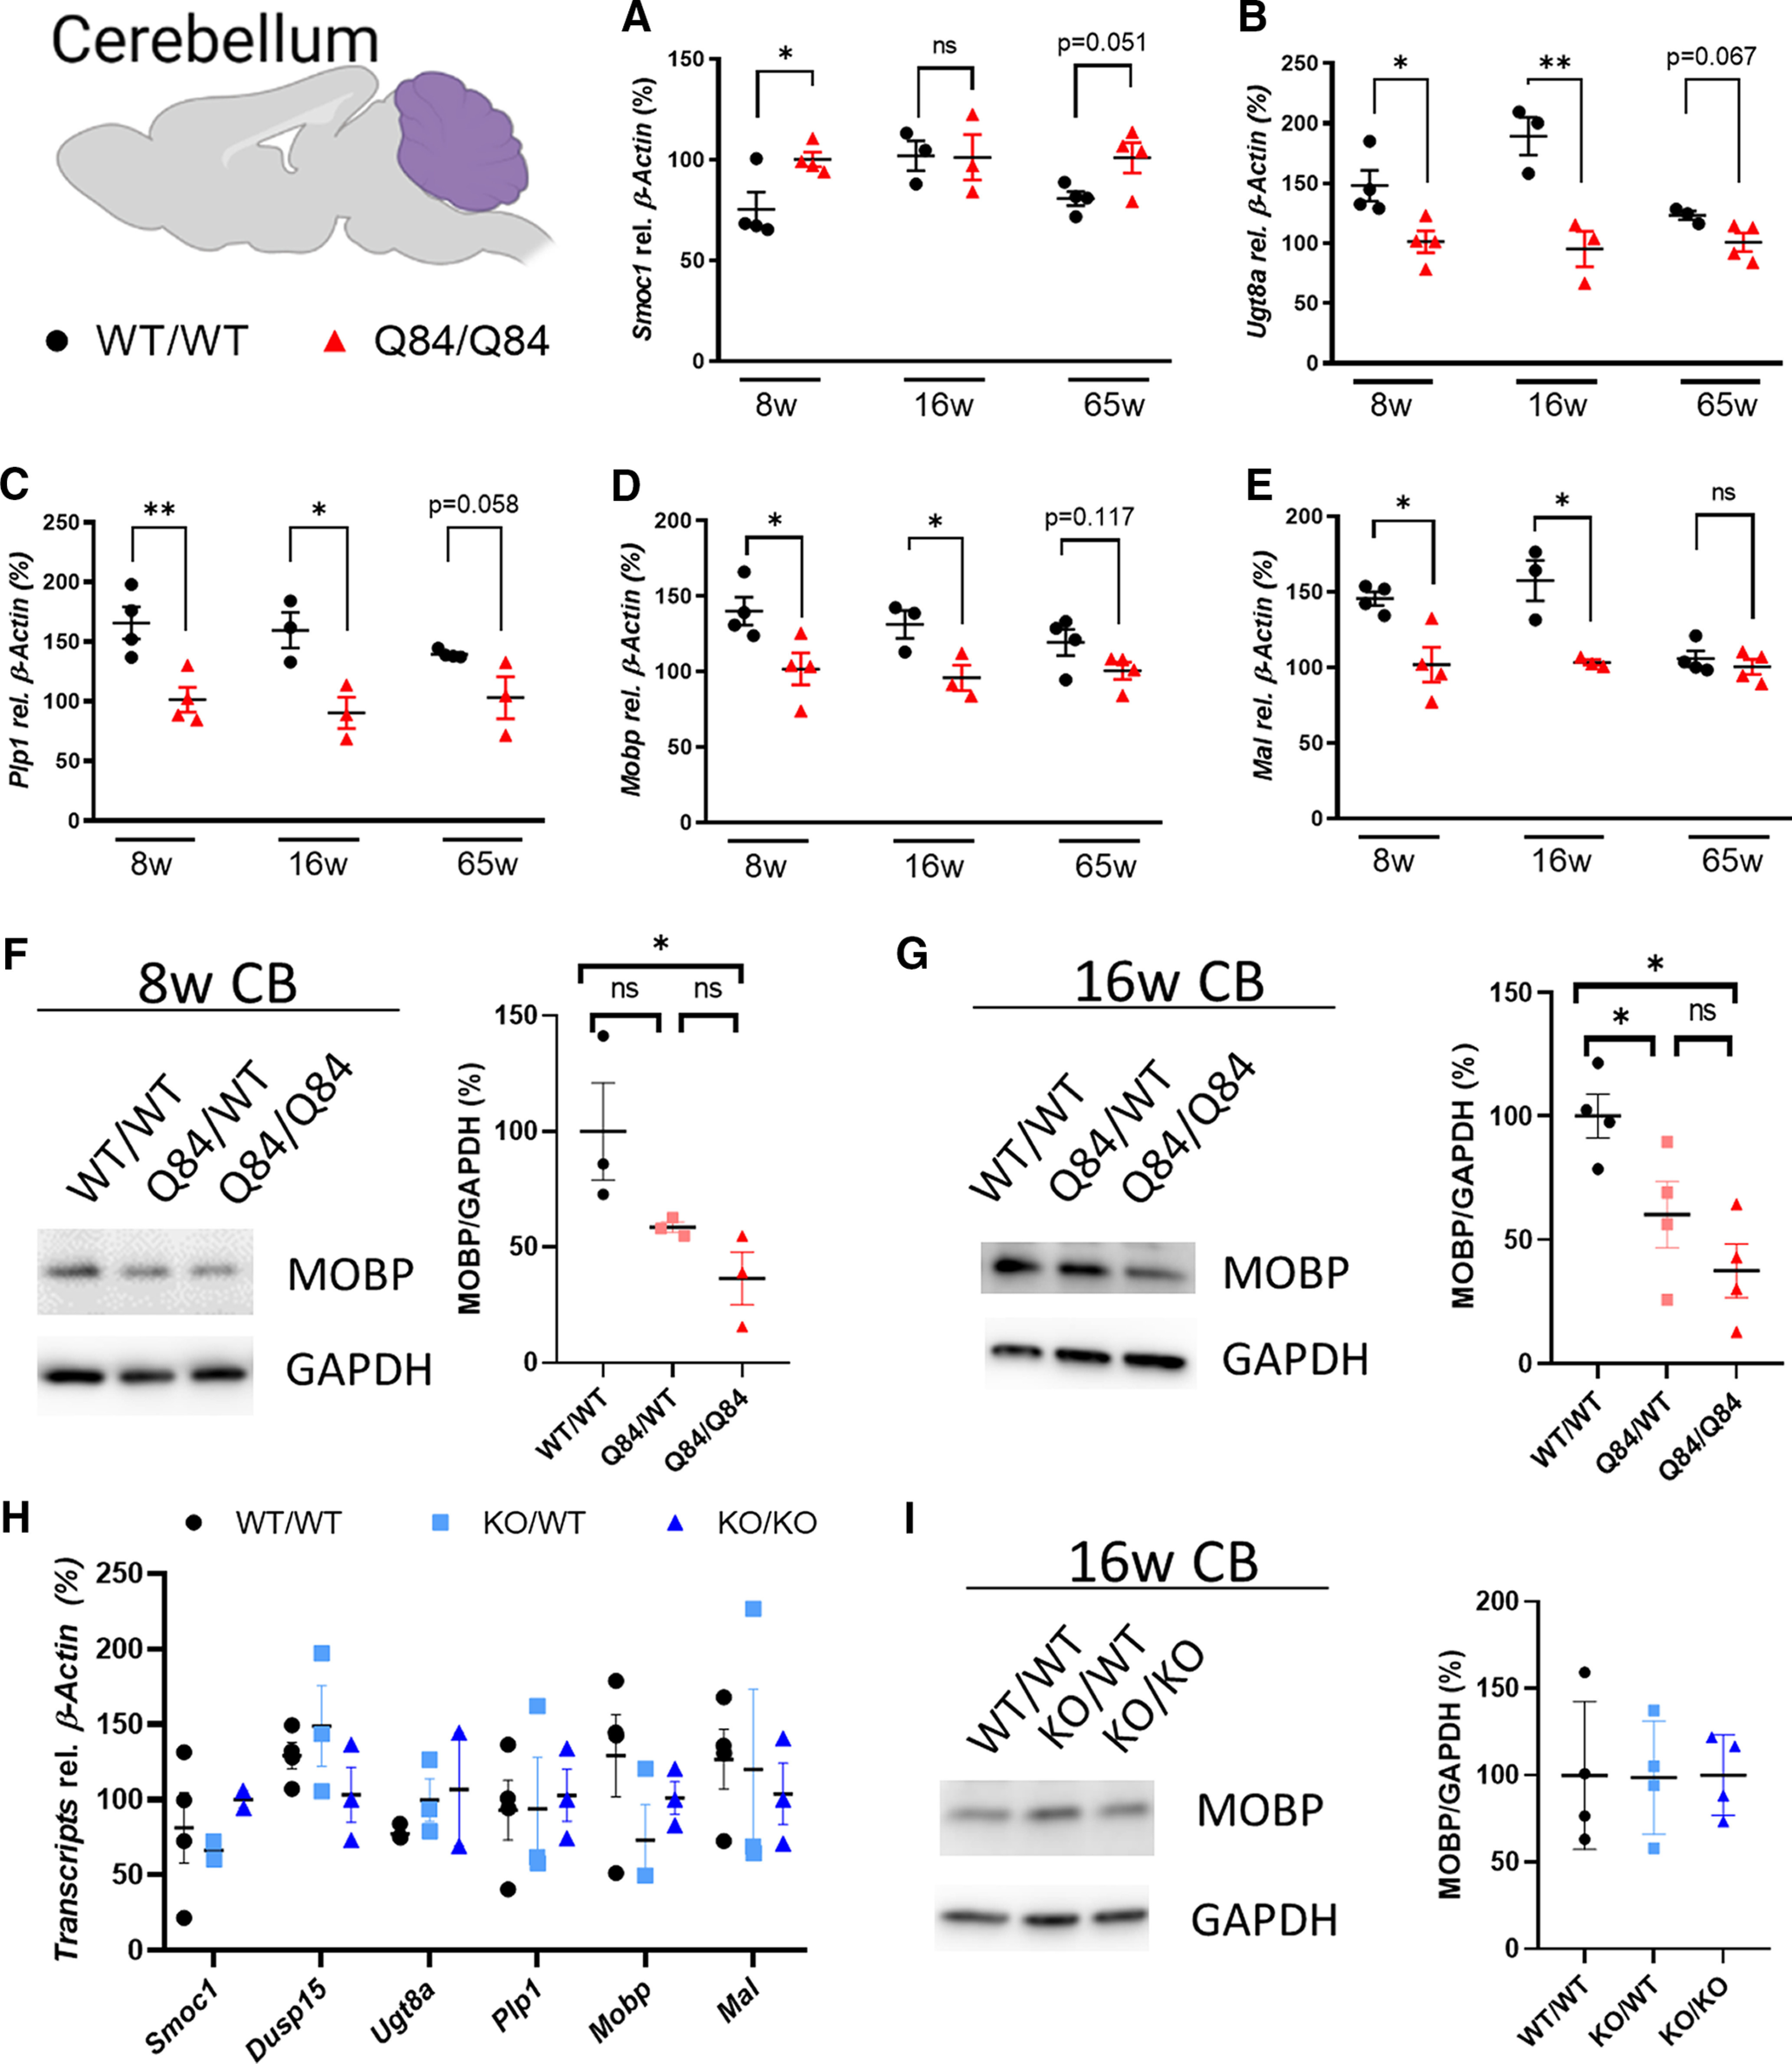
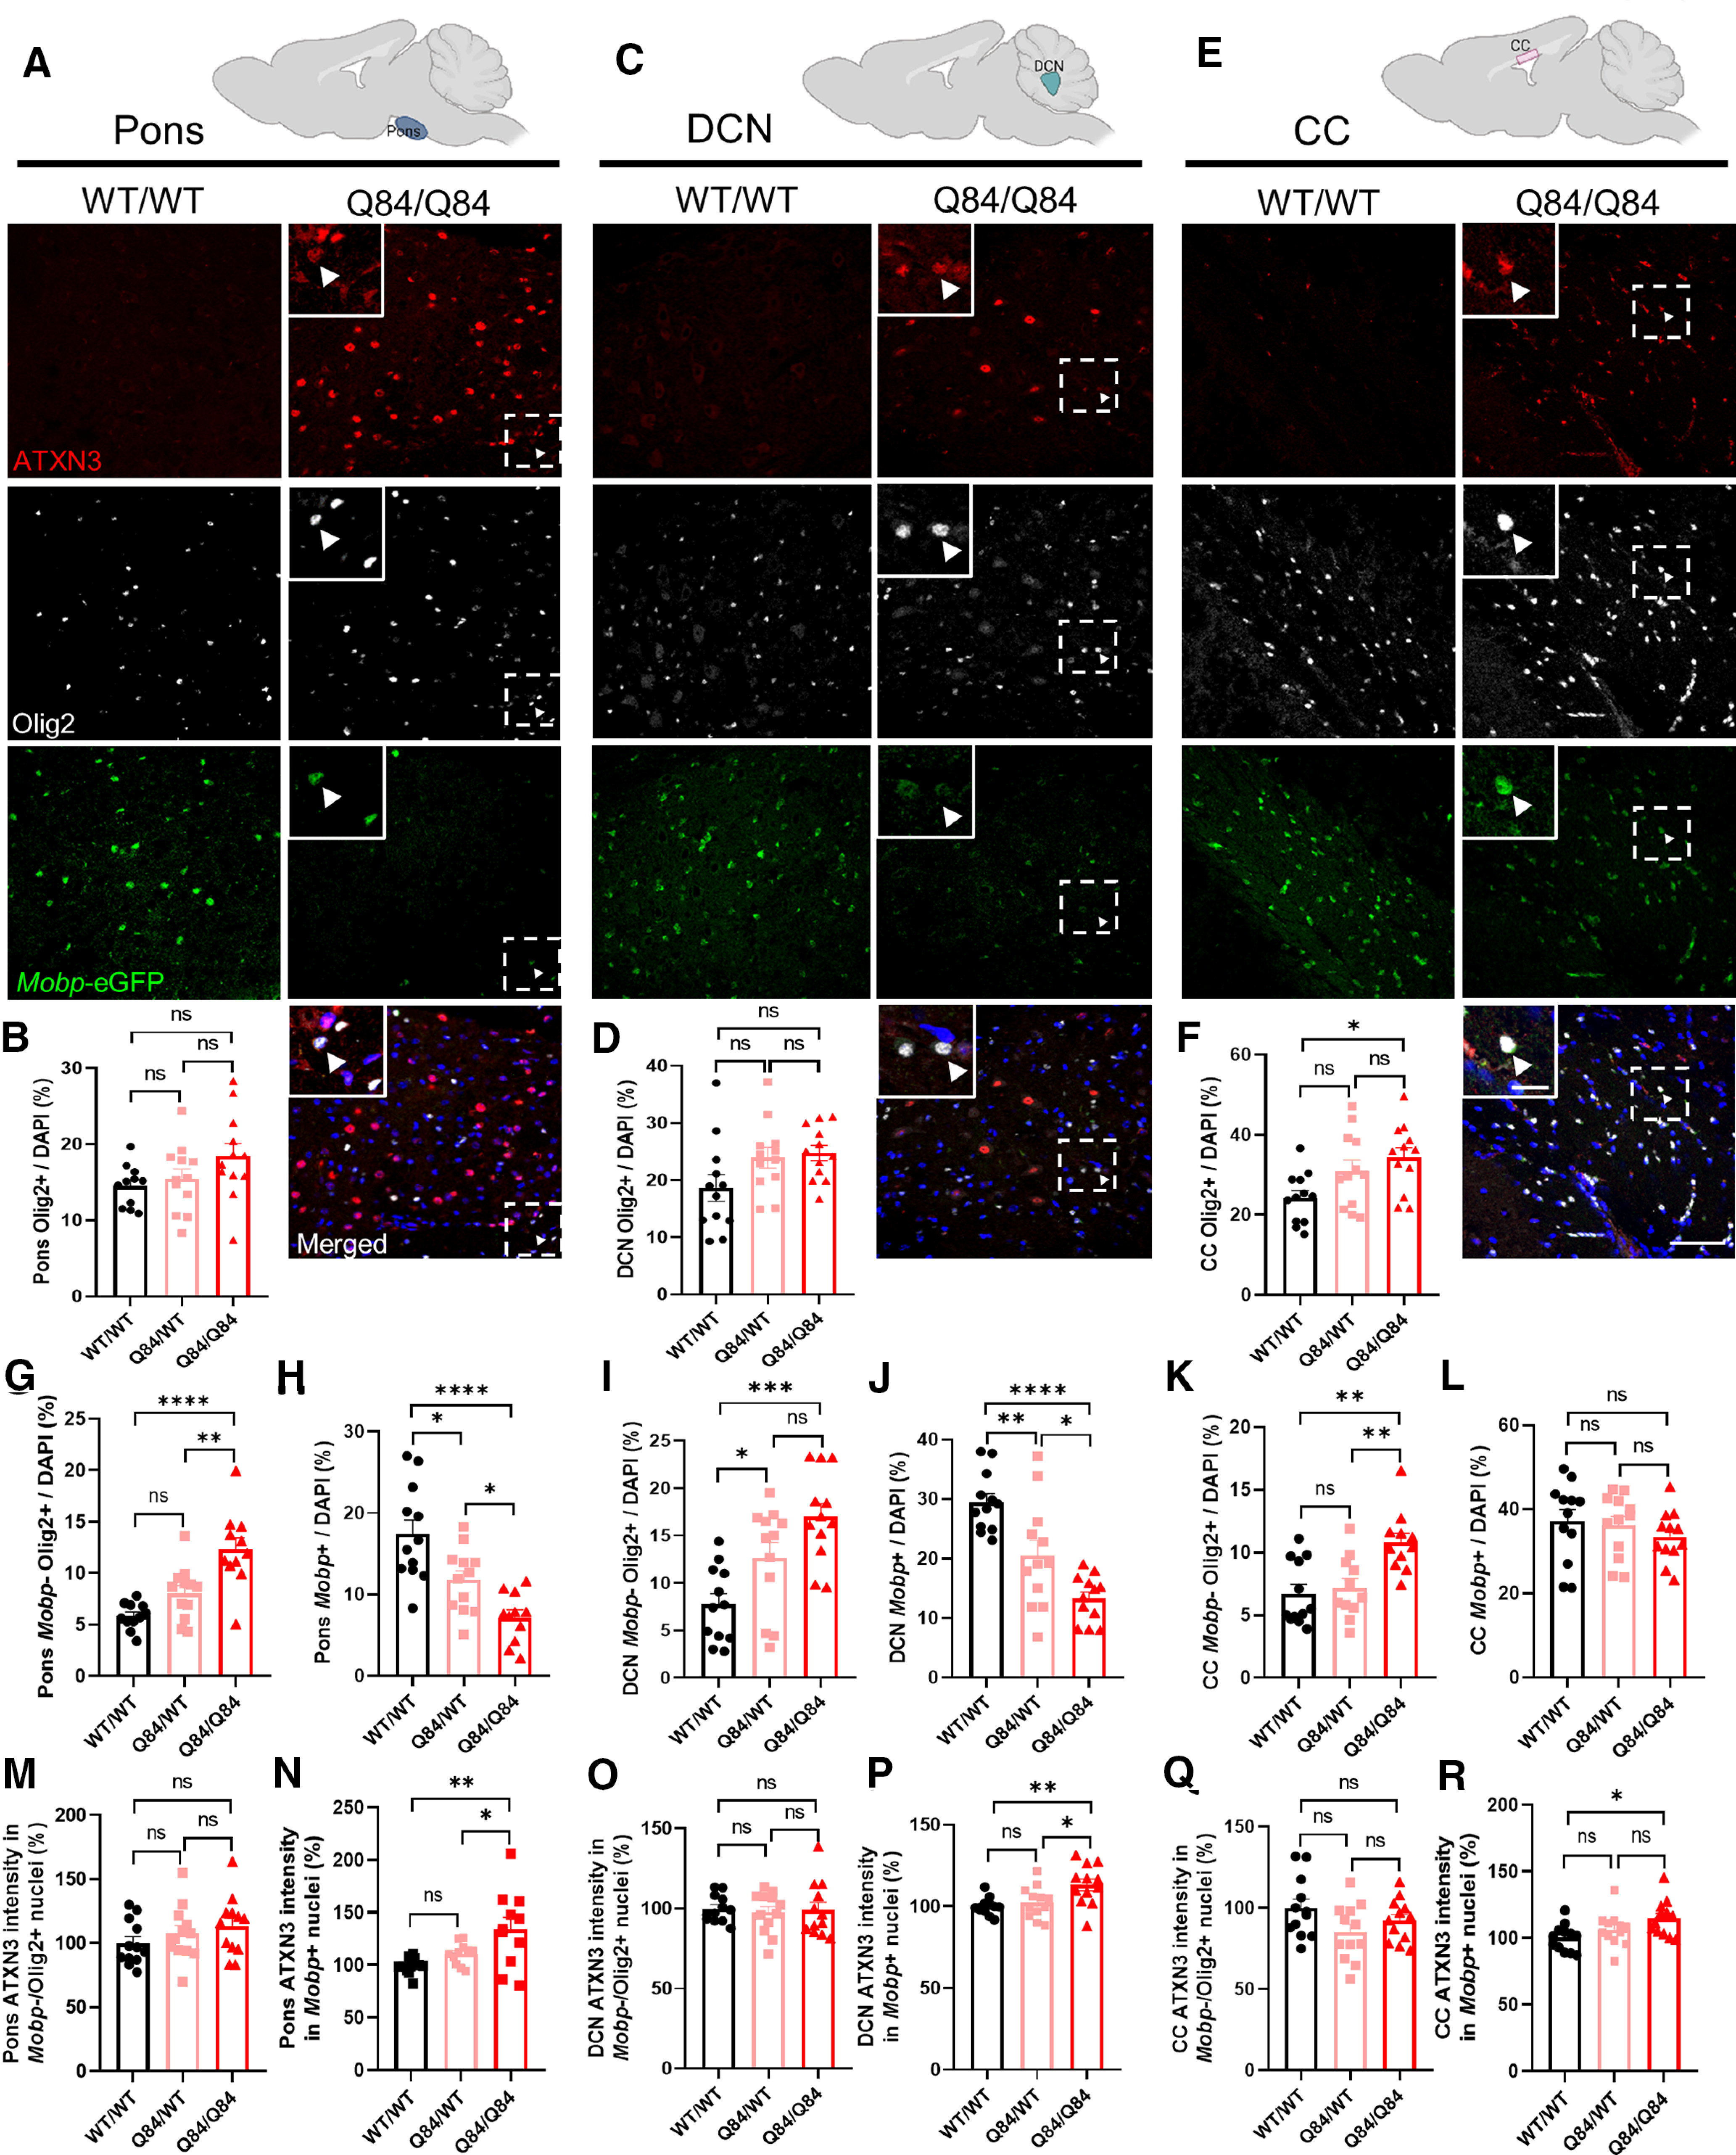
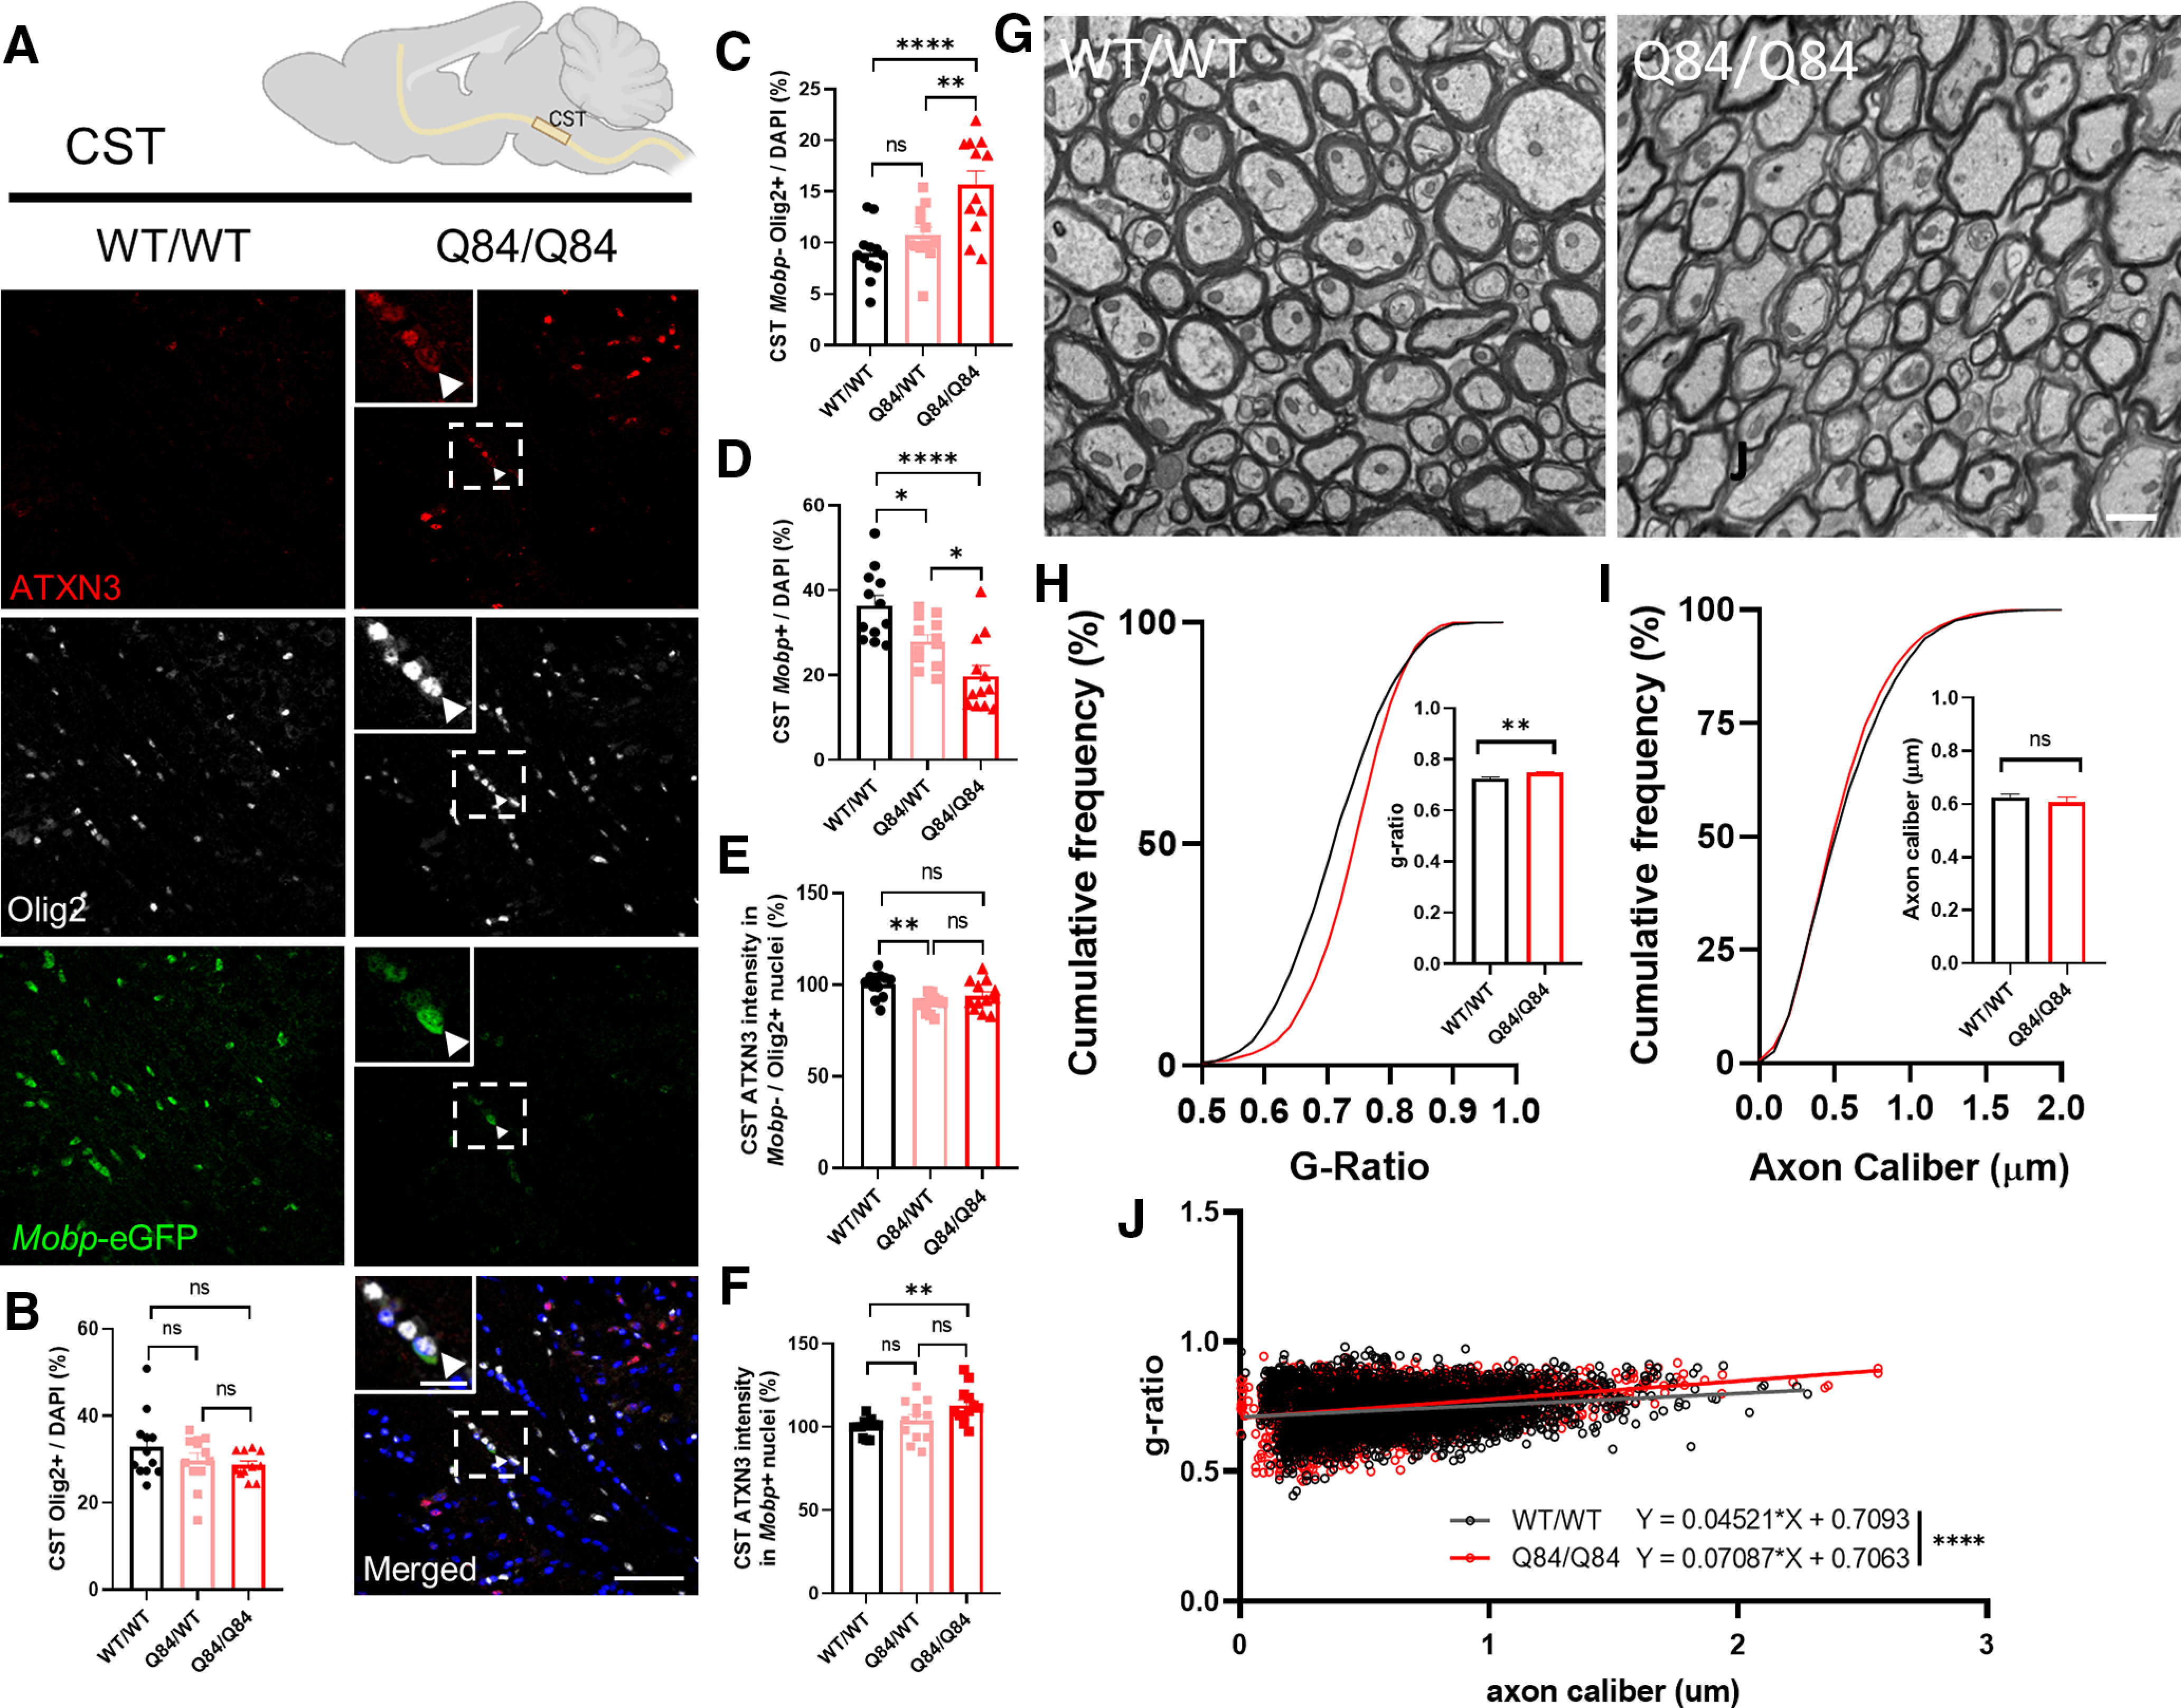
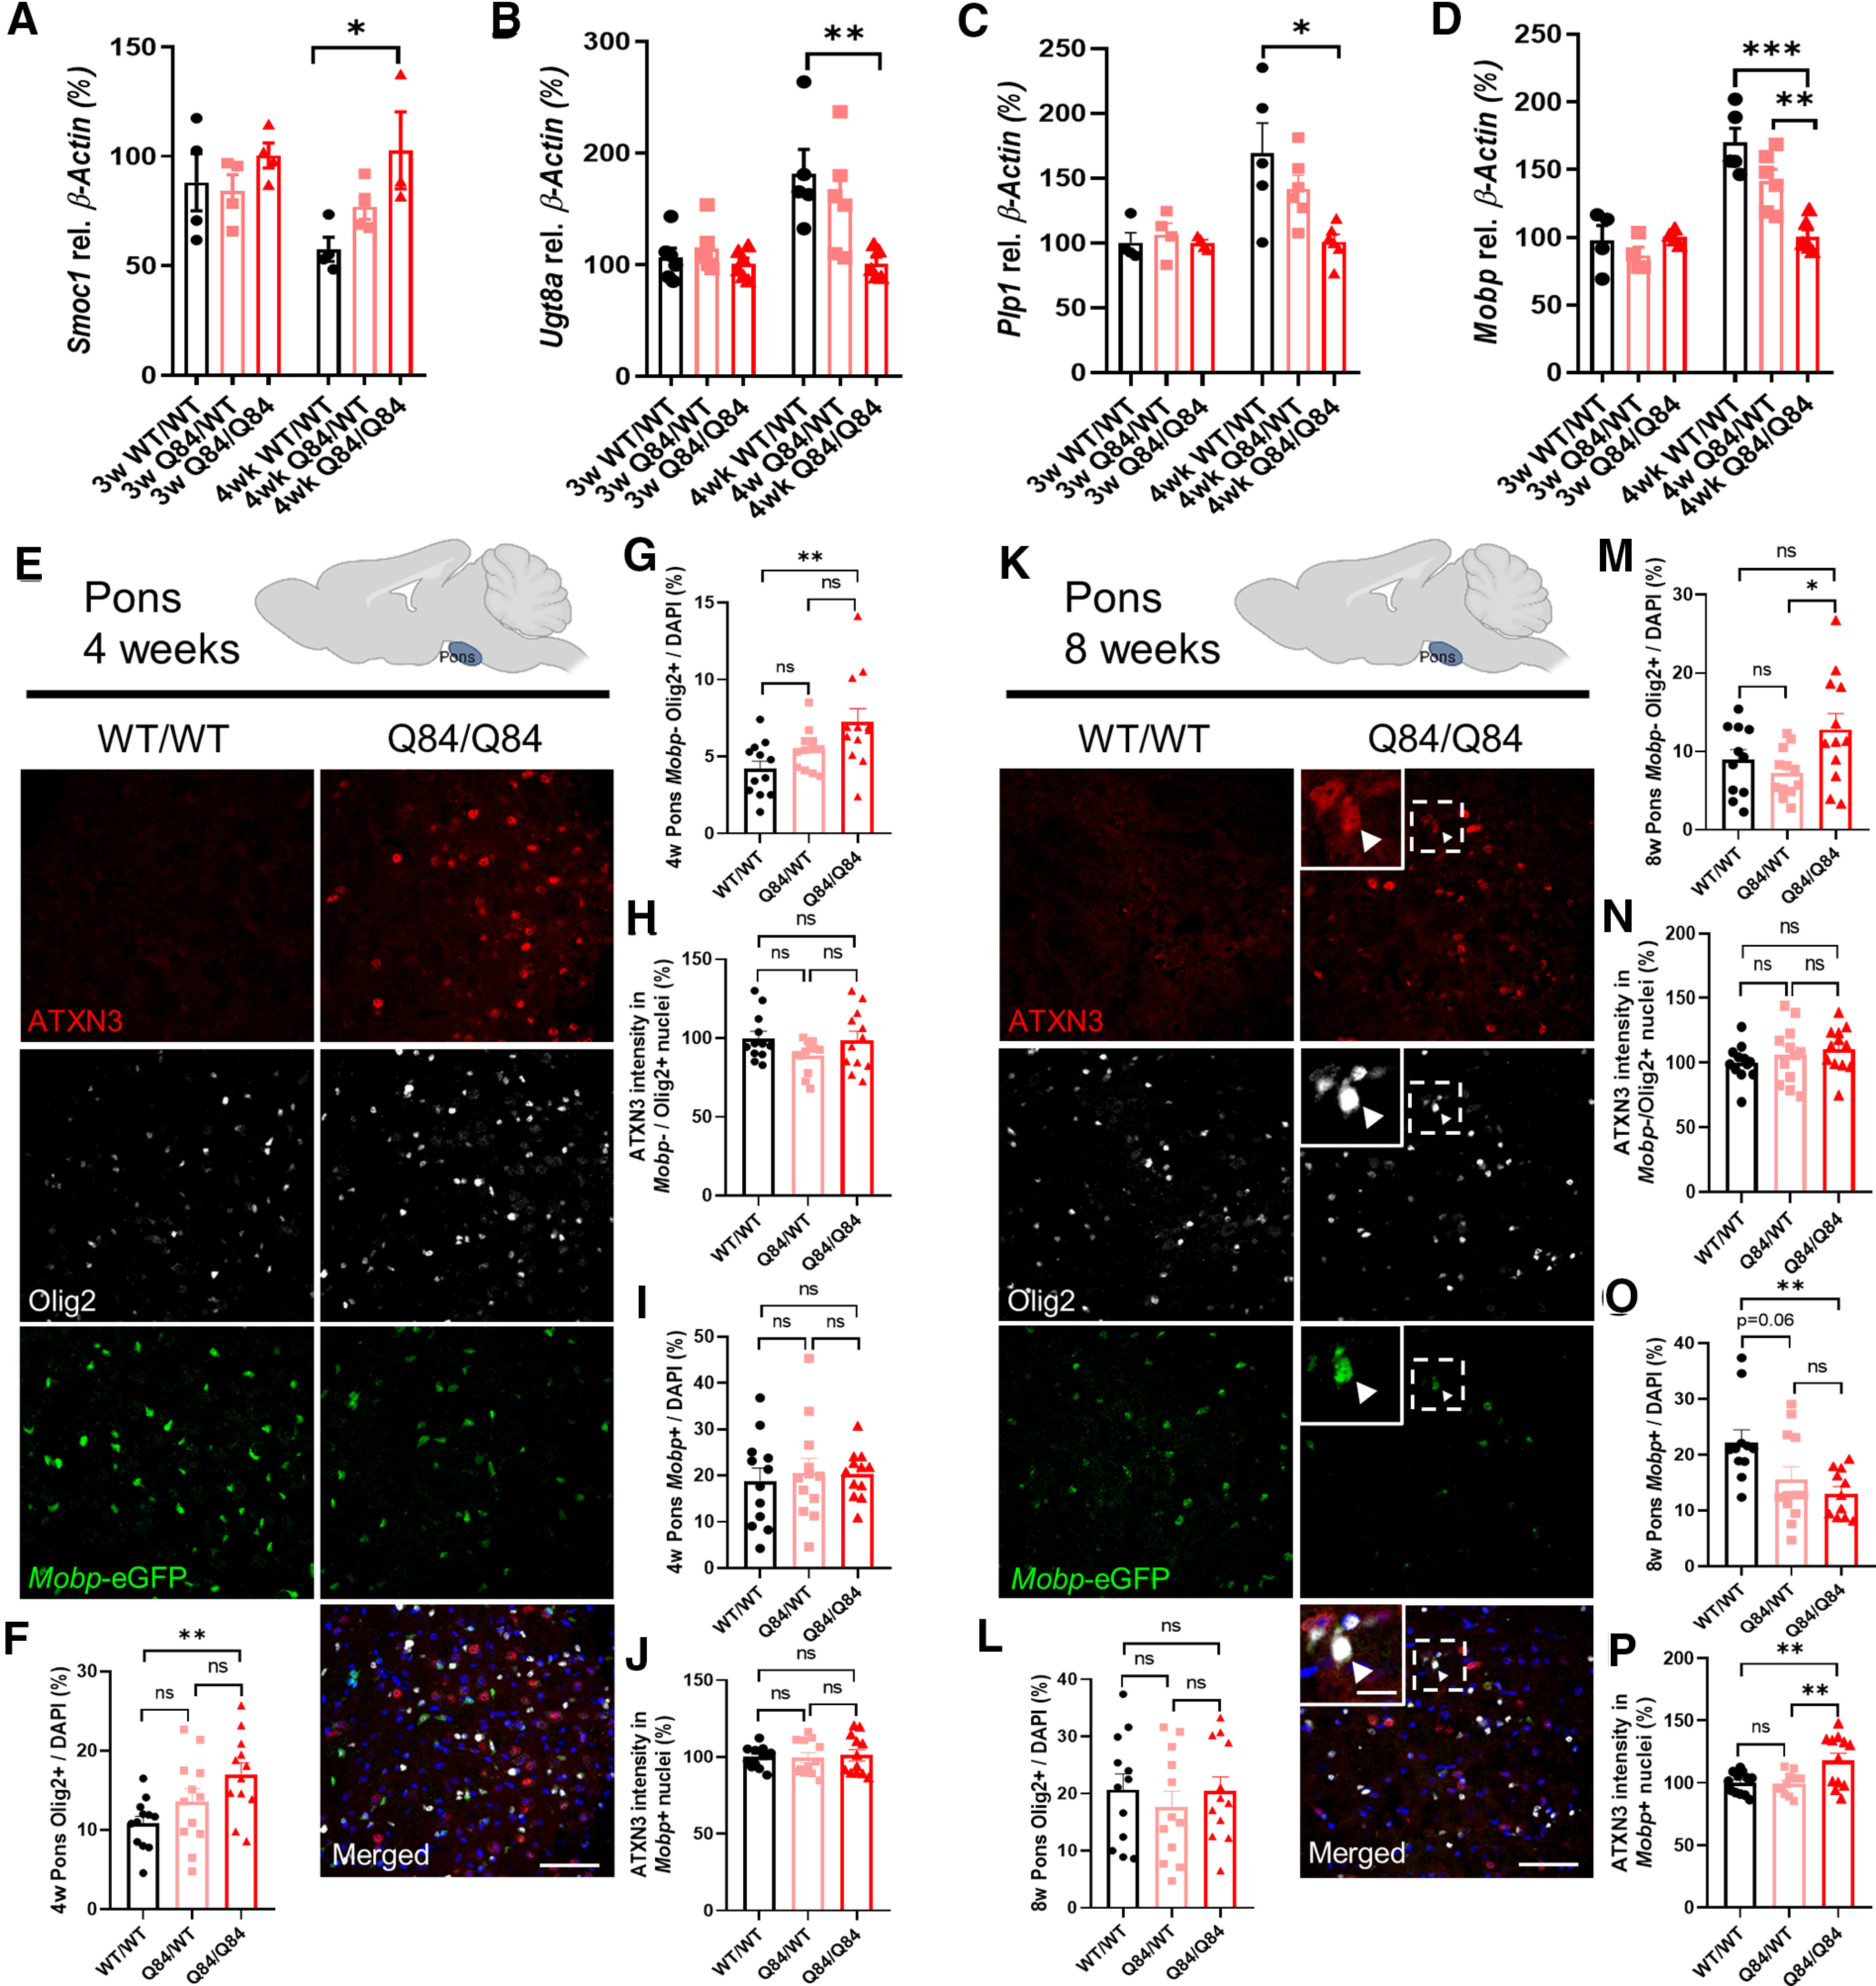
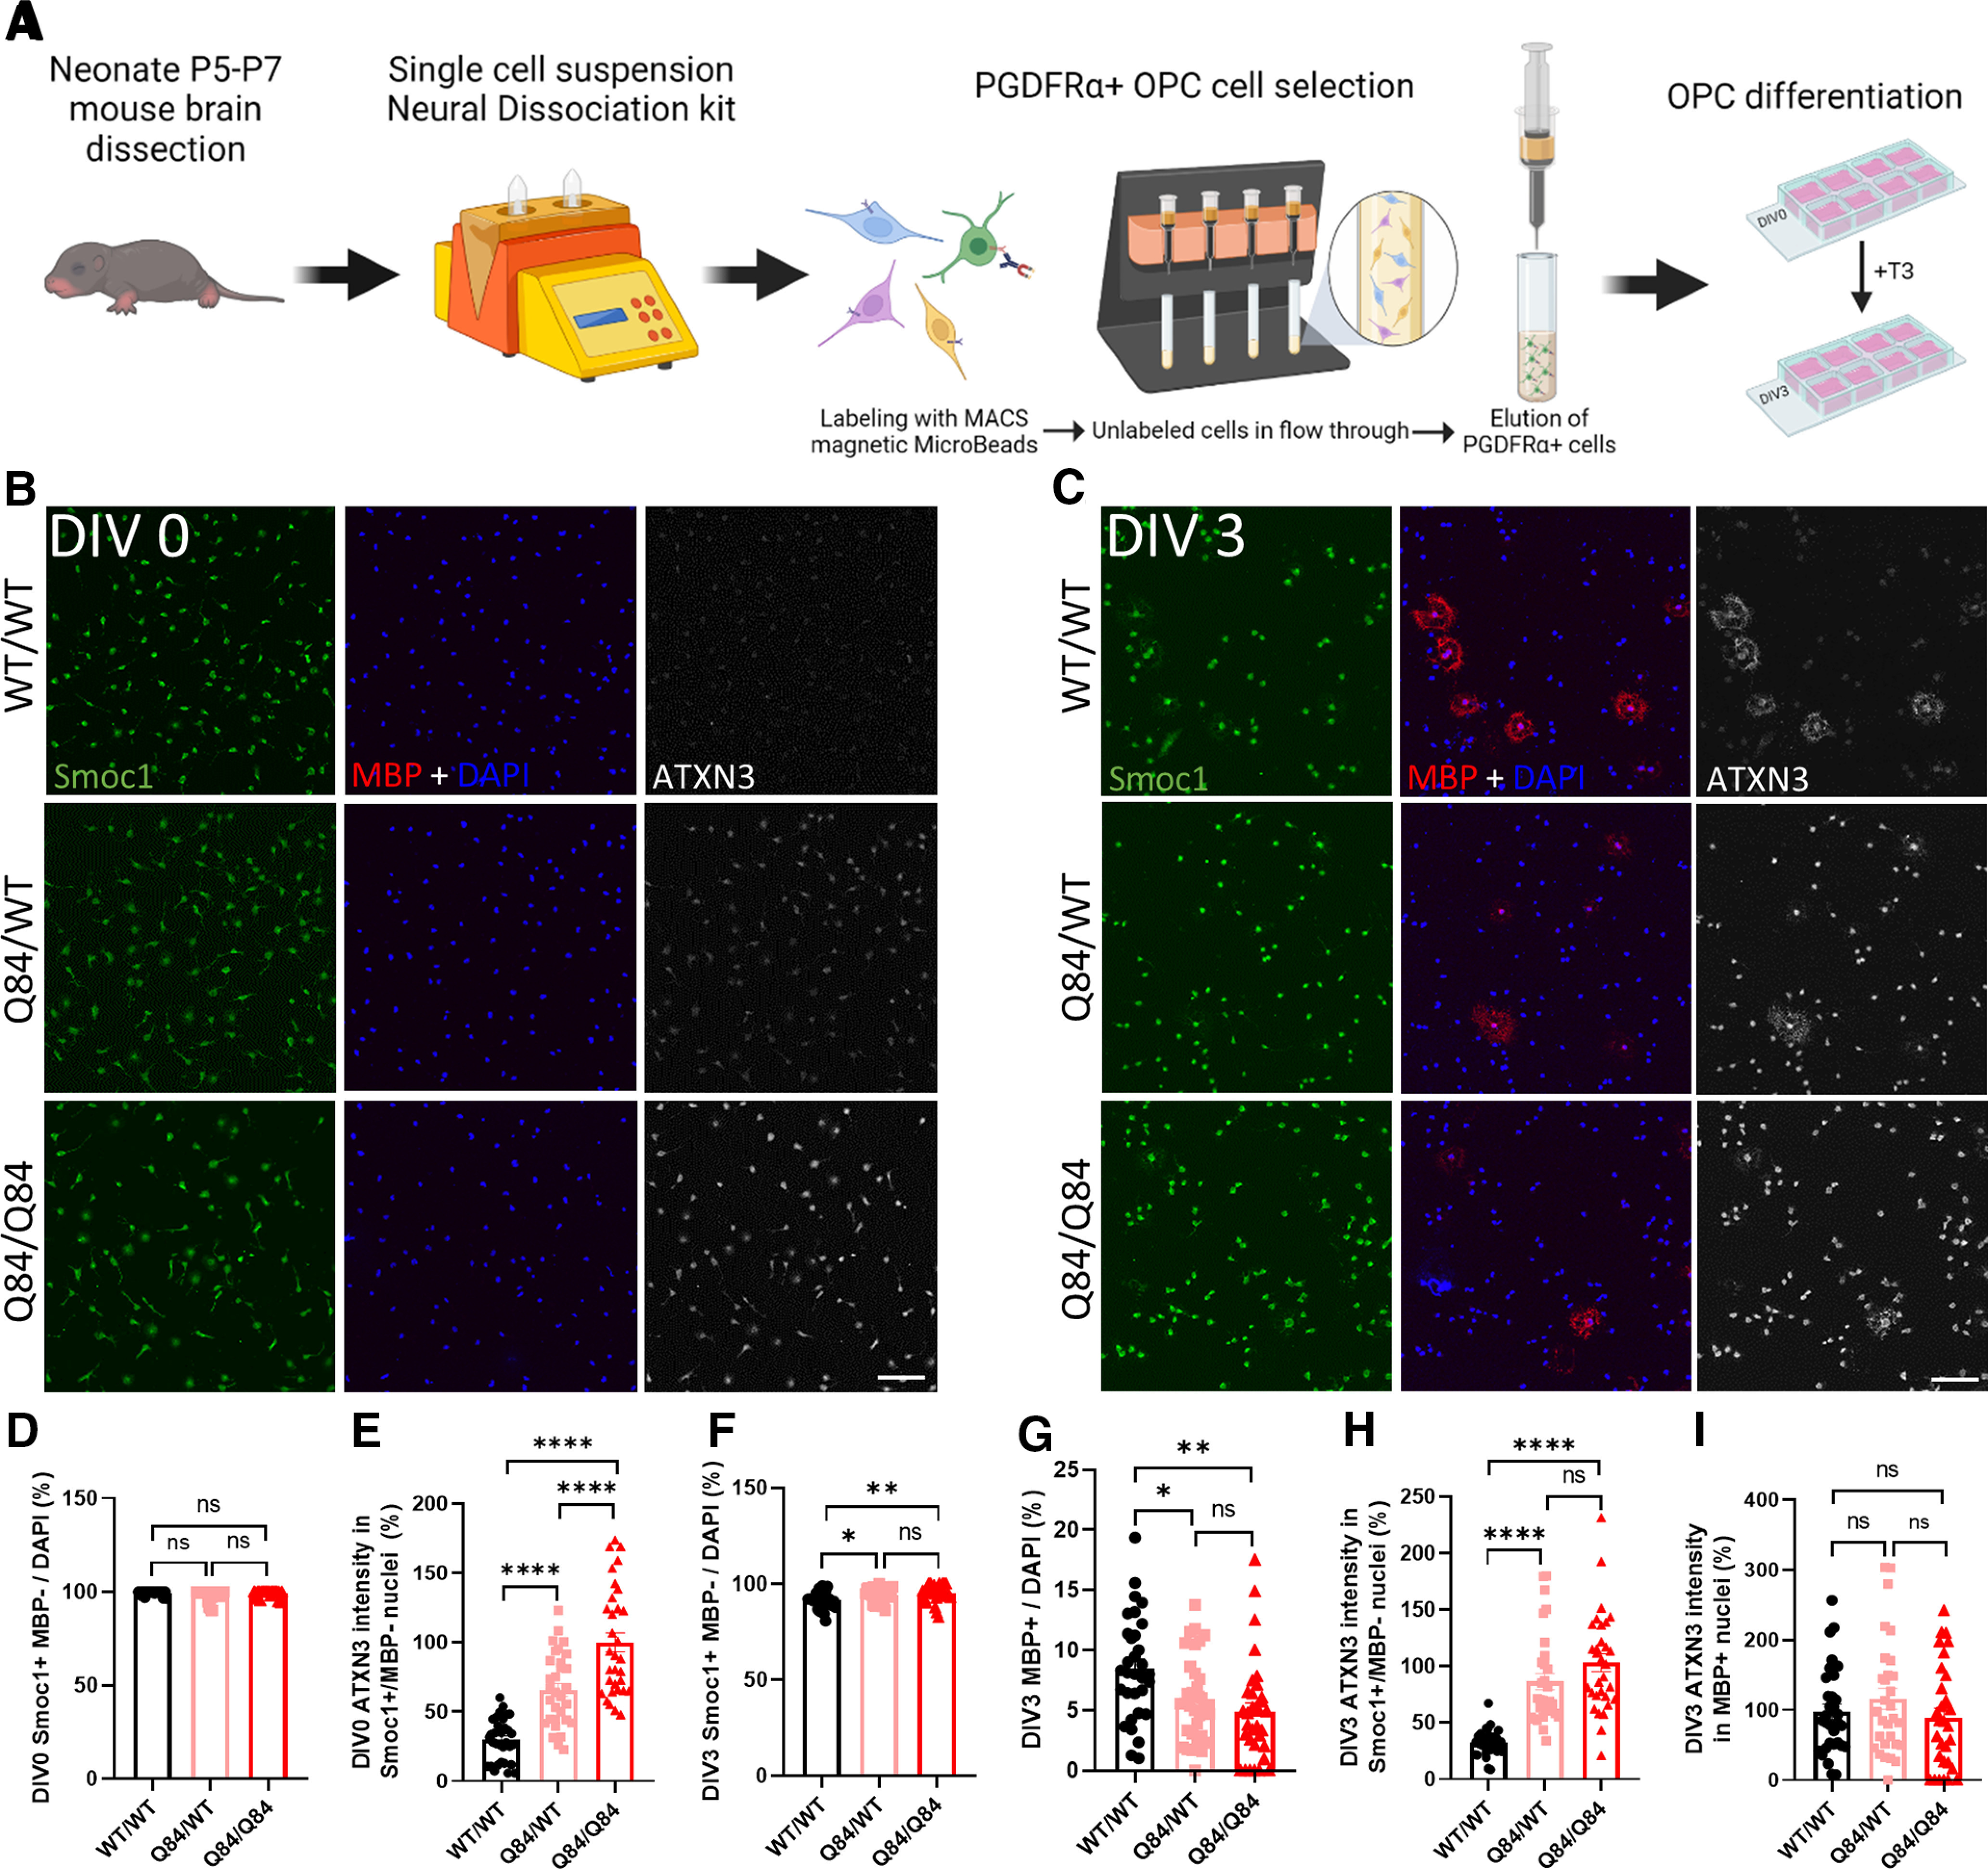
Spinocerebellar ataxia Type 3 (SCA3), the most common dominantly inherited ataxia, is a polyglutamine neurodegenerative disease for which there is no disease-modifying therapy. The polyglutamine-encoding CAG repeat expansion in the ATXN3 gene results in expression of a mutant form of the ATXN3 protein, a deubiquitinase that causes selective neurodegeneration despite being widely expressed. The mechanisms driving neurodegeneration in SCA3 are unclear. Research to date, however, has focused almost exclusively on neurons. Here, using equal male and female age-matched transgenic mice expressing full-length human mutant ATXN3, we identified early and robust transcriptional changes in selectively vulnerable brain regions that implicate oligodendrocytes in disease pathogenesis. We mapped transcriptional changes across early, mid, and late stages of disease in two selectively vulnerable brain regions: the cerebellum and brainstem. The most significant disease-associated module through weighted gene coexpression network analysis revealed dysfunction in SCA3 oligodendrocyte maturation. These results reflect a toxic gain-of-function mechanism, as ATXN3 KO mice do not exhibit any impairments in oligodendrocyte maturation. Genetic crosses to reporter mice revealed a marked reduction in mature oligodendrocytes in SCA3-disease vulnerable brain regions, and ultrastructural microscopy confirmed abnormalities in axonal myelination. Further study of isolated oligodendrocyte precursor cells from SCA3 mice established that this impairment in oligodendrocyte maturation is a cell-autonomous process. We conclude that SCA3 is not simply a disease of neurons, and the search for therapeutic strategies and disease biomarkers will need to account for non-neuronal involvement in SCA3 pathogenesis.SIGNIFICANCE STATEMENT Despite advances in spinocerebellar ataxia Type 3 (SCA3) disease understanding, much remains unknown about how the disease gene causes brain dysfunction ultimately leading to cell death. We completed a longitudinal transcriptomic analysis of vulnerable brain regions in SCA3 mice to define the earliest and most robust changes across disease progression. Through gene network analyses followed up with biochemical and histologic studies in SCA3 mice, we provide evidence for severe dysfunction in oligodendrocyte maturation early in SCA3 pathogenesis. Our results advance understanding of SCA3 disease mechanisms, identify additional routes for therapeutic intervention, and may provide broader insight into polyglutamine diseases beyond SCA3.

Keywords: Machado–Joseph disease; ataxia; myelination; oligodendrocyte; polyglutamine; spinocerebellar ataxia Type 3.


Figures

Figure 1.
Figure 1.
Spatiotemporal gene coexpression networks implicated in SCA3 mice. A, Schematic pipeline of SCA3 RNA-seq and analysis of mouse brainstem and cerebellum samples (n = 5 or 6 mice/time point/genotype). B, Number of differentially expressed genes (DEGs) between WT and Q84/Q84 mice at 8, 16, and 65 weeks of age in the brainstem and cerebellum. C, Identification of significant brainstem (BS) and cerebellum (CB) WGCNA modules in SCA3 mice relative to age-matched controls. D, Lists of top five upstream regulators identified by IPA include TCF7L2 (red) and HTT (orange) in brainstem at all time points and in cerebellum at 65 weeks. E, Significant IPA Tox list results across brainstem time points. Oxidated SR, Oxidative stress response; Chol. Biosyn, cholesterol biosynthesis).
Figure 2.
Figure 2.
Dysregulation of oligodendrocyte genes in SCA3 brainstem tissue. A, Reported relative cell type expression of the 34 Turquoise module genes that were consistently DE in SCA3 mice; cell type expression is based on RNA-seq of immunopanned mouse brain cells (Zhang et al., 2014). NF-Oligo, Newly forming-oligodendrocytes. The Turquoise module from RNA sequencing analysis is enriched for oligodendrocyte lineage genes, which are dysregulated in the brainstem of SCA3 mice. B, Illustrative representation of oligodendrocyte development and directional gene change in Q84/Q84 mice relative to WT littermates. C–H, qPCR confirmation of brainstem DEGs pertaining to individual oligodendrocyte developmental stages between Q84/Q84 and WT mice at 8, 16, and 65 weeks of age. Validated genes include Smoc1, Ugt8a, Plp1, Aspa, Mobp, and Mal. Data (mean ± SEM) are reported relative to Q84/Q84 samples (n = 4-6 per condition). Unpaired parametric t tests, assuming equal SD, were performed: *p < 0.05; **p < 0.01; ***p < 0.001. I, J, Representative Western blot image and quantification of a mature oligodendrocyte marker (MOBP) in 8- and 16-week-old brainstem tissue (n = 3 or 4 mice per genotype) analyzed by one-way ANOVA with Tukey's multiple comparisons test: *p < 0.05; **p < 0.01. K, qPCR analysis of oligodendrocyte development genes in the brainstem shows no differences in ATXN3 KO tissue in all transcripts assessed by one-way ANOVA with Tukey's multiple comparisons test. L, Similarly, no changes were found in MOBP expression levels by Western blot analysis in ATXN3 KO brainstem tissue by one-way ANOVA with Tukey's multiple comparisons test.
Figure 3.
Figure 3.
Oligodendrocyte maturation genes also dysregulated in SCA3 mouse cerebellar tissue. A–E, Validation by qPCR of gene expression changes over time in SCA3 cerebellum corresponding to oligodendrocyte genes across developmental stages. Validated genes include Smoc1, Ugt8a, Plp1, Mobp, and Mal. Data (mean ± SEM) are normalized to Q84/Q84 samples (n = 4-6 per condition). Unpaired parametric t tests, assuming equal SD, were performed: *p < 0.05; **p < 0.01. F, G, Representative Western blot image and quantification of MOBP, a mature oligodendrocyte marker, in cerebellar tissue at 8 and 16 weeks of age (n = 3 or 4 mice per genotype) analyzed by one-way ANOVA with Tukey's multiple comparisons test: *p < 0.05. H, qPCR and (I) Western blot analyses of oligodendrocyte maturation markers at 16 weeks show no changes in the cerebellum of ATXN3 KO mice by one-way ANOVA with Tukey's multiple comparisons test.
Figure 4.
Figure 4.
Reduction of mature oligodendrocytes occurs only in SCA3 vulnerable brain regions. To visualize mature oligodendrocytes in brain tissue, SCA3 mice were crossed to Mobp-eGFP reporter mice. A, C, E, Representative sagittal immunofluorescent images of ATXN3 (red), Olig2 (white), and Mobp-eGFP (green) expression in 16-week-old Q84/Q84 mice and WT littermates in the body of the pons deep cerebellar nuclei (DCN), and corpus callosum (CC). Scale bar, 50 μm. Inset, Scale bar, 12.5 μm. White arrowheads define cells with colocalization of nuclear ATXN3, Olig2, and MOBP. B, D, F, No changes in total oligodendrocyte lineage cell counts (Olig2+ cells) were found in the pons or DCN, although a significant increase in Q84/Q84 mice compared with WT was noted in the CC. G, I, K, Immature oligodendrocytes (Mobp/Olig2+) were significantly increased in all three brain regions. H, J, L, Mature oligodendrocytes (Mobp+) in the pons and DCN were significantly decreased, whereas no differences in mature oligodendrocyte cell counts were found in the CC. M–R, ATXN3 accumulated in the nucleus of mature oligodendrocytes, but not in immature oligodendrocytes in all regions assessed. Cell counts normalized to total DAPI-stained nuclei per field; ATXN3 nuclear accumulation normalized to WT/WT images (n = 3 images per mouse, n = 4 mice per genotype). Data are mean ± SEM. One-way ANOVA with Tukey's multiple comparisons test was performed: *p < 0.05; **p < 0.01; ***p < 0.001; ****p < 0.0001.
Figure 5.
Figure 5.
Reduction in Mobp-eGFP+ oligodendrocytes corresponds to ultrastructural abnormalities in the corticospinal tract (CST). A, Representative sagittal immunofluorescent images of ATXN3 (red), Olig2 (white), and Mobp-eGFP (green) expression in 16-week-old Q84/Q84 mice and WT littermates in the CST. Scale bar, 50 μm. Inset, Scale bar, 12.5 μm. White arrowheads indicate cells with colocalization of nuclear ATXN3, Olig2, and MOBP. B–D, No changes in total oligodendrocyte lineage cell counts (Olig2+) are seen; however, immature oligodendrocytes (Mobp/Olig2+ cells) are significantly increased, and mature oligodendrocytes (Mobp+) are significantly decreased in Q84/Q84 mice compared with WT. E, F, ATXN3 nuclear accumulation does not change between Q84/Q84 and WT mice in immature oligodendrocytes but does significantly increase in mature oligodendrocytes in disease mice. Cell counts normalized to total DAPI-stained nuclei per field; ATXN3 nuclear accumulation normalized to WT images (n = 3 images per mouse, n = 4 mice per genotype). G, Representative coronal CST TEM images depict abnormal myelin wrapping in 16-week-old Q84/Q84 mice. Scale bar, 1 μm. H–J, Analysis of TEM images revealed an increase in g-ratio in Q84/Q84 mice, but no changes in axon caliber. Axon caliber and g-ratio were calculated using MyelTracer software (Kaiser et al., 2021) (n = 950 ± 150 axons per mouse, n = 3 mice per genotype). Data are mean ± SEM. One-way ANOVA with Tukey's multiple comparisons test or unpaired parametric t tests, assuming equal SD, were performed: *p < 0.05; **p < 0.01; ***p < 0.001; ****p < 0.0001.
Figure 6.
Figure 6.
Oligodendrocyte transcript changes in the brainstem of SCA3 mice begin between 3 and 4 weeks of age, followed by protein changes between 4 and 8 weeks old. A–D, No changes in brainstem oligodendrocyte maturation transcripts are seen at 3 weeks; however, by 4 weeks of age, there are significant increases in levels of OPC marker Smoc1 and significant decreases in differentiating or mature oligodendrocyte markers Ugt8a, Plp1, and Mobp. E, K, Representative sagittal immunofluorescent images of ATXN3 (red), Olig2 (white), and Mobp-eGFP (green) expression in 4- and 8-week-old WT and Q84/Q84 mice in the body of the pons. Scale bar, 50 μm. Inset, Scale bar, 12.5 μm. White arrowheads indicate cells with colocalization of nuclear ATXN3, Olig2, and MOBP. F–J, A significant increase in oligodendrocyte lineage cells, as well as immature oligodendrocytes, is seen at 4 weeks in the pons of Q84/Q84 mice, but there are no changes in mature oligodendrocyte cell counts or ATXN3 nuclear accumulation in immature or mature oligodendrocyte cells. L, M, By 8 weeks of age, there are no significant differences in Olig2+ cell counts or immature oligodendrocyte counts between Q84/Q84 and WT mice. N, No changes in ATXN3 nuclear accumulation are observed in immature oligodendrocytes. O, P, A significant reduction of Mobp-eGFP+ oligodendrocytes is seen at 8 weeks with increasing ATXN3 nuclear accumulation noted only in mature oligodendrocytes in disease mice. Cell counts normalized to total DAPI-stained nuclei per field; ATXN3 nuclear accumulation normalized to WT images (n = 3 images per mouse, n = 4 mice per genotype). Data are mean ± SEM. One-way ANOVA with Tukey's multiple comparisons test was performed: *p < 0.05; **p < 0.01; ***p < 0.001.
Figure 7.
Figure 7.
Cell-autonomous impairment of OPC differentiation to mature oligodendrocytes in cells cultured from SCA3 mice. A, Schematic of OPC isolation and culture. B, C, Representative immunofluorescent images of Smoc1 (green), MBP (red), ATXN3 (white), and DAPI (blue) expression in OPCs cultured from WT/WT, Q84/WT, and Q84/Q84 mice at days differentiated in vitro (DIV0) and DIV3. Scale bar, 100 μm. D, E, Before differentiation, DIV0 OPC counts of Smoc1+/MBP show no differences between genotypes, although cells cultured from disease mice display a dose-dependent increase in ATXN3 nuclear accumulation. F, G, After differentiating for 3 d in +T3 culture media (DIV3), there are significantly more immature (Smoc1+/MBP) cells and fewer maturing (MBP+) cells in cultures from Q84/WT and Q84/Q84 mice. H, I, ATXN3 accumulates significantly more in the nucleus of immature cells from disease mice, while maturing oligodendrocytes display no change of ATXN3 nuclear accumulation between genotypes. Cell counts normalized to total DAPI-stained nuclei per field; ATXN3 nuclear accumulation normalized to Q84/Q84 images (n = 8 images per mouse, n = 3 or 4 mice per genotype). Data are mean ± SEM. One-way ANOVA with Tukey's multiple comparisons test was performed: *p < 0.05; **p < 0.01; ***p < 0.001; ****p < 0.0001.

References

    1. Becanovic K, Pouladi MA, Lim RS, Kuhn A, Pavlidis P, Luthi-Carter R, Hayden MR, Leavitt BR (2010) Transcriptional changes in Huntington disease identified using genome-wide expression profiling and cross-platform analysis. Hum Mol Genet 19:1438–1452. 10.1093/hmg/ddq018 - DOI - PMC - PubMed
    1. Bichelmeier U, Schmidt T, Hübener J, Boy J, Rüttiger L, Häbig K, Poths S, Bonin M, Knipper M, Schmidt WJ, Wilbertz J, Wolburg H, Laccone F, Riess O (2007) Nuclear localization of Ataxin-3 is required for the manifestation of symptoms in SCA3: in vivo evidence. J Neurosci 27:7418–7428. 10.1523/JNEUROSCI.4540-06.2007 - DOI - PMC - PubMed
    1. Cemal CK, Carroll CJ, Lawrence L, Lowrie MB, Ruddle P, Al-Mahdawi S, King RH, Pook MA, Huxley C, Chamberlain S (2002) YAC transgenic mice carrying pathological alleles of the MJD1 locus exhibit a mild and slowly progressive cerebellar deficit. Hum Mol Genet 11:1075–1094. 10.1093/hmg/11.9.1075 - DOI - PubMed
    1. Chou AH, Chen CY, Chen SY, Chen WJ, Chen YL, Weng YS, Wang HL (2010) Polyglutamine-expanded ataxin-7 causes cerebellar dysfunction by inducing transcriptional dysregulation. Neurochem Int 56:329–339. 10.1016/j.neuint.2009.11.003 - DOI - PubMed
    1. do Carmo Costa M, Luna-Cancalon K, Fischer S, Ashraf NS, Ouyang M, Dharia RM, Martin-Fishman L, Yang Y, Shakkottai VG, Davidson BL, Rodríguez-Lebrón E, Paulson HL (2013) Toward RNAi therapy for the polyglutamine disease Machado–Joseph disease. Mol Ther 21:1898–1908. 10.1038/mt.2013.144 - DOI - PMC - PubMed

Publication types