. 2022 Jan 18;119(3):e2111900119.
doi: 10.1073/pnas.2111900119.

Radiotherapy transiently reduces the sensitivity of cancer cells to lymphocyte cytotoxicity

Affiliations

Radiotherapy transiently reduces the sensitivity of cancer cells to lymphocyte cytotoxicity

Karoliina Tuomela et al. Proc Natl Acad Sci U S A. .

Abstract

The impact of radiotherapy on the interaction between immune cells and cancer cells is important not least because radiotherapy can be used alongside immunotherapy as a cancer treatment. Unexpectedly, we found that X-ray irradiation of cancer cells induced significant resistance to natural killer (NK) cell killing. This was true across a wide variety of cancer-cell types as well as for antibody-dependent cellular cytotoxicity. Resistance appeared 72 h postirradiation and persisted for 2 wk. Resistance could also occur independently of radiotherapy through pharmacologically induced cell-cycle arrest. Crucially, multiple steps in NK-cell engagement, synapse assembly, and activation were unaffected by target cell irradiation. Instead, radiotherapy caused profound resistance to perforin-induced calcium flux and lysis. Resistance also occurred to a structurally similar bacterial toxin, streptolysin O. Radiotherapy did not affect the binding of pore-forming proteins at the cell surface or membrane repair. Rather, irradiation instigated a defect in functional pore formation, consistent with phosphatidylserine-mediated perforin inhibition. In vivo, radiotherapy also led to a significant reduction in NK cell-mediated clearance of cancer cells. Radiotherapy-induced resistance to perforin also constrained chimeric antigen receptor T-cell cytotoxicity. Together, these data establish a treatment-induced resistance to lymphocyte cytotoxicity that is important to consider in the design of radiotherapy-immunotherapy protocols.

Keywords: NK cell; T cell; cancer; perforin; radiotherapy.


Conflict of interest statement

The authors declare no competing interest.

Figures
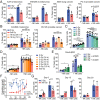
Fig. 1.
Fig. 1.
Cancer cells treated with radiotherapy become resistant to NK-cell cytotoxicity. (A and B) Cancer cell lines were treated with 3 × 8 Gy or a single 16 Gy dose 24 or 72 h prior to assessing cell death in the presence or absence of NK cells over 5 h (A375 [n = 4], WM-266.4 [n = 5], A549 [n = 6], PC-3 [n = 5], Colo829 [n = 7], and DU145 [n = 4]). Death was quantified by annexin V/PI staining using flow cytometry. (C) Colo829 cells were treated with single doses of radiation (1 to 8 Gy) 72 h prior to incubation with NK cells as in A (n = 3). (D) Colo829 cells were treated with either five doses of 2 Gy given on consecutive days or a single 2 Gy dose given 24 to 120 h prior to incubation with NK cells as in A (n = 5). (E) Daudi-β2M cells were irradiated with 8 Gy 72 h prior, opsonized with 10 µg/mL anti-CD20 or an isotype-matched control for 30 min, and incubated with or without NK cells for 2 h. Death was determined as in A (n = 3). (F and G) Untreated or 3 × 8 Gy–treated Colo829 cells were cultured for 22 d after treatment. Fold change per day was measured at 2- to 3-d intervals (F). Cells were harvested at days 6, 13, and 20, and a killing assay with NK cells was carried out (n = 3 to 6) (G). Means ± SD are indicated. Significance was determined using a paired t test (A and G), one-way ANOVA (BE), or two-way ANOVA (F). *P < 0.05, **P < 0.01, ***P < 0.001, and ****P < 0.0001.
Fig. 2.
Fig. 2.
Cancer-cell irradiation does not affect the dynamics of the NK cell–cancer cell interaction. (A and B) NK-cell conjugation was quantified by incubation of dye-labeled NK cells with dye-labeled 0 Gy– or 3 × 8 Gy–treated cells for 10, 30, or 60 min. The percentage of double-positive conjugates was determined by flow cytometry. Representative flow cytometry plots of Colo829 cells (A) and quantification of Colo829, A375, and DU145 cells is shown (B) (n = 3). (CF) Colo829 cells were incubated with NK cells for 10, 20, or 40 min and stained for CD56 (blue), pericentrin (yellow), actin (green), and perforin (red). Representative images show an NK cell (Left) and a target cell (Right) with a dotted line indicating the length of the immune synapse (C). (Scale bar, 5 µm.) The percentage of NK cells polarized per donor (distance of MTOC to immune synapse/diameter of cell <0.333) (D), the distance of the MTOC to immune synapse per conjugate (E), and the synapse length per conjugate (F) were calculated (n = 4 to 6). (G) NK-cell degranulation was quantified by measuring CD107a surface expression following a 5-h incubation with Colo829, DU145, and A375 cells (n = 3 to 6). (H) NK-cell detachment was quantified by incubation of NK cells with irradiated or nonirradiated Colo829, A375, or DU145 cells for 30 min prior to dilution in excess media (time = 0 min) to prevent further conjugation. The percentage of conjugates was determined at each time point, and conjugates remaining were quantified as a relative percentage to the conjugates at time 0 (n = 3). Means ± SD are indicated. Significance was determined using a paired t test (B, DF, and H) or a repeated-measures one-way ANOVA (G). *P < 0.05, **P < 0.01, and ***P < 0.001.
Fig. 3.
Fig. 3.
NK cells interact normally with irradiated cancer cells. Live-cell imaging was carried out over 5 h for NK cells incubated with untreated or 3 × 8 Gy–treated Colo829 cells in 350 × 350 µm microwells. (A) Representative images showing an NK cell (blue; white arrow) prior to attachment to a target cell (green), then subsequent attachment, killing (To-pro-3 entry; red), and detachment from the dead target cell. (Scale bar, 10 µm.) Time shown as hh:mm. (BE) The percentage of conjugates resulting in a kill (B), the number of interactions per NK cell (C), the mean duration of each contact between an NK cell and target (D), and the time taken to kill after forming a conjugate (E) were recorded (n = 4). Black dots represent means of experiments, and colored dots represent individual events (BE). Means ± SD are indicated. Significance was determined using a paired t test (BD) or Mann–Whitney U test (E). *P < 0.05.
Fig. 4.
Fig. 4.
Radiotherapy induces resistance to perforin. (A) Colo829 and DU145 cells were treated for 15 min with native human perforin. Specific lysis was assessed using PI staining by flow cytometry (n = 3). (B) Colo829 cells were treated with 16 Gy for 24 or 72 h, prior to treatment with 500 ng/mL perforin for 15 min. Lysis was assessed as in A (n = 3). (C) Colo829 cells were treated with SLO for 15 min, and lysis was assessed as in A (n = 4). (D) Colo829 cells were treated with SLO and granzyme B for 4 h. Specific death was determined by annexin V/PI relative to baseline death (n = 4). (E) Colo829 cells were treated with recombinant human TRAIL (rhTRAIL) for 24 h, and specific death was determined as in D (n = 3). (F) Colo829 cells were treated with staurosporine for 24 h, and apoptosis was determined by annexin V/PI. (G) NK cells were treated for 2 h with concanamycin A, then incubated with 0 Gy or 3 × 8 Gy–treated Colo829 cells for 5 h. Specific killing was determined by annexin V/PI staining and normalized to control without NK cells (n = 4). Mean ± SD are indicated. Significance was determined using a paired t test (A, C, and EG) or repeated-measures one-way ANOVA (B and D). *P < 0.05, **P < 0.01, ***P < 0.001, and ****P < 0.0001.
Fig. 5.
Fig. 5.
Functional pore formation is inhibited on irradiated cell membranes. (AC) Colo829 cells were stained with fluo-4 and imaged by confocal microscopy to determine calcium flux after addition of 20 µg/mL recombinant perforin at 60 s. Representative images of fluo-4 fluorescence shown at baseline and varying times after perforin addition (A). (Scale bar, 10 µm.) The change in fluo-4 fluorescence relative to baseline over time (B), peak fluo-4 fluorescence relative to baseline, and the time taken to reach peak were calculated for 20 cells per condition (n = 3) (C). Solid line and shaded area indicate mean and SD, respectively. Gray and colored dots indicate individual cells and means of experiments, respectively. (D) Colo829 cells were stained with indo-1, and calcium flux was quantified using flow cytometry after addition of 0.5 µg/mL SLO at 30 s. The change in indo-1 fluorescence ratio relative to baseline and the percentage of cells responding with increased calcium concentration above baseline were determined. (E) Colo829 cells were treated with SLO in the presence of 2 mM CaCl2 or MgCl2 in PBS, and lysis was assessed using PI staining by flow cytometry (n = 3). (F) Colo829 cells were treated with 1,000 or 2,000 ng/mL native perforin for 15 min, and binding of perforin was assessed by Western blot. β-actin was used as a loading control. (G) Colo829 cells were treated with AF488-conjugated SLO for 15 min, and binding was assessed by flow cytometry. (H) Cancer cells treated with radiotherapy (0 Gy, 3 × 8 Gy, or 24 to 72 h after 16 Gy) were stained with annexin V to quantify surface phosphatidylserine and analyzed by flow cytometry. MFI is shown relative to 0 Gy. (I) Liposomes composed of phosphatidylcholine and 0, 30, 60, or 100% phosphatidylserine (PS) and containing 5,6-carboxyfluorescein dye were treated with 20 µg/mL recombinant human perforin. Lysis of liposomes was determined by dye release tracked over time (n = 3). Triton X-100 was added at 60 min to induce total lysis. Mean ± SD are indicated. Significance was determined using a two-way ANOVA (B and D), unpaired t test (C), paired t test (G), or one-way ANOVA (H). *P < 0.05, **P < 0.01, and ****P < 0.0001.
Fig. 6.
Fig. 6.
Radiotherapy causes resistance to NK-cell cytotoxicity in vivo. (A) Colo829 cells were treated with 16 Gy either 24 or 72 h prior, stained with CFSE and CTV, respectively, and mixed at a 1:1 ratio. Targets were incubated with human NK cells at a 5:1 E:T ratio for 5 h. The proportion of 72-h-postirradiation cells of total target cells is shown (n = 4). (BD) A total of 1 × 10⁶ 72-h-postirradiation Colo829 cells and 1 × 10⁶ 24-h-postirradiation Colo829 cells were stained with CTV and CFSE, respectively, and injected into the peritoneum of NSG mice with 10 × 106 IL-2–activated human NK cells. After 5 h, peritoneal effluent was analyzed by flow cytometry to determine the percentage of 72 h postirradiation cells of total target cells. Schematic of experiment (B) and representative FACS plot (C) are shown. The experiment was carried out in two independent cohorts (squares and circles; control: n = 7, +NK cells: n = 14) (D). Mean ± SD are indicated. Significance was determined using a paired t test (A) and unpaired t test (D). **P < 0.01.
Fig. 7.
Fig. 7.
Radiotherapy induces resistance to CAR T-cell cytotoxicity. (A) CD19 CAR expression on transduced T cells. Dotted line indicates mock transduced cells. (B) CD19-specific CAR T cells were incubated for 5 h at varying effector-to-target ratios (E:T) with Daudi cells treated with 8 Gy 72 h prior. Lysis of Daudi cells was determined by annexin V/PI staining by flow cytometry (n = 4). (C) CD19-specific CAR T-cell degranulation was quantified by measuring CD107a surface expression following a 5-h incubation with Daudi cells treated with 0 or 8 Gy 72 h prior. Representative flow cytometry plots with percentage of CD107a+ CAR T cells shown on left. Quantification of CD107a expression on CAR T cells shown on right (n = 3). Mean ± SD are indicated. Significance was determined using a two-way ANOVA (A) and one-way ANOVA (B). *P < 0.05, **P < 0.01, ***P < 0.001, and ****P < 0.0001.

References

    1. Baskar R., Lee K. A., Yeo R., Yeoh K.-W., Cancer and radiation therapy: Current advances and future directions. Int. J. Med. Sci. 9, 193–199 (2012). - PMC - PubMed
    1. Morgan M. A., Lawrence T. S., Molecular pathways: Overcoming radiation resistance by targeting DNA damage response pathways. Clin. Cancer Res. 21, 2898–2904 (2015). - PMC - PubMed
    1. Barker H. E., Paget J. T. E., Khan A. A., Harrington K. J., The tumour microenvironment after radiotherapy: Mechanisms of resistance and recurrence. Nat. Rev. Cancer 15, 409–425 (2015). - PMC - PubMed
    1. Weichselbaum R. R., Liang H., Deng L., Fu Y.-X., Radiotherapy and immunotherapy: A beneficial liaison? Nat. Rev. Clin. Oncol. 14, 365–379 (2017). - PubMed
    1. Cullen S. P., Martin S. J., Mechanisms of granule-dependent killing. Cell Death Differ. 15, 251–262 (2008). - PubMed

Publication types