

Machine Learning Can be Used to Predict Function but Not Pain After Surgery for Thumb Carpometacarpal Osteoarthritis
- PMID: 35042837
- PMCID: PMC9191288
- DOI: 10.1097/CORR.0000000000002105
Machine Learning Can be Used to Predict Function but Not Pain After Surgery for Thumb Carpometacarpal Osteoarthritis
Abstract
Background: Surgery for thumb carpometacarpal osteoarthritis is offered to patients who do not benefit from nonoperative treatment. Although surgery is generally successful in reducing symptoms, not all patients benefit. Predicting clinical improvement after surgery could provide decision support and enhance preoperative patient selection.
Questions/purposes: This study aimed to develop and validate prediction models for clinically important improvement in (1) pain and (2) hand function 12 months after surgery for thumb carpometacarpal osteoarthritis.
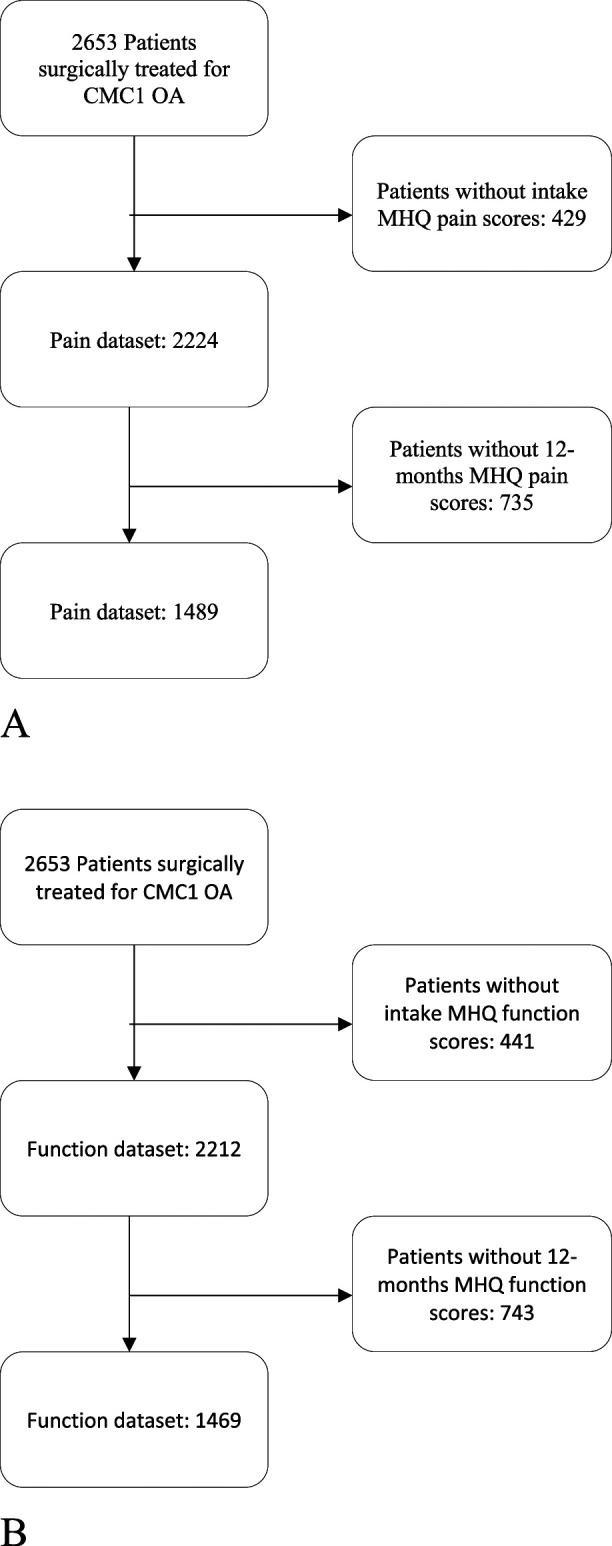
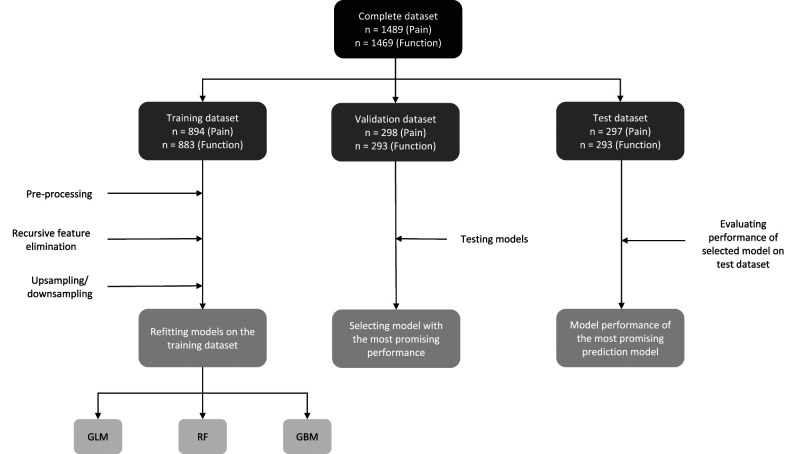
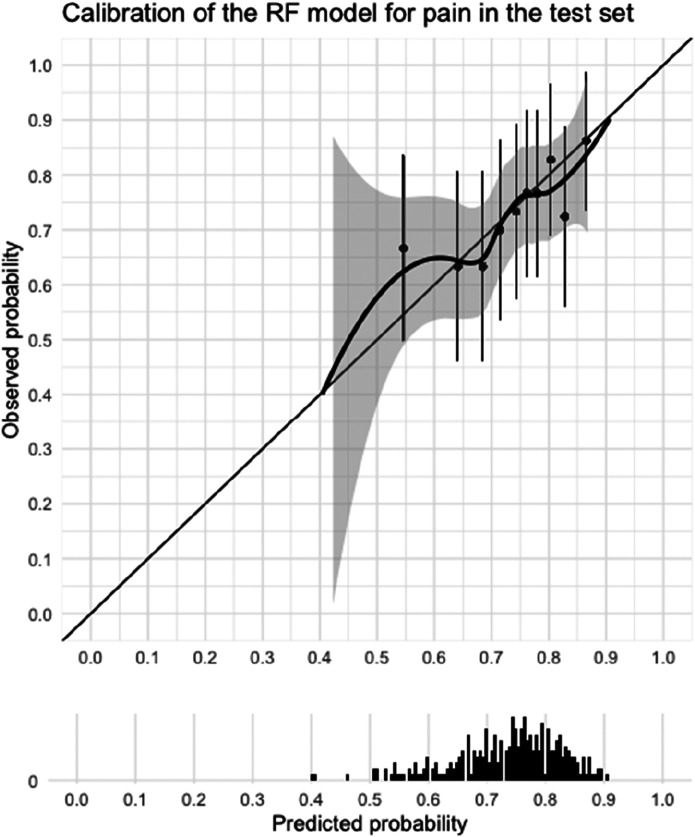
Methods: Between November 2011 and June 2020, 2653 patients were surgically treated for thumb carpometacarpal osteoarthritis. Patient-reported outcome measures were used to preoperatively assess pain, hand function, and satisfaction with hand function, as well as the general mental health of patients and mindset toward their condition. Patient characteristics, medical history, patient-reported symptom severity, and patient-reported mindset were considered as possible predictors. Patients who had incomplete Michigan Hand outcomes Questionnaires at baseline or 12 months postsurgery were excluded, as these scores were used to determine clinical improvement. The Michigan Hand outcomes Questionnaire provides subscores for pain and hand function. Scores range from 0 to 100, with higher scores indicating less pain and better hand function. An improvement of at least the minimum clinically important difference (MCID) of 14.4 for the pain score and 11.7 for the function score were considered "clinically relevant." These values were derived from previous reports that provided triangulated estimates of two anchor-based and one distribution-based MCID. Data collection resulted in a dataset of 1489 patients for the pain model and 1469 patients for the hand function model. The data were split into training (60%), validation (20%), and test (20%) dataset. The training dataset was used to select the predictive variables and to train our models. The performance of all models was evaluated in the validation dataset, after which one model was selected for further evaluation. Performance of this final model was evaluated on the test dataset. We trained the models using logistic regression, random forest, and gradient boosting machines and compared their performance. We chose these algorithms because of their relative simplicity, which makes them easier to implement and interpret. Model performance was assessed using discriminative ability and qualitative visual inspection of calibration curves. Discrimination was measured using area under the curve (AUC) and is a measure of how well the model can differentiate between the outcomes (improvement or no improvement), with an AUC of 0.5 being equal to chance. Calibration is a measure of the agreement between the predicted probabilities and the observed frequencies and was assessed by visual inspection of calibration curves. We selected the model with the most promising performance for clinical implementation (that is, good model performance and a low number of predictors) for further evaluation in the test dataset.
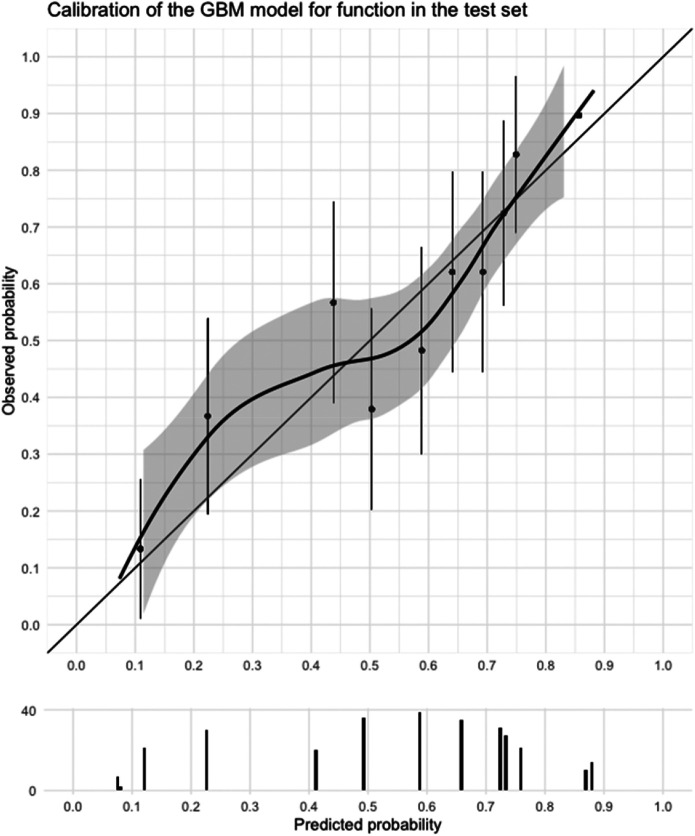
Results: For pain, the random forest model showed the most promising results based on discrimination, calibration, and number of predictors in the validation dataset. In the test dataset, this pain model had a poor AUC (0.59) and poor calibration. For function, the gradient boosting machine showed the most promising results in the validation dataset. This model had a good AUC (0.74) and good calibration in the test dataset. The baseline Michigan Hand outcomes Questionnaire hand function score was the only predictor in the model. For the hand function model, we made a web application that can be accessed via https://analyse.equipezorgbedrijven.nl/shiny/cmc1-prediction-model-Eng/.
Conclusion: We developed a promising model that may allow clinicians to predict the chance of functional improvement in an individual patient undergoing surgery for thumb carpometacarpal osteoarthritis, which would thereby help in the decision-making process. However, caution is warranted because our model has not been externally validated. Unfortunately, the performance of the prediction model for pain is insufficient for application in clinical practice.
Level of evidence: Level III, therapeutic study.
Copyright © 2022 by the Association of Bone and Joint Surgeons.
Conflict of interest statement
Each author certifies that there are no funding or commercial associations (consultancies, stock ownership, equity interest, patent/licensing arrangements, etc.) that might pose a conflict of interest in connection with the submitted article related to the author or any immediate family members. All ICMJE Conflict of Interest Forms for authors and Clinical Orthopaedics and Related Research® editors and board members are on file with the publication and can be viewed on request.
Figures
Comment in
-
CORR Insights®: Machine Learning Can be Used to Predict Function but Not Pain After Surgery for Thumb Carpometacarpal Osteoarthritis.Clin Orthop Relat Res. 2022 Jul 1;480(7):1285-1286. doi: 10.1097/CORR.0000000000002139. Epub 2022 Feb 4. Clin Orthop Relat Res. 2022. PMID: 35122682 Free PMC article. No abstract available.
-
Letter to the Editor: Machine Learning Can be Used to Predict Function but Not Pain After Surgery for Thumb Carpometacarpal Osteoarthritis.Clin Orthop Relat Res. 2022 Nov 1;480(11):2277. doi: 10.1097/CORR.0000000000002397. Epub 2022 Sep 13. Clin Orthop Relat Res. 2022. PMID: 36099409 Free PMC article. No abstract available.
References
-
- Auret L, Aldrich C. Interpretation of nonlinear relationships between process variables by use of random forests. Minerals Engineering. 2012;35:27-42.
-
- Baca ME, Rozental TD, McFarlane K, Hall MJ, Ostergaard PJ, Harper CM. Trapeziometacarpal joint arthritis: is duration of symptoms a predictor of surgical outcomes? J Hand Surg Am. 2020;45:1184.e1181-1184.e1187. - PubMed
-
- Baker RH, Al-Shukri J, Davis TR. Evidence-based medicine: thumb basal joint arthritis. Plast Reconstr Surg. 2017;139:256e-266e. - PubMed
-
- Bakri K, Moran SL. Thumb carpometacarpal arthritis. Plast Reconstr Surg. 2015;135:508-520. - PubMed
MeSH terms
LinkOut - more resources
Full Text Sources
Medical
Research Materials
