. 2022 Jan 18;12(1):938.
doi: 10.1038/s41598-021-04572-2.

Plasmodium falciparum genomic surveillance reveals spatial and temporal trends, association of genetic and physical distance, and household clustering

Affiliations

Plasmodium falciparum genomic surveillance reveals spatial and temporal trends, association of genetic and physical distance, and household clustering

Mouhamad Sy et al. Sci Rep. .

Abstract

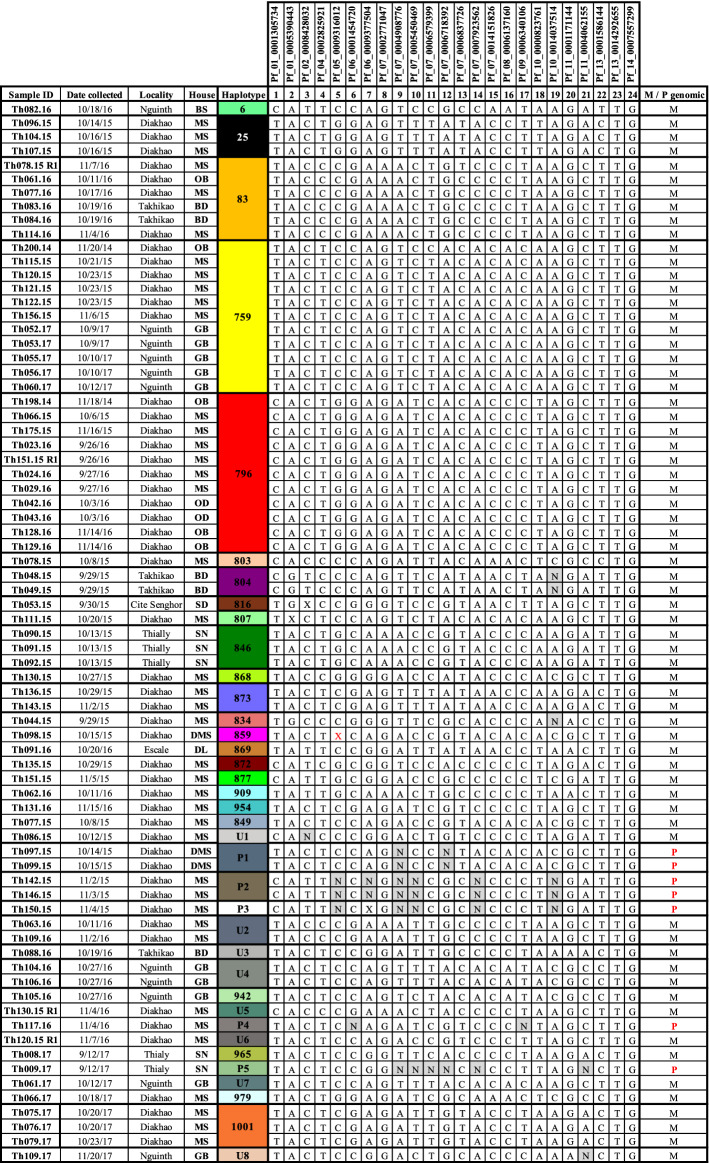
Molecular epidemiology using genomic data can help identify relationships between malaria parasite population structure, malaria transmission intensity, and ultimately help generate actionable data to assess the effectiveness of malaria control strategies. Genomic data, coupled with geographic information systems data, can further identify clusters or hotspots of malaria transmission, parasite genetic and spatial connectivity, and parasite movement by human or mosquito mobility over time and space. In this study, we performed longitudinal genomic surveillance in a cohort of 70 participants over four years from different neighborhoods and households in Thiès, Senegal-a region of exceptionally low malaria transmission (entomological inoculation rate less than 1). Genetic identity (identity by state, IBS) was established using a 24-single nucleotide polymorphism molecular barcode, identity by descent was calculated from whole genome sequence data, and a hierarchical Bayesian regression model was used to establish genetic and spatial relationships. Our results show clustering of genetically similar parasites within households and a decline in genetic similarity of parasites with increasing distance. One household showed extremely high diversity and warrants further investigation as to the source of these diverse genetic types. This study illustrates the utility of genomic data with traditional epidemiological approaches for surveillance and detection of trends and patterns in malaria transmission not only by neighborhood but also by household. This approach can be implemented regionally and countrywide to strengthen and support malaria control and elimination efforts.


Conflict of interest statement

The authors declare no competing interests.

Figures

Figure 1
Figure 1
Barcodes of Plasmodium falciparum isolates identified in the study cohort. Barcoded parasites from the n = 70 participants in the longitudinal cohort followed for 24 months. Patient ID (human) is shown along with date of sampling, Age, Neighborhood, Household (arbitrary alphabetical code), and barcode haplotype. SNP positions are indicated for the 24-SNP barcode. “N” indicates a position with two peaks—corresponding to both biallelic SNPs (mixed genotype), and an “X” indicates a reproducibly negative call. M/P genomic indicates monogenomic (M) or polygenomic (P) infections.
Figure 2
Figure 2
Heatmap illustrating parasite genetic barcode similarity. Sample IDs are listed on the vertical axis and barcodes are clustered by genetic similarity. Barcode haplotypes are color coded at the top of the heatmap and in the Key. Heatmap scale (right) shows the number of barcode SNP differences and range from identical (fewest differences; red) to greatest differences (blue). The maximal number of differences possible is 24.
Figure 3
Figure 3
Hotspots of malaria transmission by neighborhood and household. Map of sample locations by household (BD, BS, DL, DMS, GB, MS, OB, OD, SD and SN), and neighborhood (Cité Senghor, Diakhao, Escale, Nguinth, Thialy and Takhikao) from 2014 to 2017. Legend indicates and the parasite barcode haplotype ID and is color-coded by haplotype. The size of the circle is proportional to the number of samples in the haplotype, as indicated in the scale. Solid lines indicate delineation of the neighborhoods.
Figure 4
Figure 4
Barcodes of initial and re-infected participant samples. Patient ID (human) is shown along with date of sampling, Age, Neighborhood, Household (arbitrary alphabetical code), and barcode haplotype. SNP positions are indicated for the 24-SNP barcode. “N” indicates a position with two peaks—corresponding to both biallelic SNPs (mixed genotype), and an “X” indicates a reproducibly negative call. M/P genomic indicates monogenomic (M) or polygenomic (P) infections.
Figure 5
Figure 5
Identity by Descent reveals subtle differences among identical barcode samples separated in time. (A) Relationship between identical barcode parasites (measured by IBS) and IBD with time. Percent of whole genome relatedness by IBD, color-coded by barcode identity (IBS), identical or different. (B) Relationships between 17 specific identical barcode haplotypes by household, year, and IBD, determined from whole genome sequencing. Years are shown on the X axis. Colored circles represent individual parasites from haplotypes that are color coded according to barcode haplotype. Pie charts and percentages shown represent percent IBD relative to the pairwise comparison to the initial isolate, as defined temporally.

References

    1. World Malaria Report 2020: 20 years of global progress and challenges. Report, World Health Organization (2020).
    1. Fowkes FJ, Boeuf P, Beeson JG. Immunity to malaria in an era of declining malaria transmission. Parasitology. 2016;143:139–53. doi: 10.1017/S0031182015001249. - DOI - PubMed
    1. Nkumama IN, O’Meara WP, Osier FHA. Changes in malaria epidemiology in Africa and new challenges for elimination. Trends Parasitol. 2017;33:128–140. doi: 10.1016/j.pt.2016.11.006. - DOI - PMC - PubMed
    1. Cotter C, et al. The changing epidemiology of malaria elimination: New strategies for new challenges. Lancet. 2013;382:900–11. doi: 10.1016/S0140-6736(13)60310-4. - DOI - PMC - PubMed
    1. Stresman G, Bousema T, Cook J. Malaria hotspots: Is there epidemiological evidence for fine-scale spatial targeting of interventions? Trends Parasitol. 2019;35:822–834. doi: 10.1016/j.pt.2019.07.013. - DOI - PubMed

Publication types

MeSH terms