[Preprint]. 2022 Jan 10:2022.01.07.475453.
doi: 10.1101/2022.01.07.475453.

Mild respiratory SARS-CoV-2 infection can cause multi-lineage cellular dysregulation and myelin loss in the brain

Affiliations

Mild respiratory SARS-CoV-2 infection can cause multi-lineage cellular dysregulation and myelin loss in the brain

Anthony Fernández-Castañeda et al. bioRxiv. .

Abstract

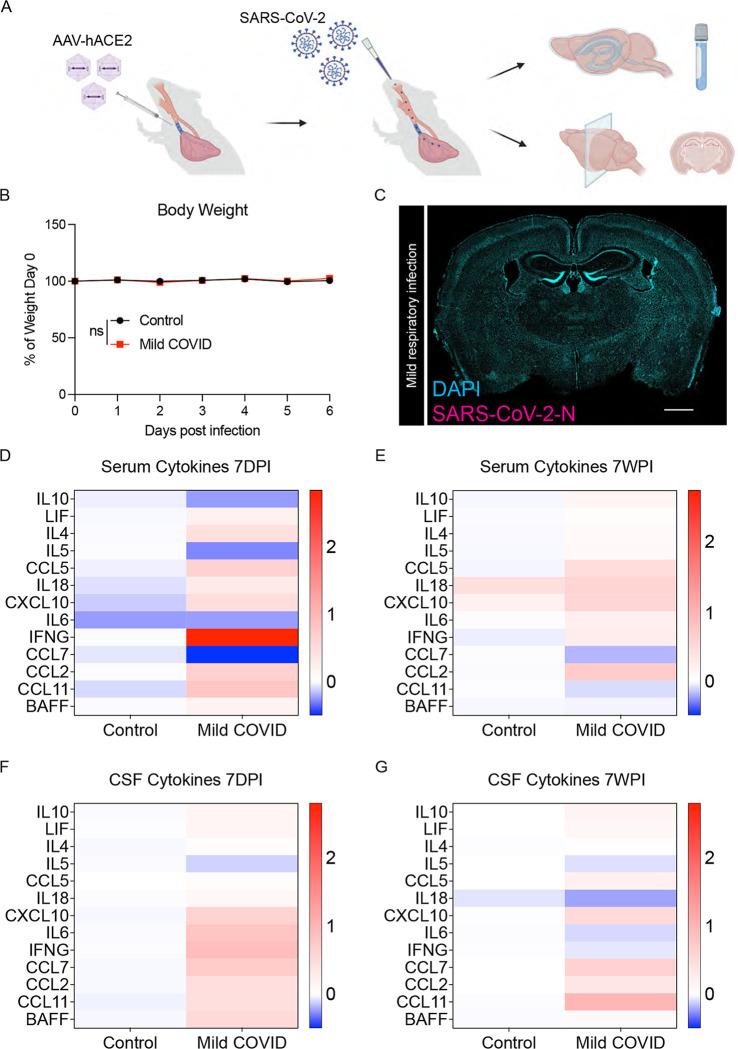
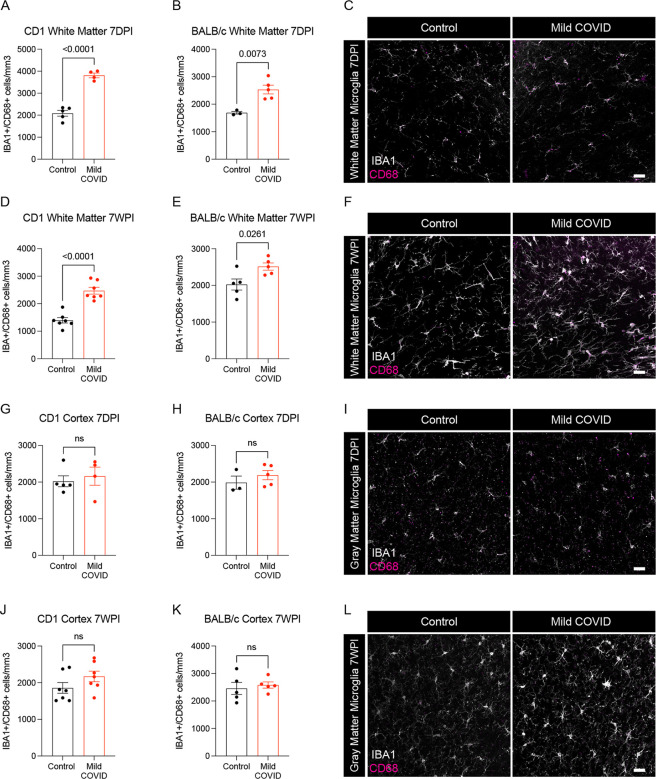
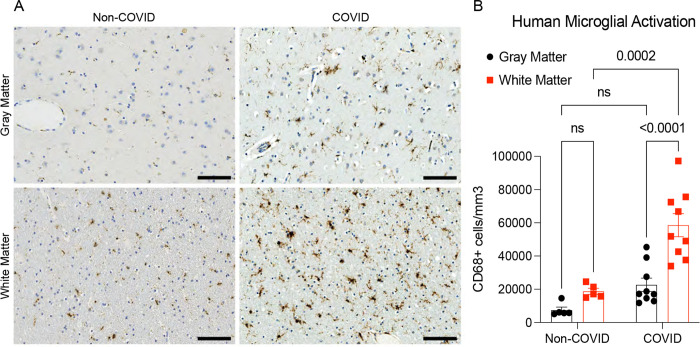
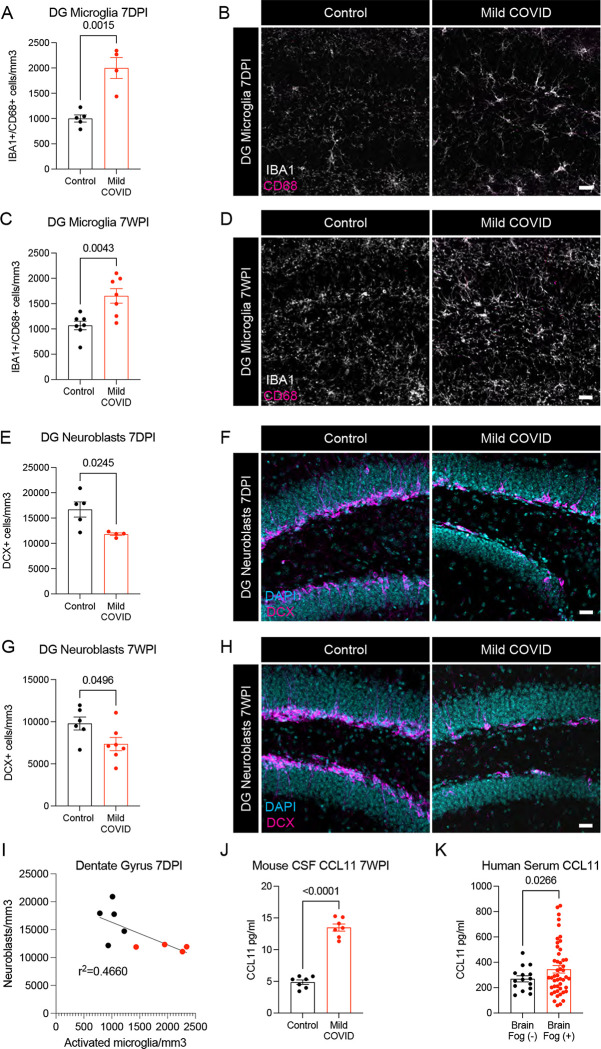
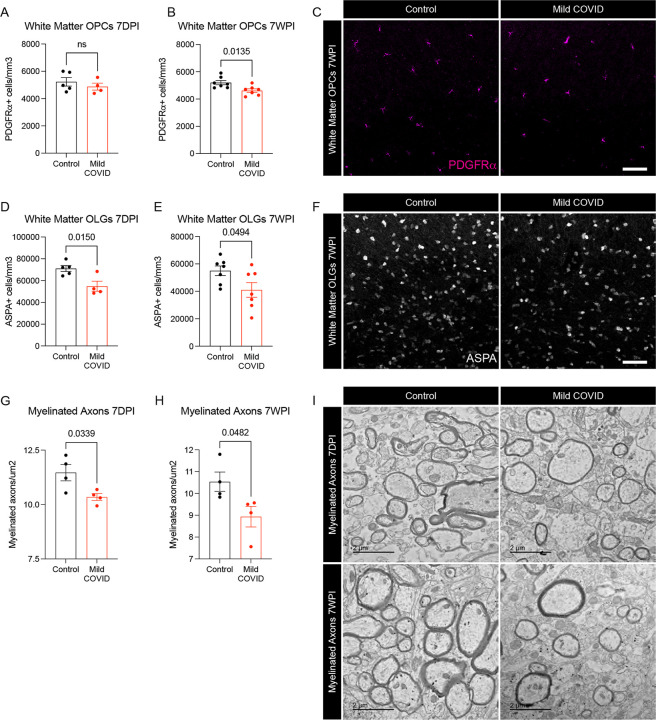
Survivors of Severe Acute Respiratory Syndrome Coronavirus-2 (SARS-CoV-2) infection frequently experience lingering neurological symptoms, including impairment in attention, concentration, speed of information processing and memory. This long-COVID cognitive syndrome shares many features with the syndrome of cancer therapy-related cognitive impairment (CRCI). Neuroinflammation, particularly microglial reactivity and consequent dysregulation of hippocampal neurogenesis and oligodendrocyte lineage cells, is central to CRCI. We hypothesized that similar cellular mechanisms may contribute to the persistent neurological symptoms associated with even mild SARS-CoV-2 respiratory infection. Here, we explored neuroinflammation caused by mild respiratory SARS-CoV-2 infection - without neuroinvasion - and effects on hippocampal neurogenesis and the oligodendroglial lineage. Using a mouse model of mild respiratory SARS-CoV-2 infection induced by intranasal SARS-CoV-2 delivery, we found white matter-selective microglial reactivity, a pattern observed in CRCI. Human brain tissue from 9 individuals with COVID-19 or SARS-CoV-2 infection exhibits the same pattern of prominent white matter-selective microglial reactivity. In mice, pro-inflammatory CSF cytokines/chemokines were elevated for at least 7-weeks post-infection; among the chemokines demonstrating persistent elevation is CCL11, which is associated with impairments in neurogenesis and cognitive function. Humans experiencing long-COVID with cognitive symptoms (48 subjects) similarly demonstrate elevated CCL11 levels compared to those with long-COVID who lack cognitive symptoms (15 subjects). Impaired hippocampal neurogenesis, decreased oligodendrocytes and myelin loss in subcortical white matter were evident at 1 week, and persisted until at least 7 weeks, following mild respiratory SARS-CoV-2 infection in mice. Taken together, the findings presented here illustrate striking similarities between neuropathophysiology after cancer therapy and after SARS-CoV-2 infection, and elucidate cellular deficits that may contribute to lasting neurological symptoms following even mild SARS-CoV-2 infection.

Keywords: COVID-19; cognitive impairment; hippocampal neurogenesis; long-COVID; microglia; myelin; neuroinflammation; oligodendrocytes.


Figures

Figure 1.
Figure 1.. Mouse model of mild respiratory SARS-CoV-2 infection
(A) Schematic of experimental paradigm for respiratory system-restricted SARS-CoV-2 infection in mice and experimental workflow, illustrating intratracheal AAV-hACE2 delivery, SARS-CoV-2 intranasal infection, CSF collection, and tissue processing for microscopy analysis. (B) Body weight (% of day 0 weight) of control and mild COVID mice. Data shown as mean +/− SEM; n=24 mice per group; ns p>0.05 by 2-way ANOVA with multiple comparisons. (C) Confocal micrograph of SARS-CoV-2 nucleocapsid protein (SARS-CoV-2-N) 7-days post-infection (7DPI). SARS-CoV-2-N, magenta; DAPI, cyan. Scale bar = 1mm. (D and E) Cytokine analyses of serum in control and mild COVID mice 7-days post-infection (D) and 7-weeks post-infection (7WPI) (E). Data shown as mean log2(fold change mean fluorescence intensity) normalized to control group; n=7 CD1 mice per group. (F and G) Cytokine analysis of CSF in control and mild COVID mice 7-days post-infection (F) and 7-weeks post-infection (G). Data shown as mean log2(fold change mean fluorescence intensity) normalized to control group; n=7 CD1 mice per group.
Figure 2.
Figure 2.. White matter microglial activation after mild respiratory SARS-CoV-2 infection
(A and B) Activated microglia (IBA1+ CD68+) quantification 7-days post-infection in the cingulum of the corpus callosum of CD1 (A) and BALB/c (B) mice. n=5 mice per CD1 control group; n=4 mice per CD1 mild COVID group; n=3 mice per BALB/c control group; n=5 mice per BALB/c mild COVID group. (C) Representative confocal micrographs of activated microglia (IBA1, white; CD68, magenta) in the cingulum of the corpus callosum of BALB/c mice 7-days post-infection. (D and E) Activated microglia (IBA1+ CD68+) quantification 7-weeks post-infection in the cingulum of the corpus callosum of CD1 (D) and BALB/c (E) mice. n=7 mice per CD1 control group; n=7 mice per CD1 mild COVID group; n=5 mice per BALB/c control group; n=5 mice per BALB/c mild COVID group. (F) Representative confocal micrographs of activated microglia (IBA1, white; CD68, magenta) in the cingulum of the corpus callosum of BALB/c mice 7-weeks post-infection. (G and H) Activated microglia (IBA1+ CD68+) quantification 7-days post-infection in the cortical gray matter of CD1 (G) and BALB/c (H) mice. n=5 mice per CD1 control group; n=4 mice per CD1 mild COVID group; n=3 mice per BALB/c control group; n=5 mice per BALB/c mild COVID group. (I) Representative confocal micrographs of activated microglia (IBA1, white; CD68, magenta) in the cortical gray matter of BALB/c mice 7-days post-infection. (J and K) Activated microglia quantification (IBA1+ CD68+) 7-weeks post-infection in the cortical gray matter of CD1 (J) and BALB/c (K) mice. n=7 mice per CD1 control group; n=7 mice per CD1 mild COVID group; n=5 mice per BALB/c control group; n=5 mice per BALB/c mild COVID group. (L) Representative confocal micrographs of activated microglia (IBA1, white; CD68, magenta) in the cortical gray matter of BALB/c mice 7-weeks post-infection. Data shown as mean +/− SEM; each dot represents an individual mouse; P values shown on figure panels; ns p>0.05 by two-tailed, unpaired t-test. Scale bars 50μm.
Figure 3.
Figure 3.. Microglial reactivity in human white matter after SARS-CoV-2 infection
(A) Representative micrographs of CD68 immunostaining (brown) in the gray (cerebral cortex) or subcortical white matter of human subjects with COVID or in non-COVID control subjects. (B) Activated microglia (CD68+ cells) quantification. n=5 for non-COVID control group, n=9 for COVID group. Data shown as mean +/− SEM; ns p>0.05 by 2-way ANOVA with multiple comparisons; each dot represents a human subject. Scale bars 100μm.
Figure 4.
Figure 4.. Decreased hippocampal neurogenesis after mild respiratory SARS-CoV-2 infection
(A) Activated microglia (IBA1+ CD68+) quantification 7-days post-infection in the dentate gyrus of CD1 mice. n=5 mice per control group; n=4 mice per mild COVID group. (B) Representative confocal micrographs of activated microglia (IBA1, white; CD68, magenta) in the dentate gyrus of CD1 mice 7-days post-infection. (C) Activated microglia (IBA1+ CD68+) quantification 7-weeks post-infection in the dentate gyrus of CD1 mice. n=7 mice per control group; n=7 mice per mild COVID group. (D) Representative confocal micrographs of activated microglia (IBA1, white; CD68, magenta) in the dentate gyrus of CD1 mice 7-weeks post-infection. (E) Neuroblast (DCX+) quantification 7-days post-infection in the dentate gyrus of CD1 mice. n=5 mice per control group; n=4 mice per mild COVID group. (F) Representative confocal micrographs of neuroblasts (DCX, magenta; DAPI, cyan) in the dentate gyrus of CD1 mice 7-days post-infection. (G) Neuroblast (DCX+) quantification 7-weeks post-infection in the dentate gyrus of CD1 mice. n=6 mice per control group; n=7 mice per mild COVID group. (H) Representative confocal micrographs of neuroblasts (DCX, magenta; DAPI, cyan) in the dentate gyrus of CD1 mice 7-weeks post-infection. (I) Correlation between neuroblasts (DCX+) and activated microglia (IBA1+ CD68+) in the dentate gyrus of CD1 mice 7-days post-infection. Line fitted with simple linear regression. n=5 mice per control group; n=4 mice per mild COVID group. (J) CCL11 levels in CSF of CD1 mice 7-weeks post-infection. n=7 mice per group. (K) Serum levels of CCL11 in people experiencing long-COVID with and without cognitive symptoms. n = 15 human subjects with long-COVID without cognitive symptoms (brain fog (−)), n = 48 human subjects with long-COVID with cognitive symptoms (brain fog (+)). Data shown as mean +/− SEM; each dot represents an individual mouse (A-J) or one human subject (K). A,C,E,G,J,K unpaired two-tailed t-test. P values shown on figure panels. Scale bars 50μm. DG: Dentate gyrus.
Figure 5.
Figure 5.. Oligodendrocyte and myelin loss after mild respiratory SARS-CoV-2 infection
(A and B) Oligodendrocyte precursor cell (PDGFRa+) quantification in the cingulum of the corpus callosum of CD1 mice 7-days (A) and 7-weeks (B) post-infection. n=5 mice per control group and n=4 mice per mild COVID group in (A). n=7 mice per group in (B). (C) Representative confocal micrographs of oligodendrocyte precursor cells (PDGFRa, magenta) in the cingulum of the corpus callosum of CD1 mice 7-weeks post-infection. Scale bar 50μm. (D and E) Oligodendrocyte (ASPA+) quantification in the cingulum of the corpus callosum of CD1 mice 7-days post-infection (D) and 7-weeks post-infection (E). n=5 mice per control group and n=4 mice per mild COVID group in (D). n=7 mice per group in (E). (F) Representative confocal micrographs of oligodendrocytes (ASPA, white) in the cingulum of the corpus callosum of CD1 mice 7-weeks post-infection. Scale bar 50μm (G and H) Quantification of myelinated axons in the cingulum of the corpus callosum of CD1 mice 7-days post-infection (G) and 7-weeks post-infection (H). n=4 mice per group. (I) Representative transmission electron microscopy (EM) images at the level of the cingulum of the corpus callosum in cross-section. Myelinated axons evident as electron-dense myelin sheaths encircling axons, vewed in cross-section. Scale bars 2μm. Data shown as mean +/− SEM; each dot represents an individual mouse; A,B,D,E,G,H, unpaired, two-tailed t-test. P values shown on figure panels. OPCs: Oligodendrocyte precursor cells. OLGs: Oligodendrocytes.

References

    1. Acharya M.M., Green K.N., Allen B.D., Najafi A.R., Syage A., Minasyan H., Le M.T., Kawashita T., Giedzinski E., Parihar V.K., et al. (2016). Elimination of microglia improves cognitive function following cranial irradiation. Sci Rep 6, 31545. - PMC - PubMed
    1. Ayoub R., Ruddy R.M., Cox E., Oyefiade A., Derkach D., Laughlin S., Ades-Aron B., Shirzadi Z., Fieremans E., MacIntosh B.J., et al. (2020). Assessment of cognitive and neural recovery in survivors of pediatric brain tumors in a pilot clinical trial using metformin. Nat Med 26, 1285–1294. - PMC - PubMed
    1. Becker J.H., Lin J.J., Doernberg M., Stone K., Navis A., Festa J.R., and Wisnivesky J.P. (2021). Assessment of Cognitive Function in Patients After COVID-19 Infection. JAMA Netw Open 4, e2130645. - PMC - PubMed
    1. Clelland C.D., Choi M., Romberg C., Clemenson G.D. Jr., Fragniere A., Tyers P., Jessberger S., Saksida L.M., Barker R.A., Gage F.H., et al. (2009). A functional role for adult hippocampal neurogenesis in spatial pattern separation. Science 325, 210–213. - PMC - PubMed
    1. Davis H.E., Assaf G.S., McCorkell L., Wei H., Low R.J., Re’em Y., Redfield S., Austin J.P., and Akrami A. (2021). Characterizing long COVID in an international cohort: 7 months of symptoms and their impact. EClinicalMedicine 38, 101019. - PMC - PubMed

Publication types