

The precautionary principle and dietary DNA metabarcoding: Commonly used abundance thresholds change ecological interpretation
- PMID: 35043486
- PMCID: PMC9303378
- DOI: 10.1111/mec.16352
The precautionary principle and dietary DNA metabarcoding: Commonly used abundance thresholds change ecological interpretation
Abstract
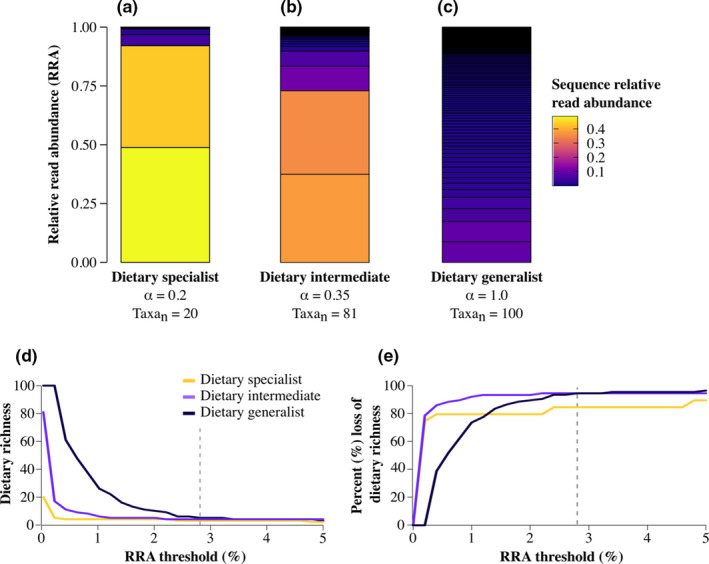
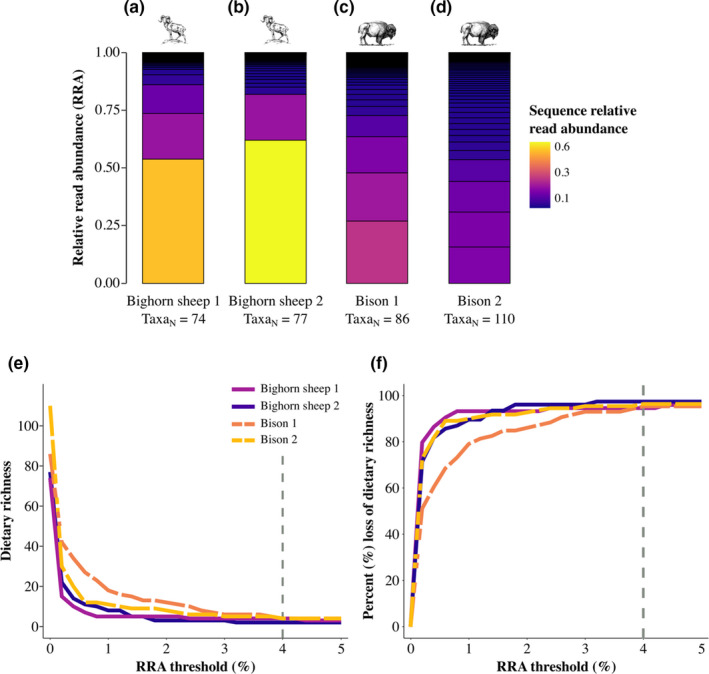
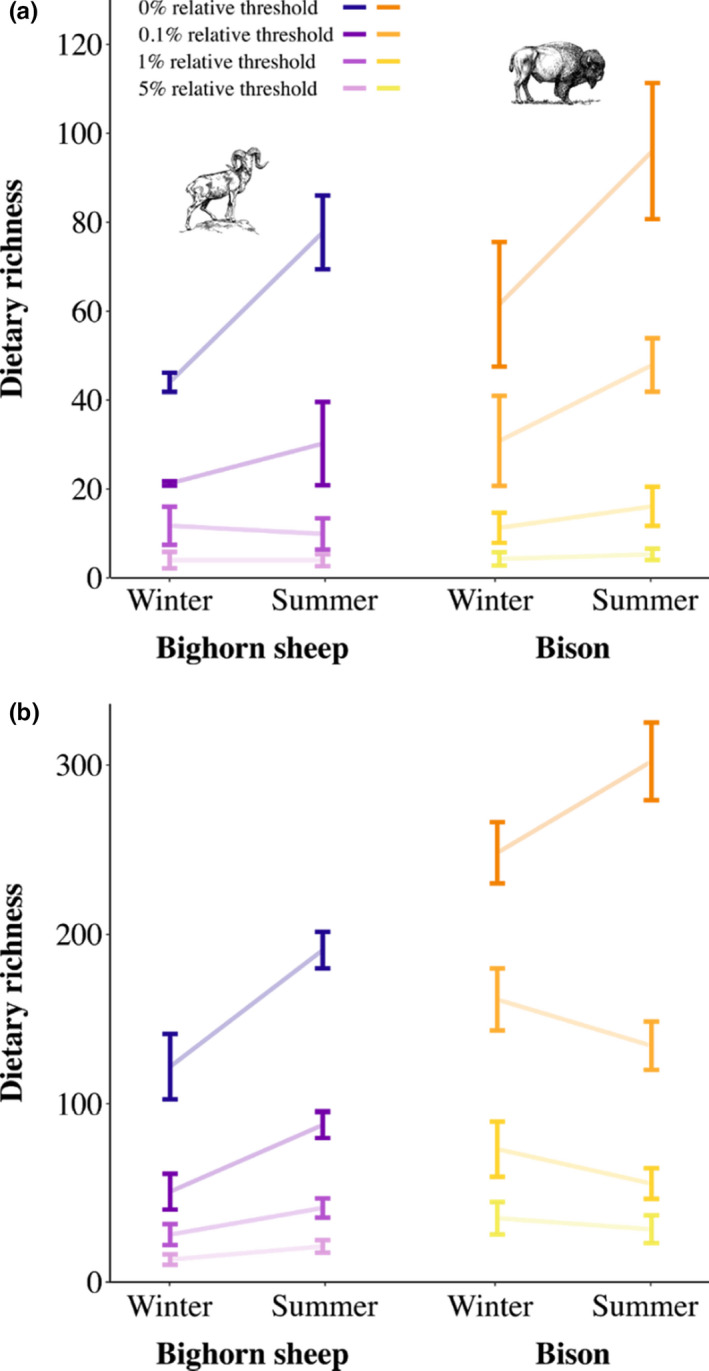
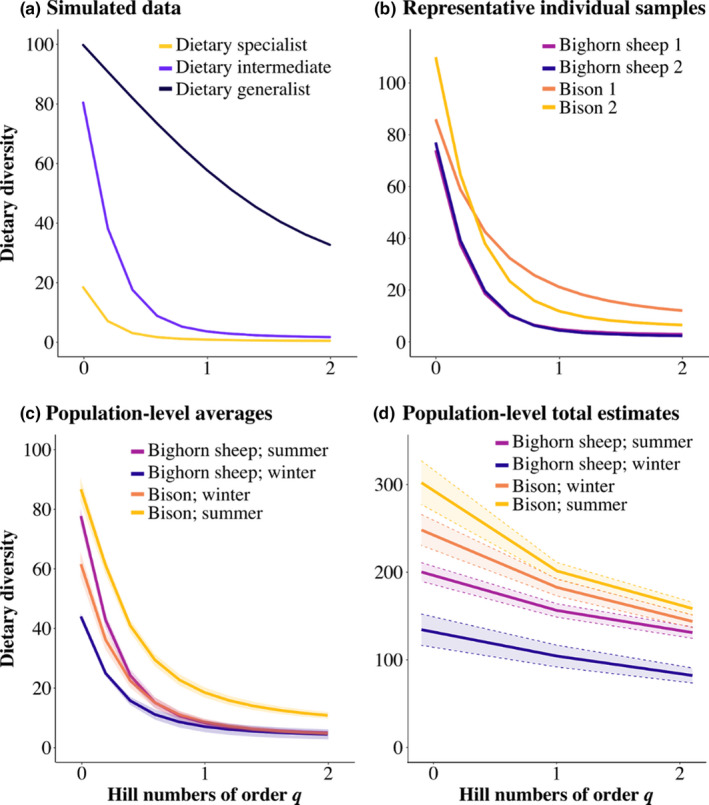
Dietary DNA metabarcoding enables researchers to identify and characterize trophic interactions with a high degree of taxonomic precision. It is also sensitive to sources of bias and contamination in the field and laboratory. One of the earliest and most common strategies for dealing with such sensitivities has been to remove all low-abundance sequences and conduct ecological analyses based on the presence or absence of food taxa. Although this step is now often perceived to be necessary, evidence of its sufficiency is lacking and more attention to the risk of introducing other errors is needed. Using computer simulations, we demonstrate that common strategies to remove low-abundance sequences can erroneously eliminate true dietary sequences in ways that impact downstream inferences. Using real data from well-studied wildlife populations in Yellowstone National Park, we further show how these strategies can markedly alter the composition of dietary profiles in ways that scale-up to obscure ecological interpretations about dietary generalism, specialism, and composition. Although the practice of removing low-abundance sequences may continue to be a useful strategy to address research questions that focus on a subset of relatively abundant foods, its continued widespread use risks generating misleading perceptions about the structure of trophic networks. Researchers working with dietary DNA metabarcoding data-or similar data such as environmental DNA, microbiomes, or pathobiomes-should be aware of drawbacks and consider alternative bioinformatic, experimental, and statistical solutions.
Keywords: Hill numbers; bighorn sheep; bison; frequency of occurrence; grazer-browser continuum; herbivore; microhistology; relative read abundance.
© 2022 The Authors. Molecular Ecology published by John Wiley & Sons Ltd.
Conflict of interest statement
Authors declare that there are no conflicts of interest.
Figures
Comment in
-
The complex epistemological challenge of data curation in dietary metabarcoding: Comment on "The precautionary principle and dietary DNA metabarcoding: Commonly used abundance thresholds change ecological interpretation" by Littleford-Colquhoun et al. (2022).Mol Ecol. 2022 Nov;31(22):5653-5659. doi: 10.1111/mec.16576. Epub 2022 Jul 2. Mol Ecol. 2022. PMID: 35778947
-
Evidence-based strategies to navigate complexity in dietary DNA metabarcoding: A reply.Mol Ecol. 2022 Nov;31(22):5660-5665. doi: 10.1111/mec.16712. Epub 2022 Oct 20. Mol Ecol. 2022. PMID: 36263899
References
-
- Ait Baamrane, M. A. , Shehzad, W. , Ouhammou, A. , Abbad, A. , Naimi, M. , Coissac, E. , Taberlet, P. , & Znari, M. (2012). Assessment of the food habits of the Moroccan dorcas gazelle in M’Sabih Talaa, west central Morocco, using the trnL approach. PLoS One, 7(4), e35643. 10.1371/journal.pone.0035643 - DOI - PMC - PubMed
-
- Alberdi, A. , Aizpurua, O. , Gilbert, M. T. P. , & Bohmann, K. (2018). Scrutinizing key steps for reliable metabarcoding of environmental samples. Methods in Ecology and Evolution, 9(1), 134–147. 10.1111/2041-210X.12849 - DOI
-
- Ando, H. , Mukai, H. , Komura, T. , Dewi, T. , Ando, M. , & Isagi, Y. (2020). Methodological trends and perspectives of animal dietary studies by noninvasive fecal DNA metabarcoding. Environmental DNA, 2(4), 391–406. 10.1002/edn3.117 - DOI
Publication types
MeSH terms
Substances
Grants and funding
LinkOut - more resources
Full Text Sources
