

Performance of Three Tests for SARS-CoV-2 on a University Campus Estimated Jointly with Bayesian Latent Class Modeling
- PMID: 35044220
- PMCID: PMC8768831
- DOI: 10.1128/spectrum.01220-21
Performance of Three Tests for SARS-CoV-2 on a University Campus Estimated Jointly with Bayesian Latent Class Modeling
Abstract
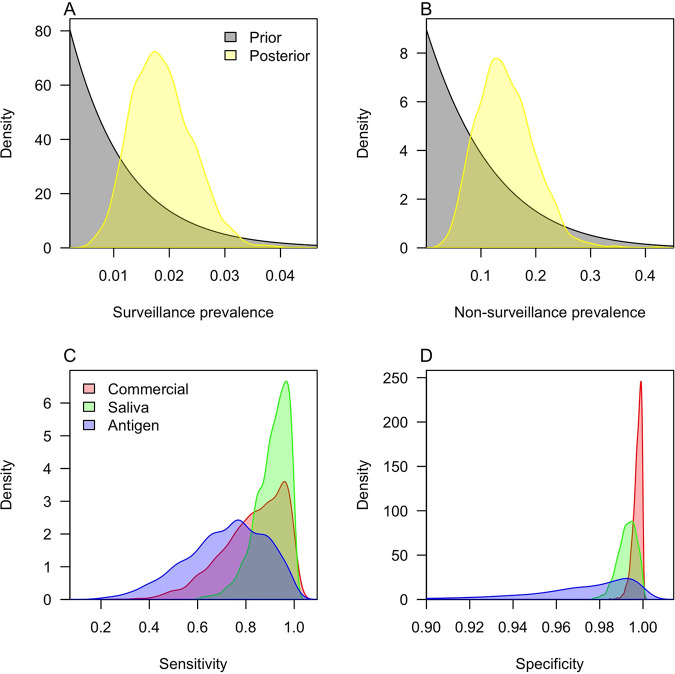
Accurate tests for severe acute respiratory syndrome coronavirus 2 (SARS-CoV-2) have been critical in efforts to control its spread. The accuracy of tests for SARS-CoV-2 has been assessed numerous times, usually in reference to a gold standard diagnosis. One major disadvantage of that approach is the possibility of error due to inaccuracy of the gold standard, which is especially problematic for evaluating testing in a real-world surveillance context. We used an alternative approach known as Bayesian latent class modeling (BLCM), which circumvents the need to designate a gold standard by simultaneously estimating the accuracy of multiple tests. We applied this technique to a collection of 1,716 tests of three types applied to 853 individuals on a university campus during a 1-week period in October 2020. We found that reverse transcriptase PCR (RT-PCR) testing of saliva samples performed at a campus facility had higher sensitivity (median, 92.3%; 95% credible interval [CrI], 73.2 to 99.6%) than RT-PCR testing of nasal samples performed at a commercial facility (median, 85.9%; 95% CrI, 54.7 to 99.4%). The reverse was true for specificity, although the specificity of saliva testing was still very high (median, 99.3%; 95% CrI, 98.3 to 99.9%). An antigen test was less sensitive and specific than both of the RT-PCR tests, although the sample sizes with this test were small and the statistical uncertainty was high. These results suggest that RT-PCR testing of saliva samples at a campus facility can be an effective basis for surveillance screening to prevent SARS-CoV-2 transmission in a university setting. IMPORTANCE Testing for severe acute respiratory syndrome coronavirus 2 (SARS-CoV-2) has been vitally important during the COVID-19 pandemic. There are a variety of methods for testing for this virus, and it is important to understand their accuracy in choosing which one might be best suited for a given application. To estimate the accuracy of three different testing methods, we used a data set collected at a university that involved testing the same samples with multiple tests. Unlike most other estimates of test accuracy, we did not assume that one test was perfect but instead allowed for some degree of inaccuracy in all testing methods. We found that molecular tests performed on saliva samples at a university facility were similarly accurate as molecular tests performed on nasal samples at a commercial facility. An antigen test appeared somewhat less accurate than the molecular tests, but there was high uncertainty about that.
Keywords: Bayesian statistics; COVID-19; RT-PCR; SARS-CoV-2; epidemiology; molecular diagnostic; public health surveillance.
Conflict of interest statement
The authors declare no conflict of interest.
Figures

Similar articles
-
Effectiveness and cost-effectiveness of four different strategies for SARS-CoV-2 surveillance in the general population (CoV-Surv Study): a structured summary of a study protocol for a cluster-randomised, two-factorial controlled trial.Trials. 2021 Jan 8;22(1):39. doi: 10.1186/s13063-020-04982-z. Trials. 2021. PMID: 33419461 Free PMC article.
-
Estimates of sensitivity and specificity of serological tests for SARS-CoV-2 specific antibodies using a Bayesian latent class model approach.J Clin Epidemiol. 2024 Apr;168:111267. doi: 10.1016/j.jclinepi.2024.111267. Epub 2024 Feb 1. J Clin Epidemiol. 2024. PMID: 38307216
-
Routine, Cost-Effective SARS-CoV-2 Surveillance Testing Using Pooled Saliva Limits Viral Spread on a Residential College Campus.Microbiol Spectr. 2021 Oct 31;9(2):e0108921. doi: 10.1128/Spectrum.01089-21. Epub 2021 Oct 13. Microbiol Spectr. 2021. PMID: 34643445 Free PMC article.
-
Comparison of diagnostic accuracy of rapid antigen tests for COVID-19 compared to the viral genetic test in adults: a systematic review and meta-analysis.JBI Evid Synth. 2024 Oct 1;22(10):1939-2002. doi: 10.11124/JBIES-23-00291. JBI Evid Synth. 2024. PMID: 39188132 Free PMC article.
-
Diagnostic performance of different sampling approaches for SARS-CoV-2 RT-PCR testing: a systematic review and meta-analysis.Lancet Infect Dis. 2021 Sep;21(9):1233-1245. doi: 10.1016/S1473-3099(21)00146-8. Epub 2021 Apr 12. Lancet Infect Dis. 2021. PMID: 33857405 Free PMC article.
Cited by
-
Determination of the Diagnostic Performance of Laboratory Tests in the Absence of a Perfect Reference Standard: The Case of SARS-CoV-2 Tests.Diagnostics (Basel). 2023 Sep 9;13(18):2892. doi: 10.3390/diagnostics13182892. Diagnostics (Basel). 2023. PMID: 37761259 Free PMC article.
-
A Qualitative Evaluation of the Barriers and Enablers for Implementation of an Asymptomatic SARS-CoV-2 Testing Service at the University of Nottingham: A Multi-Site Higher Education Setting in England.Int J Environ Res Public Health. 2022 Oct 12;19(20):13140. doi: 10.3390/ijerph192013140. Int J Environ Res Public Health. 2022. PMID: 36293719 Free PMC article.
-
Inferring SARS-CoV-2 RNA shedding into wastewater relative to the time of infection.Epidemiol Infect. 2022 Jan 7;150:e21. doi: 10.1017/S0950268821002752. Epidemiol Infect. 2022. PMID: 35068403 Free PMC article.
-
The effect of sample site and collection procedure on identification of SARS-CoV-2 infection.Cochrane Database Syst Rev. 2024 Dec 16;12(12):CD014780. doi: 10.1002/14651858.CD014780. Cochrane Database Syst Rev. 2024. PMID: 39679851 Free PMC article.
-
Prioritizing interventions for preventing COVID-19 outbreaks in military basic training.PLoS Comput Biol. 2022 Oct 7;18(10):e1010489. doi: 10.1371/journal.pcbi.1010489. eCollection 2022 Oct. PLoS Comput Biol. 2022. PMID: 36206315 Free PMC article.
References
-
- Aleta A, Martín-Corral D, Pastore y Piontti A, Ajelli M, Litvinova M, Chinazzi M, Dean NE, Halloran ME, Longini IM, Jr, Merler S, Pentland A, Vespignani A, Moro E, Moreno Y. 2020. Modelling the impact of testing, contact tracing and household quarantine on second waves of COVID-19. Nat Hum Behav 4:964–971. doi:10.1038/s41562-020-0931-9. - DOI - PMC - PubMed
-
- Evans S, Agnew E, Vynnycky E, Stimson J, Bhattacharya A, Rooney C, Warne B, Robotham J. 2021. The impact of testing and infection prevention and control strategies on within-hospital transmission dynamics of COVID-19 in English hospitals. Philos Trans R Soc Lond B Biol Sci 376:20200268. doi:10.1098/rstb.2020.0268. - DOI - PMC - PubMed
Publication types
MeSH terms
Substances
LinkOut - more resources
Full Text Sources
Medical
Miscellaneous
