. 2022 Jan 21;8(3):eabl9124.
doi: 10.1126/sciadv.abl9124. Epub 2022 Jan 19.

How is a turbidite actually deposited?

Affiliations

How is a turbidite actually deposited?

Zhiyuan Ge et al. Sci Adv. .

Abstract

The deposition of a classic turbidite by a surge-type turbidity current, as envisaged by conceptual models, is widely considered a discrete event of continuous sediment accumulation at a falling rate by the gradually waning density flow. Here, we demonstrate, on the basis of a high-resolution advanced numerical CFD (computational fluid dynamics) simulation and rock-record examples, that the depositional event in reality involves many brief episodes of nondeposition. The reason is inherent hydraulic fluctuations of turbidity current energy driven by interfacial Kelvin-Helmholtz waves. The experimental turbidity current, with realistic grain-size composition of a natural turbidite, used only 26 to 33% of its in-place flow time for deposition, while the remaining time went to the numerous episodes of sediment bypass and transient erosion. The general stratigraphic notion of a gross incompleteness of sedimentary record may then extend down to the deposition time scale of a single turbidite.


Figures

Fig. 1.
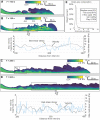
Fig. 1.. Longitudinal section snapshot of the turbidity current showing interfacial K-H waves and related bedload fluctuations.
For location, see Fig. 2C.
Fig. 2.
Fig. 2.. Grain-size composition and axial longitudinal display of the experimental flow.
(A) Flow volumetric sediment concentration at 150 s after release from the gate. (B) Flow velocity magnitude at 150 s; the inset diagram shows in-place fluctuations of flow velocity magnitude and bed shear stress. (C) Flow volumetric sediment concentration at 250 s after release. (D) Flow volumetric sediment concentration at 500 s after release; the inset diagram shows in-place fluctuations of flow velocity magnitude and bed shear stress. Flow velocity magnitude is a geometric mean of three-dimensional velocity components and a measure of the flow in-place kinetic energy. Note in the inset diagrams that the bed shear-stress maxima follow closely the peaks of flow velocity magnitude. (E) Flow sediment load based on the grain-size composition of a typical turbidite from the Mount Messenger Formation, New Zealand (53).
Fig. 3.
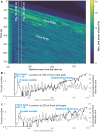
Fig. 3.. Time-series plots showing flow energy fluctuations along the axial longitudinal section of the experimental turbidity current.
(A) Bed shear stress fluctuations of the flow head and body. (B) In-place fluctuations of the flow Froude number at location 190 m from inlet gate. (C) In-place fluctuations of the flow Froude number at location 220 m from inlet gate.
Fig. 4.
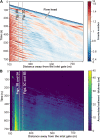
Fig. 4.. Time-series plots of Froude number and sediment thickness along the axial longitudinal section of the flow.
(A) The Froude number changes through time over the distance of 100 to 800 m out of the inlet. Note that the legend scale is optimized for visualization. (B) The accumulated sediment thickness changes through time over the same distance. Note the locations of Figs. 3 (B and C) and 5 (A and B) in the plots.
Fig. 5.
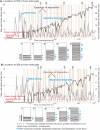
Fig. 5.. Time-series plots of bottom shear stress and sediment accumulation thickness along the axial longitudinal section of the flow.
(A) The in-place bottom shear stress and accumulated sediment thickness at location 190 m from the flow release gate. (B) The in-place bottom shear stress and accumulated sediment thickness at location 220 m from the gate. The rising segments of the thickness plot (highlighted in light brown) indicate episodic deposition; the plot flat segments indicate sediment bypass and the falling segments indicate intermittent erosion. In the bottom shear-stress threshold for rippled and plane-bed transport (37), the stability field of unborn dunes is disregarded, and similarly ignored is the stability field for antidunes, as explained in the main text. Diagrams 1 to 5 are time snapshots of the effective vertical accretion of turbidite. Times of each diagram are shown along the top of the time-series graphs. The episodes of erosion were verified by monitoring the flow Froude number (Figs. 3, B and C , and 4A). For quantitative summary, see the main text.
Fig. 6.
Fig. 6.. Rock-record examples of surge-type thick turbidites showing bulk normal grading (upward fining) and evidence of flow fluctuations.
The examples are from (A to C) the Miocene Mount Messenger Formation, Taranaki Basin, New Zealand, and (D) the early Eocene Mount Jaizkibel Formation, North Pyrenean Foreland Basin, Spain. In the photographs, the white letter symbols at the right-hand margin refer to the Bouma turbidite divisions (16); the white arrows at the left-hand margin point to subtle and more distinct discontinuities, indicating flow in-place energy fluctuations. The elongate vertical triangles to the left indicate bulk upward fining of the sediment.

References

    1. Dżułyński S., Książkiewicz M., Kuenen P. H., Turbidites in flysch of the Polish Carpathian Mountains. Geol. Soc. Am. Bull. 70, 1089–1118 (1959).
    1. Sestini G., Flysch facies and turbidite sedimentology. Sediment. Geol. 4, 559–597 (1970).
    1. Normark W. R., Posamentier H., Mutti E., Turbidite systems: State of the art and future directions. Rev. Geophys. 31, 91–116 (1993).
    1. Talling P. J., Masson D. G., Sumner E. J., Malgesini G., Subaqueous sediment density flows: Depositional processes and deposit types. Sedimentology 59, 1937–2003 (2012).
    1. Jobe Z. R., Howes N., Romans B. W., Covault J. A., Volume and recurrence of submarine-fan-building turbidity currents. Depos. Rec. 4, 160–176 (2018).