. 2022 Jan 21;8(3):eabg6711.
doi: 10.1126/sciadv.abg6711. Epub 2022 Jan 19.

A comprehensive long-read isoform analysis platform and sequencing resource for breast cancer

Affiliations

A comprehensive long-read isoform analysis platform and sequencing resource for breast cancer

Diogo F T Veiga et al. Sci Adv. .

Abstract

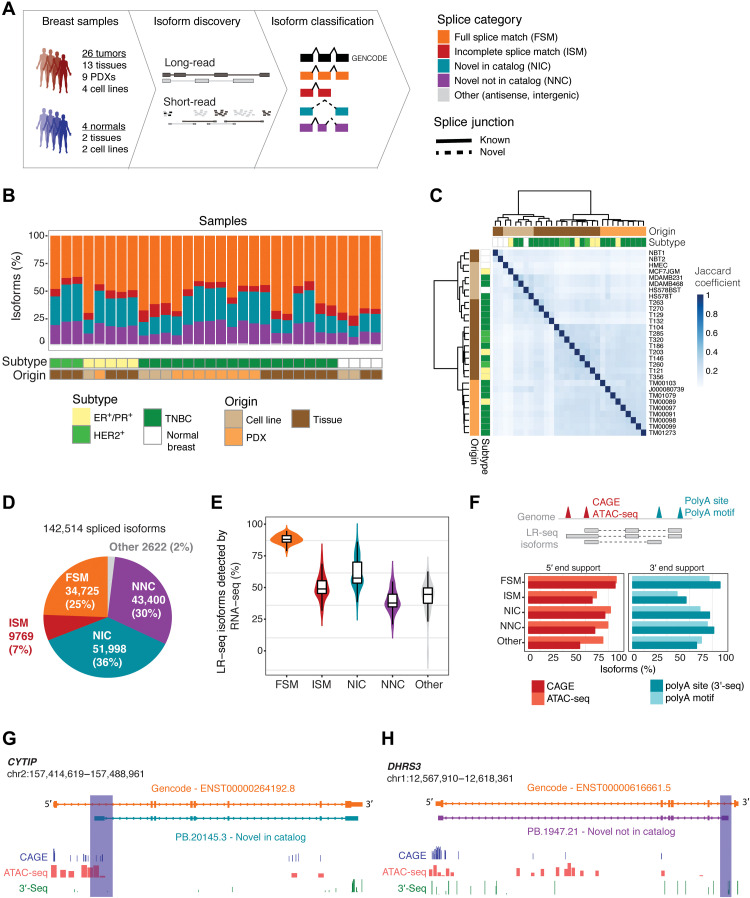
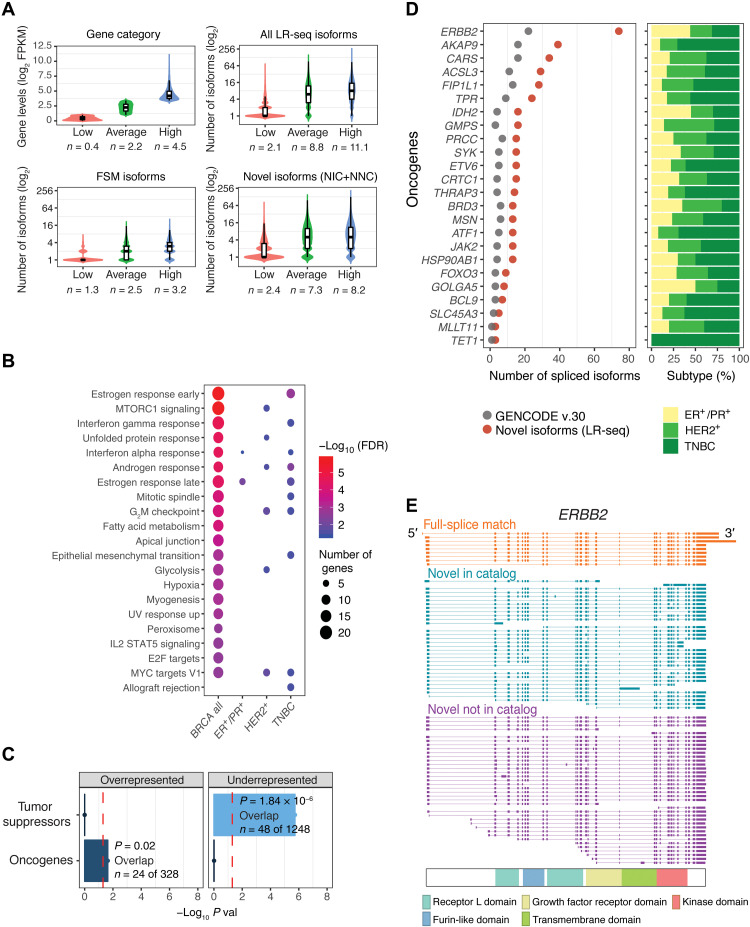
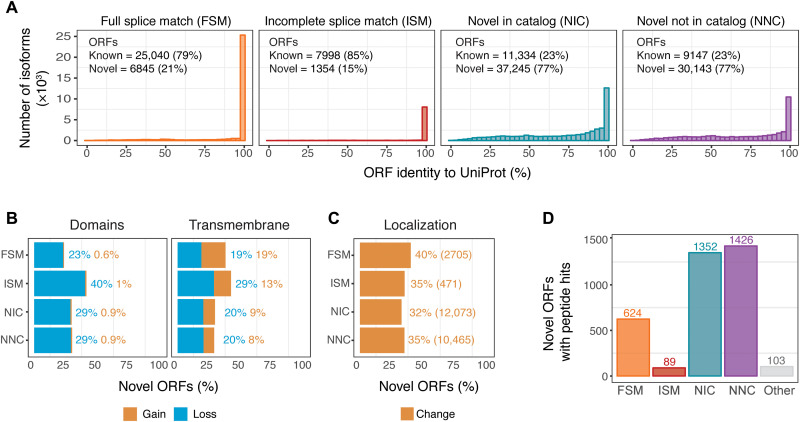
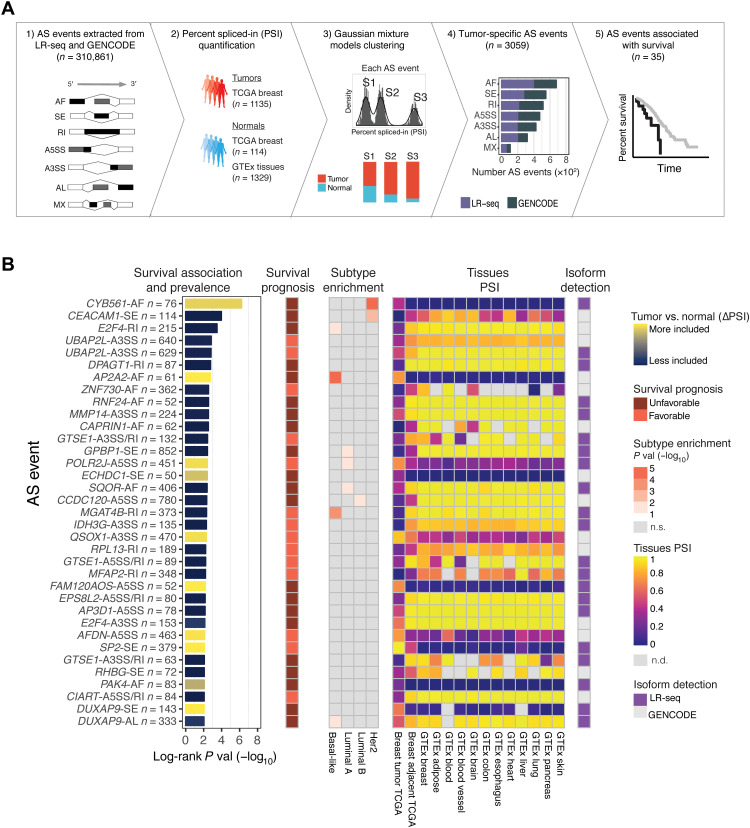
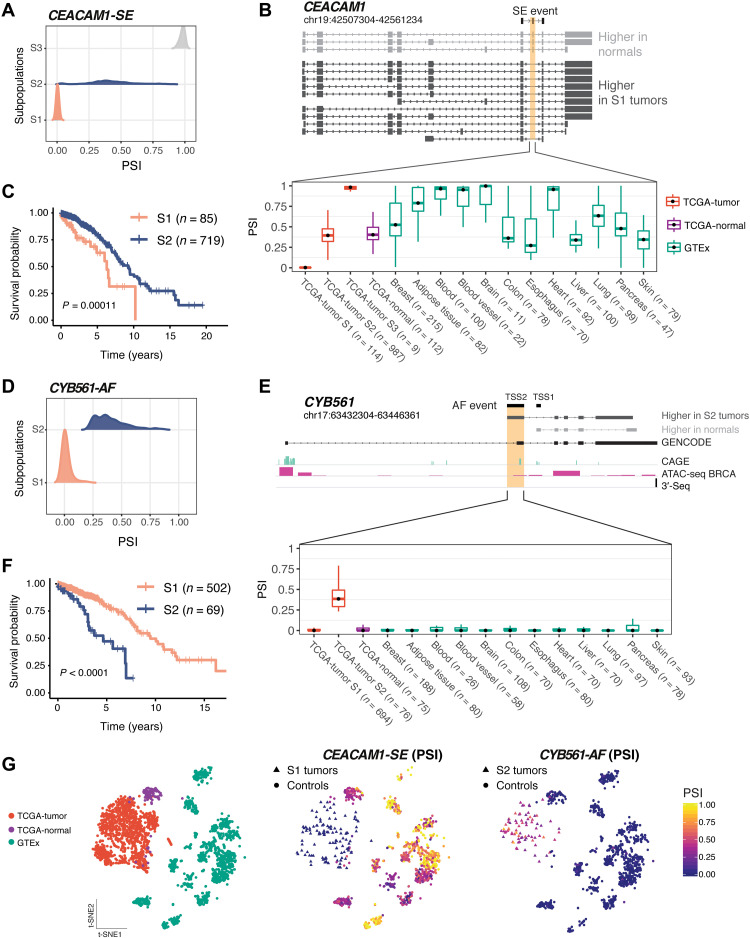
Tumors display widespread transcriptome alterations, but the full repertoire of isoform-level alternative splicing in cancer is unknown. We developed a long-read (LR) RNA sequencing and analytical platform that identifies and annotates full-length isoforms and infers tumor-specific splicing events. Application of this platform to breast cancer samples identifies thousands of previously unannotated isoforms; ~30% affect protein coding exons and are predicted to alter protein localization and function. We performed extensive cross-validation with -omics datasets to support transcription and translation of novel isoforms. We identified 3059 breast tumor–specific splicing events, including 35 that are significantly associated with patient survival. Of these, 21 are absent from GENCODE and 10 are enriched in specific breast cancer subtypes. Together, our results demonstrate the complexity, cancer subtype specificity, and clinical relevance of previously unidentified isoforms and splicing events in breast cancer that are only annotatable by LR-seq and provide a rich resource of immuno-oncology therapeutic targets.


Figures

Fig. 1.
Fig. 1.. LR-seq identifies previously undetected isoforms in breast cancer.
(A) Schematic of breast cancer isoform profiling by LR-seq and short-read RNA-seq. LR-seq isoforms are classified on the basis of their similarity to GENCODE isoforms using SQANTI isoform structural categories (see legend). Novel splice junctions are depicted by dashed lines and known junctions by solid lines. See also fig. S1 and file S1. (B) LR-seq isoforms detected in individual breast cancer or normal samples are colored by categories from (A), show per tissue subtype and origin. See also file S2. (C) Hierarchical clustering of samples profiled by LR-seq based on the Jaccard pairwise similarity coefficient. (D) Classification of LR-seq isoforms from merged tumor and normal samples from (B). The percent and number of distinct isoforms in each category from (A) are indicated. See also figs. S2 and S3. (E) Percent of LR-seq isoforms detected by RNA-seq in 29 breast cancer and normal samples, plotted per category from (A). (F) Percent of LR-seq isoform transcription start sites supported by CAGE (FANTOM5) or ATAC-seq (TCGA breast) peaks, transcription termination sites supported by the presence of a poly(A) motif (SQANTI2), or 3′-seq peaks from the polyA site database, plotted per category from (A). The diagram at the top exemplifies isoforms with first exons (5′ ends) validated by CAGE or ATAC-seq peaks, and terminal exons (3′ end) supported by 3′-seq peaks or poly(A) motifs. (G and H) Structure of CYTIP (G) or DHRS3 (H) previously unidentified LR-seq isoforms compared to GENCODE isoforms, along with CAGE or ATAC-seq support for unknown transcription start site (G) and 3′-seq peaks supporting the previously unknown transcription termination site (H). Novel regions are highlighted.
Fig. 2.
Fig. 2.. Previously unidentified LR-seq isoforms detected in breast tumors are enriched in cancer-associated pathways and oncogenes.
(A) Correlation between gene expression levels from RNA-seq and number of transcript isoforms detected by LR-seq. Genes are binned on the basis of quartile expression: low (first quartile), average (second and third quartiles), and high (fourth quartile); where n is the mean log2 FPKM expression. Distribution of isoform numbers for each gene bin; where n is the mean absolute number of isoforms in the category. (B) Pathways significantly enriched [MSigDB, false discovery rate (FDR) < 0.05)] for genes with novel isoforms detected by LR-seq in all breast tumors or specific subtypes (HER2+, ER+/PR+, and TNBC). Bubble size denotes the number of genes with novel isoforms in each pathway, and color denotes significance. See also fig. S4A. (C) Enrichment analysis of oncogenes and tumor suppressors in genes with unannotated isoforms detected by LR-seq (hypergeometric test, P < 0.05, cutoff indicated by a red dotted line). Oncogenes and tumor suppressor gene lists are obtained from MSigDB and TSGene databases, respectively. (D) Number of novel LR-seq isoforms compared to annotated GENCODE isoforms for selected oncogenes (left). Barplots (right) indicate the tumor subtypes (colored as in Fig. 1B) where novel isoforms were detected. (E) Structure of LR-seq ERBB2 isoforms detected in breast tumors, grouped by isoform structural category from Fig. 1A. Included exons or introns are represented by solid boxes, spliced introns or exons by a line. The localization of ERBB2 protein domains is indicated.
Fig. 3.
Fig. 3.. Novel LR-seq isoforms detected in breast tumors are predicted to affect protein sequence, domains, or localization.
(A) Percent of amino acid sequence identity for LR-seq isoform–derived ORFs compared to their closest human protein isoform in UniProt, plotted by isoform structural category from Fig. 1A. Known ORFs exhibit >99% identity and unannotated ORFs <99% identity with UniProt. See also fig. S5. (B) Percent of novel LR-seq isoform–derived ORFs predicted to gain or lose a conserved PFAM domain or transmembrane region compared to their closest human protein isoform in UniProt. (C) Percent of novel LR-seq isoform–derived ORFs predicted by DeepLoc to exhibit a different subcellular localization compared to their closest human protein isoform in UniProt. The absolute number of ORFs in each structural category is indicated. See also fig. S5 (C and D). (D) Number of novel LR-seq isoform–derived ORFs validated by MS/MS proteomics, plotted per isoform structural category from Fig. 1A. Peptide search was conducted using 275 breast cancer samples (170 patients) from Clinical Proteomic Tumor Analysis Consortium (CPTAC).
Fig. 4.
Fig. 4.. Patient clustering identifies splicing alterations associated with overall survival in breast cancer.
(A) Identification of tumor-specific AS events in TCGA breast cancer patient subpopulations using the GMM clustering approach. Seven types of AS events (SE, MX, A5SS, A3SS, RI, AF, and AL) were extracted from both LR-seq and GENCODE isoforms (1) and quantified as PSI with SUPPA2 using RNA-seq from 2579 samples including TCGA breast tumors and normal tissues from TCGA and GTEx (2). The GMM clustering approach provided for each AS event the optimal number of distinct sample subpopulations (e.g., S1 to S3) that fit the PSI distribution, as well as the frequency of tumor and control samples in each subpopulation (3). The GMM clustering identified 3059 tumor-specific AS events in TCGA breast tumors versus normal tissues, plotted per AS event type (4). The Kaplan-Meier survival analysis compared survival rates in the identified subpopulations for tumor-specific events and detected 35 AS events associated with subpopulations with differential survival in TCGA (5). (B) Tumor-enriched AS events associated with overall survival in TCGA breast tumors identified by the GMM clustering approach from (A). Only AS events detected in ≥50 patients, with |ΔPSI | ≥ 20%, and with significant survival association are shown, ranked by differential survival (log-rank test, adjusted P < 0.01). AS events are labeled with gene name, AS event type, and number of patients and colored based on inclusion levels (ΔPSI) in tumors versus normal tissues. Information for each AS event is depicted in heatmaps, including survival prognosis, breast tumor subtype enrichment, tissues PSI values, and source of isoform detection. n.s., not significant; n.d., not detected.
Fig. 5.
Fig. 5.. AS events in CEACAM1 and CYB561 are tumor specific and associated with unfavorable prognosis in TCGA.
(A) TCGA tumor subpopulations (S1 to S3) detected by GMM clustering exhibit different PSI of exon 7 in CEACAM1. (B) Structure of CEACAM1 isoforms detected by LR-seq in breast tumors or normal tissues, highlighting the location of skipped exon 7 (top). Exon 7 PSI is shown in TCGA tumor subpopulations, TCGA normal adjacent breast tissues, and GTEX normal tissues (bottom). (C) Overall survival in TCGA breast cancer patients in S1 subpopulation, with CEACAM1 exon 7 skipping, and S2 subpopulation, with higher exon 7 inclusion (log-rank test). (D) TCGA subpopulations (S1 and S2) detected by GMM clustering exhibit different PSI values for an alternative first exon in CYB561. (E) Structure of CYB561 isoforms detected by LR-seq in breast tumors or normal tissues, highlighting the location of novel (TSS1) or known alternative (TSS2) transcriptional start sites (top). CAGE, ATAC-seq, and 3′-seq genomic tracks are displayed. PSI of the isoform containing the CYB561 TSS2 in TCGA tumor subpopulations, TCGA normal adjacent breast tissues, and GTEX normal tissues (bottom). (F) Overall survival in TCGA breast cancer patients in S1 subpopulation, with lower TSS2 inclusion, and S2 subpopulation, with higher TSS2 inclusion (log-rank test). (G) t-Distributed stochastic neighbor embedding (t-SNE) representations of the CEACAM1 and CYB561 AS events, showing samples per dataset (left) and colored by PSI levels for each tumor subpopulation and controls (right).

References

    1. Manning K. S., Cooper T. A., The roles of RNA processing in translating genotype to phenotype. Nat. Rev. Mol. Cell Biol. 18, 102–114 (2017). - PMC - PubMed
    1. Eswaran J., Horvath A., Godbole S., Reddy S. D., Mudvari P., Ohshiro K., Cyanam D., Nair S., Fuqua S. A. W., Polyak K., Florea L. D., Kumar R., RNA sequencing of cancer reveals novel splicing alterations. Sci. Rep. 3, 1689 (2013). - PMC - PubMed
    1. Zhao W., Hoadley K. A., Parker J. S., Perou C. M., Identification of mRNA isoform switching in breast cancer. BMC Genomics 17, 181 (2016). - PMC - PubMed
    1. Lapuk A., Marr H., Jakkula L., Pedro H., Bhattacharya S., Purdom E., Hu Z., Simpson K., Pachter L., Durinck S., Wang N., Parvin B., Fontenay G., Speed T., Garbe J., Stampfer M., Bayandorian H., Dorton S., Clark T. A., Schweitzer A., Wyrobek A., Feiler H., Spellman P., Conboy J., Gray J. W., Exon-level microarray analyses identify alternative splicing programs in breast cancer. Mol. Cancer Res. 8, 961–974 (2010). - PMC - PubMed
    1. Stricker T. P., Brown C. D., Bandlamudi C., McNerney M., Kittler R., Montoya V., Peterson A., Grossman R., White K. P., Robust stratification of breast cancer subtypes using differential patterns of transcript isoform expression. PLOS Genet. 13, e1006589 (2017). - PMC - PubMed

Publication types

Substances