. 2022 Jan 21;8(3):eabi6696.
doi: 10.1126/sciadv.abi6696. Epub 2022 Jan 19.

Class I histone deacetylases (HDAC1-3) are histone lysine delactylases

Affiliations

Class I histone deacetylases (HDAC1-3) are histone lysine delactylases

Carlos Moreno-Yruela et al. Sci Adv. .

Abstract

Lysine L-lactylation [K(L-la)] is a newly discovered histone mark stimulated under conditions of high glycolysis, such as the Warburg effect. K(L-la) is associated with functions that are different from the widely studied histone acetylation. While K(L-la) can be introduced by the acetyltransferase p300, histone delactylases enzymes remained unknown. Here, we report the systematic evaluation of zinc- and nicotinamide adenine dinucleotide–dependent histone deacetylases (HDACs) for their ability to cleave ε-N-L-lactyllysine marks. Our screens identified HDAC1–3 and SIRT1–3 as delactylases in vitro. HDAC1–3 show robust activity toward not only K(L-la) but also K(D-la) and diverse short-chain acyl modifications. We further confirmed the de-L-lactylase activity of HDACs 1 and 3 in cells. Together, these data suggest that histone lactylation is installed and removed by regulatory enzymes as opposed to spontaneous chemical reactivity. Our results therefore represent an important step toward full characterization of this pathway’s regulatory elements.


Figures

Fig. 1.
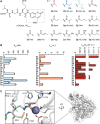
Fig. 1.. In vitro screening for delactylase activity.
(A) Reversible posttranslational modification of lysine to ε-N-acetyllysine (Kac), ε-N-l-lactyllysine [K(l-la)], and ε-N-D-lactyllysine [K(d-la)]. (B) Dot blot assay using the pan anti-Kla antibody and bovine serum albumin (BSA) that were unmodified or modified with Kac, K(l-la), or K(d-la) PTMs. (C) Conversion of 7-amino-4-methylcoumarin (AMC)–conjugated Kac (1a), K(l-la) (1b), and K(d-la) (1c) substrates (see fig. S2 for structures) by HEK293T whole-cell lysates and inhibition with an HDAC inhibitor [trichostatin A (TSA)] or a pan-sirtuin inhibitor (NAM). Data represent means ± SD (n = 4). (D) Deacylase activity screening using short AMC-conjugated peptides, including positive controls for each recombinant enzyme (left part of heat maps), a K(l-la) substrate (4b), and substrates bearing short aliphatic modifications (4f and 4g). Heatmaps represent mean values of AMC concentration (n = 2) (see fig. S2 for substrate structures and fig. S3 for bar graphs). N.D.: not determined. (E) Deacylase activity screening using core histones from HeLa cells and antibodies against Kac and K(l-la) modifications, with histone H3 as loading control (4-hour reaction; see fig. S1A for data after 1-hour incubation). *HDAC3 incubated with the deacetylase activation domain (DAD) of NCoR2.
Fig. 2.
Fig. 2.. Delactylase activity of class I HDAC1–3.
(A) Conversion of Kac, K(l-la), and K(d-la) short AMC-conjugated peptides. Data represent means ± SD (n = 2). (B) Michaelis-Menten plots for HDACs 1 and 3 against substrates 2b and 2c. Data represent means ± SEM (n = 2) (see fig. S4 for HDAC2 data and sample assay progression curves). (C) Catalytic efficiencies of HDAC1–3 against substrates 2b and 2c. Data represent means ± SEM (n = 2) (see fig. S4 for complete KM and kcat datasets). *HDAC3 incubated with the DAD of NCoR2.
Fig. 3.
Fig. 3.. Delactylase activities of HDAC1–3 at different histone sites.
(A) Synthesized histone peptide sequences, with X = Kac (a), K(l-la) (b), or K(d-la) (c). (B) Sample deacetylation and delactylation HPLC assay traces (60-min reaction of 50 nM HDAC3/NCoR2 with 50 μM peptide 6a or 6b). (C) Relative conversion of Kac-, K(l-la)–, or K(d-la)–containing histone peptides. Data represent means ± SD (n = 2). (D) Relative conversion of Kac-, K(l-la)–, or K(D-la)–containing H3K18 peptide by SIRT1–3. Data represent means ± SD (n = 2). (E) Michaelis-Menten plots for HDAC1–3 against substrates 6a, 6b, and 6c. Data represent means ± SEM (n = 2) (see fig. S5 for HDAC2 data). (F) Catalytic efficiencies of HDAC1–3 against substrates 6ac and 10ac. Data represent means ± SEM (n = 2) (see fig. S5 for Michaelis-Menten plots of substrates 10ac and numerical data). *HDAC3 incubated with the DAD of NCoR2.
Fig. 4.
Fig. 4.. Acyl-lysine substrate scope for HDAC3.
(A) Structure of H410–12 (Ac-LGK-AMC) substrates. (B) Kinetic parameters of HDAC3/NCoR2 against H410–12 substrates with various acyl-lysine modifications. Data represent means ± SEM (n = 2) (see fig. S4 for Michaelis-Menten curves and numerical data). (C) Docking of K(l-la) (green) and K(d-la) (pink) substrate mimics into the crystal structure of HDAC3 (pdb 4A69). A hydrogen bond between H134 and the hydroxy group of the K(d-la) modification is predicted.
Fig. 5.
Fig. 5.. Mass spectrometric identification and quantification of in vitro HDAC3-catalyzed delactylation targets on core histones.
(A) Changes in lactylation and acetylation of histones (overall, and at the sites H3K18 and H4K5) upon HDAC3 treatment and inhibition with TSA and apicidin. (B) Forward and reverse MS quantification of Kla and Kac sites, with or without HDAC3. (C) A representative MS/MS spectrum of the histone H4 peptide GGKlaGLGK. (D) Representative MS quantification from in vitro histone deacylation products shown in (B). A full list of quantified peptides can be found in table S1.
Fig. 6.
Fig. 6.. In cellulo deacetylase, decrotonylase, and delactylase activities of HDAC1–3.
(A) Changes in overall lactylation and acetylation of histones in HeLa cells upon 5-hour treatment with pan-HDAC inhibitors (sodium butyrate, 2 mM; TSA, 1 μM), the HDAC1–3–selective inhibitor apicidin (1 μM), the class IIa–selective inhibitor TMP195 (5 μM), or the pan-sirtuin inhibitor NAM (10 mM) (see fig. S6 for full Western blots and blots with longer exposure time). (B) Western blot analysis of core histones from HeLa cells with or without transfection of HA-tagged HDAC1, FLAG-tagged HDAC2, or HA-tagged HDAC3. (C) Western blot analysis of core histones from HeLa cells with or without small interfering RNA (siRNA)–mediated knockdown of HDACs 1, 2, 3, or their combination (72-hour treatment). Top blots correspond to whole-cell lysates and show the level of ectopically expressed HDAC (B) or HDAC knockdown (C) relative to β-actin (see fig. S6 for full Western blots). (D to F) Immunostaining images of HeLa cells transfected with HA-tagged HDAC1, FLAG-tagged HDAC2, or HA-tagged HDAC3 and the levels of histone acetylation, crotonylation, and lactylation. DAPI: 4′,6-diamidino-2-phenylindole (nuclear stain).
Fig. 7.
Fig. 7.. Selective degradation of HDAC3 and mass spectrometric quantification of in vivo delactylation targets on core histones.
(A) Changes in HDAC1–3 concentration upon treatment of HEK293 cells with PROTAC DD-I22 at 500 nM for the indicated time (see fig. S8 for chemical structure and optimization of degradation conditions in HeLa and HEK293T cells). (B) MS quantification of Kac and Kla sites on core histones extracted from HEK293 cells upon treatment with DD-I22 (500 nM) for 4 hours (see fig. S10 for quantification after 2 hours).

References

    1. Diehl K. L., Muir T. W., Chromatin as a key consumer in the metabolite economy. Nat. Chem. Biol. 16, 620–629 (2020). - PMC - PubMed
    1. Moellering R. E., Cravatt B. F., Functional lysine modification by an intrinsically reactive primary glycolytic metabolite. Science 341, 549–553 (2013). - PMC - PubMed
    1. Dancy B. M., Cole P. A., Protein lysine acetylation by p300/CBP. Chem. Rev. 115, 2419–2452 (2015). - PMC - PubMed
    1. Luo M., Chemical and biochemical perspectives of protein lysine methylation. Chem. Rev. 118, 6656–6705 (2018). - PMC - PubMed
    1. Lu C., Thompson C. B., Metabolic regulation of epigenetics. Cell Metab. 16, 9–17 (2012). - PMC - PubMed

Publication types