. 2022 Jan 19:11:e72883.
doi: 10.7554/eLife.72883.

Developmental single-cell transcriptomics of hypothalamic POMC neurons reveal the genetic trajectories of multiple neuropeptidergic phenotypes

Affiliations

Developmental single-cell transcriptomics of hypothalamic POMC neurons reveal the genetic trajectories of multiple neuropeptidergic phenotypes

Hui Yu et al. Elife. .

Abstract

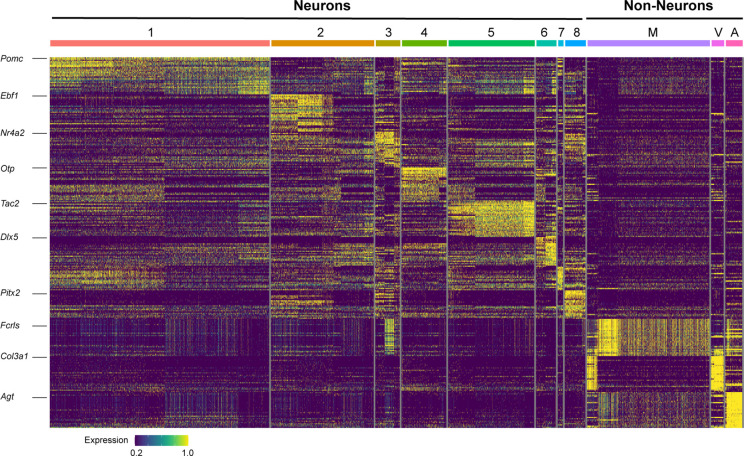
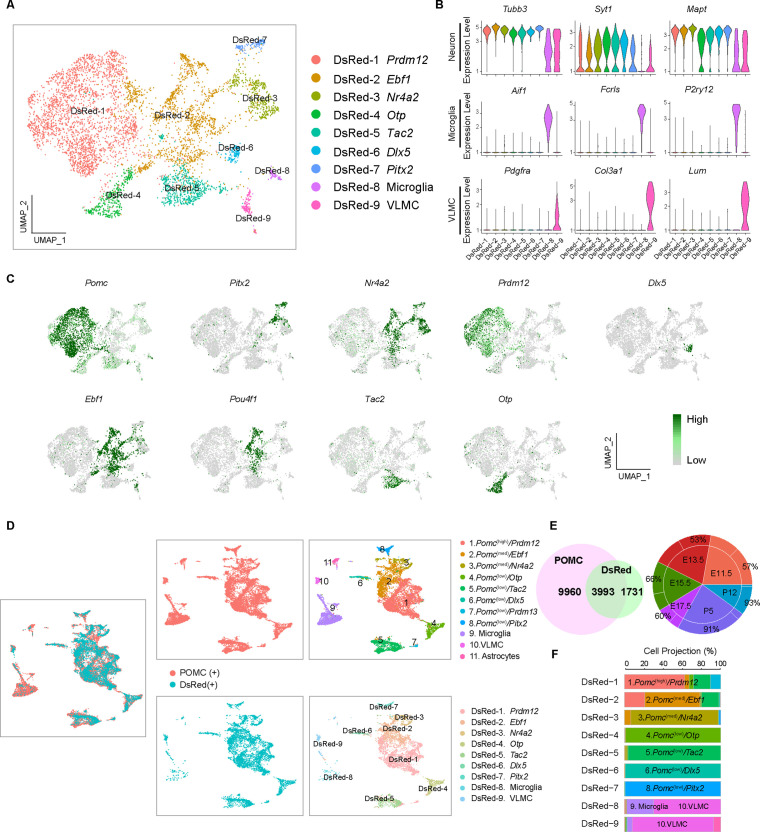
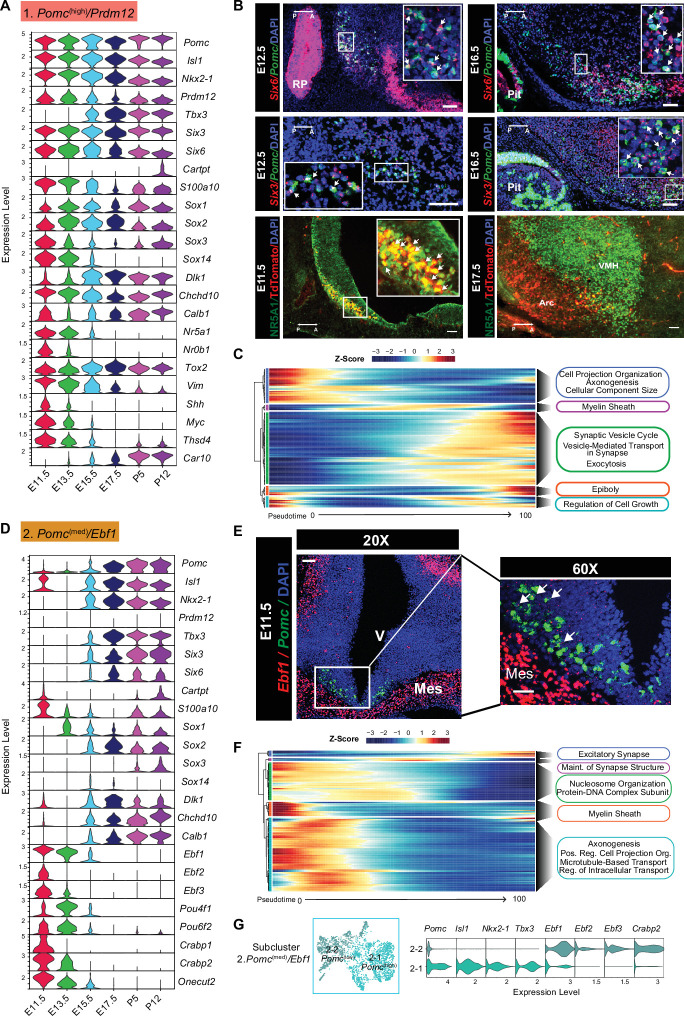
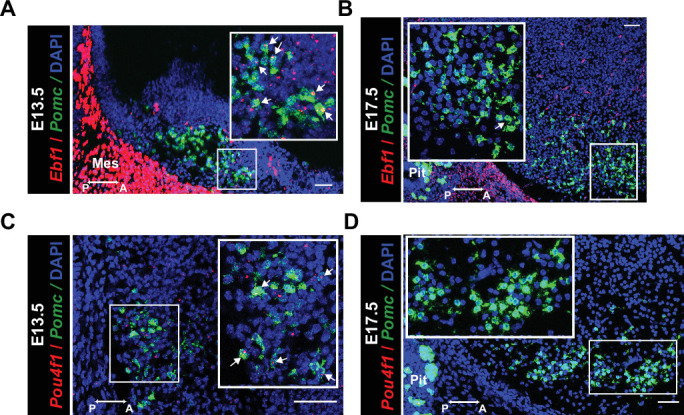
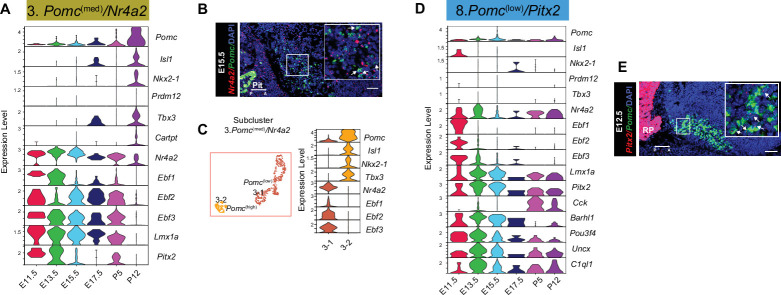
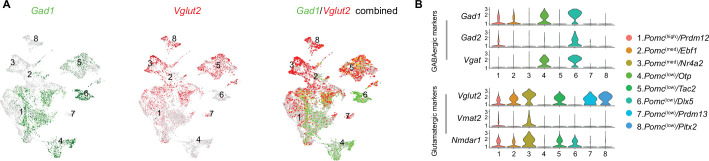
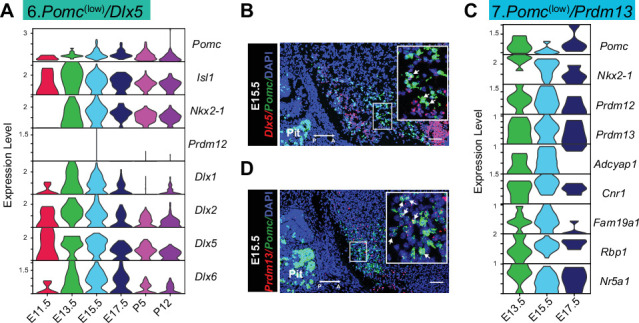
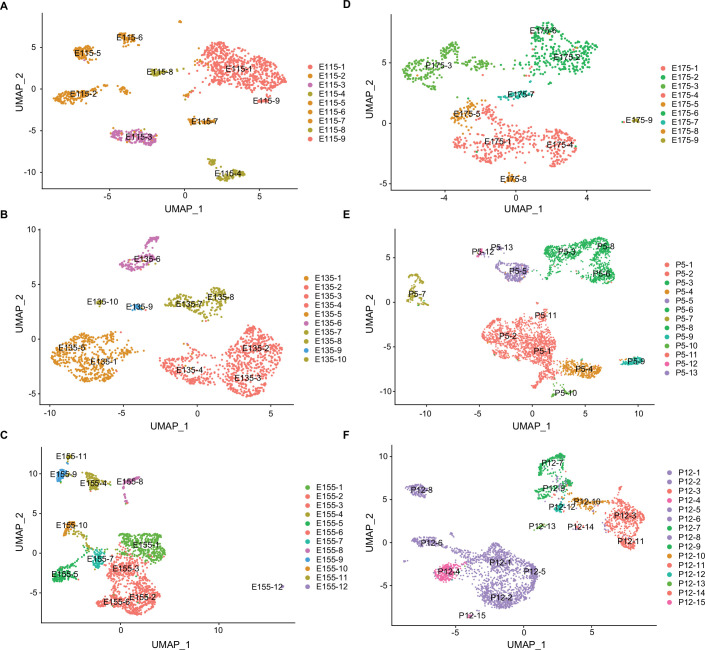
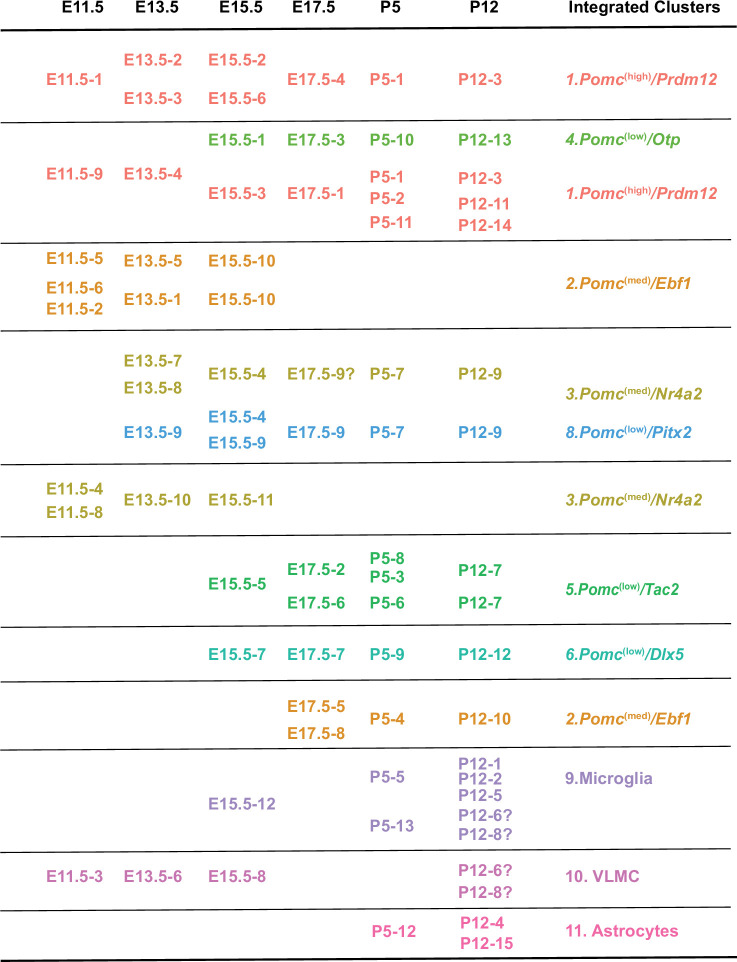
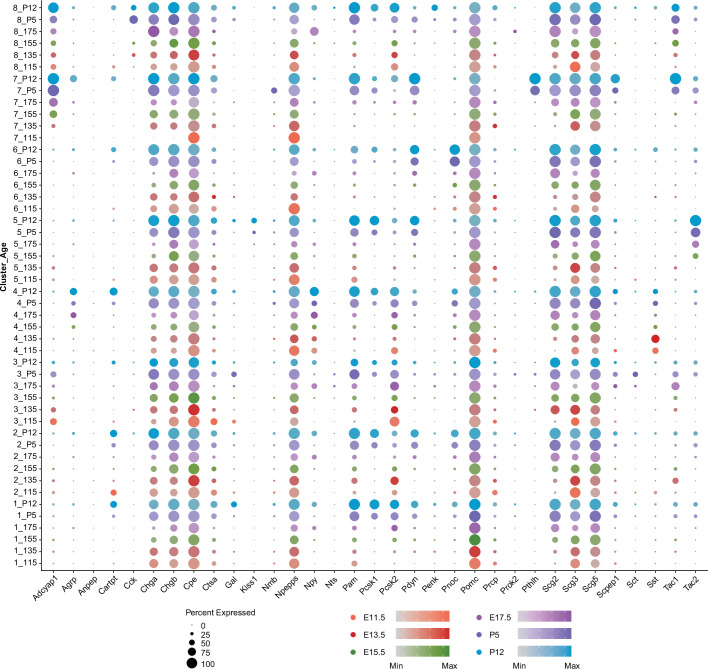
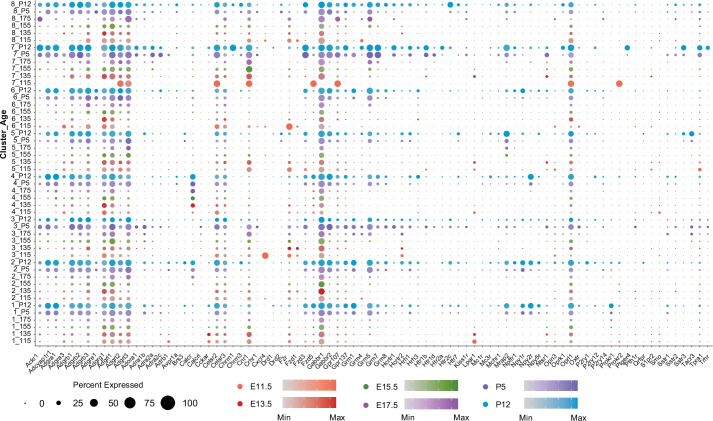
Proopiomelanocortin (POMC) neurons of the hypothalamic arcuate nucleus are essential to regulate food intake and energy balance. However, the ontogenetic transcriptional programs that specify the identity and functioning of these neurons are poorly understood. Here, we use single-cell RNA-sequencing (scRNA-seq) to define the transcriptomes characterizing Pomc-expressing cells in the developing hypothalamus and translating ribosome affinity purification with RNA-sequencing (TRAP-seq) to analyze the subsequent translatomes of mature POMC neurons. Our data showed that Pomc-expressing neurons give rise to multiple developmental pathways expressing different levels of Pomc and unique combinations of transcription factors. The predominant cluster, featured by high levels of Pomc and Prdm12 transcripts, represents the canonical arcuate POMC neurons. Additional cell clusters expressing medium or low levels of Pomc mature into different neuronal phenotypes featured by distinct sets of transcription factors, neuropeptides, processing enzymes, cell surface, and nuclear receptors. We conclude that the genetic programs specifying the identity and differentiation of arcuate POMC neurons are diverse and generate a heterogeneous repertoire of neuronal phenotypes early in development that continue to mature postnatally.

Keywords: POMC; development; developmental biology; hypothalamus; mouse; neuroscience; single-cell transcriptomics.


Conflict of interest statement

HY, MR, ML No competing interests declared

Figures

Figure 1.
Figure 1.. Single-cell sequencing of PomcDsRed cells from developing mouse hypothalami at E11.5, E13.5, E15.5, E17.5, P5, and P12 reveals eight distinct neuronal clusters and three non-neuronal clusters.
(A) Schematic diagram showing the overall experimental procedure. (B) UMAP (Uniform Manifold Approximation and Projection) plot showing the distribution of major cell clusters and their corresponding numbers of cells at each developmental stage. (C) Violin plots showing the expression of three signature genes and Pomc for each cluster. (D) UMAP plots showing the enrichment of feature genes in each cluster. Genes representing each cluster were colored and highlighted to show the cluster-specific enrichment. The color intensity corresponds to the normalized gene expression from Seurat analysis, where gene expression for each cell was normalized by the total expression, multiplied by a scale factor of 10,000, and then log-transformed. VLMC, vascular leptomeningeal cell.
Figure 1—figure supplement 1.
Figure 1—figure supplement 1.. Heatmap showing the expression of the top 30 marker genes defining each cluster from Figure 1.
M: microglia; V: vascular and leptomeningeal cells; A: astrocytes.
Figure 1—figure supplement 2.
Figure 1—figure supplement 2.. Analysis of proopiomelanocortin (POMC) cells with DsRed transcripts reveals nine distinct cell clusters.
(A) Uniform Manifold Approximation and Projection (UMAP) plot showing the distribution of major cell clusters. (B) Violin plots showing signature gene expression in each cell type. Three feature genes were chosen to represent each cell type. (C) UMAP plots showing the enrichment of feature genes in each cluster. Genes representative of each cluster were colored and highlighted to show the cluster-specific enrichment. The color intensity corresponds to the normalized gene expression from Seurat analysis. (D) Identification of similar cell clusters between POMC cells with DsRed transcripts and POMC cell clusters. Red: POMC cell clusters are from Figure 1. Blue: POMC cells with DsRed transcripts from A-F. (E) Venn diagram showing the number of cells expressing Pomc transcripts, DsRed transcripts or both Pomc and DsRed transcripts. Pie chart showing the percentage of POMC cells expressing DsRed transcripts at each developmental stage. (F) Vertical bar-chart showing the percentage of cells with DsRed transcripts projected to corresponding POMC cell clusters. VLMC, vascular and leptomeningeal cell.
Figure 1—figure supplement 3.
Figure 1—figure supplement 3.. Overview of cell clusters from proopiomelanocortin (POMC) cells with DsRed transcripts.
(A) Uniform Manifold Approximation and Projection (UMAP) plot showing the distribution of major cell clusters and their corresponding number of cells from each developmental stage. (B) UMAP plots showing the number of cells at each developmental stage. (C) UMAP plots showing the splitting of clusters by developmental stages.
Figure 2.
Figure 2.. Temporal gene expression patterns of the Pomc(high)/Prdm12 cluster and Pomc(med)/Ebf1 clusters.
(A and D) Violin plots showing the expression of signature genes at each developmental stage in the Pomc(high)/Prdm12 cluster and Pomc(med)/Ebf1 cluster, respectively. (B) Fluorescence in situ hybridization showing the co-localization of Pomc (green) and Six6 (red), the co-localization of Pomc (green) and Six3 (red) at indicated developmental stages. Immunofluorescence showing the co-localization TDTOMATO (red) NR5A1 (green) at the indicated developmental stages. (C and F) Heatmaps showing the gene ontology analysis based on the top marker genes in the order of pseudotime in Pomc(high)/Prdm12 cluster and Pomc(med)/Ebf1 cluster, respectively. (E) Fluorescence in situ hybridization showing the co-localization of Pomc (green) and Ebf1 (red) at E11.5. (G) Reclustering cells from the Pomc(med)/Ebf1 cluster reveals two subclusters denoted as 2–1 Pomc(high) and 2–2 Pomc(low). Violin plots showing the signature gene expression in 2–1 Pomc(high) and 2–2 Pomc(low) clusters. Insets are magnified views of the indicated boxes. Arrows indicate co-expressing neurons in the merged panels. Scale bar: 50 µm. Image orientation: left, posterior(P); right, anterior(A). RP: Rathke’s pouch; Pit: pituitary gland. Arc: arcuate nucleus; VMH: ventromedial hypothalamus; V: ventricular zone; Mes: mesenchyme.
Figure 2—figure supplement 1.
Figure 2—figure supplement 1.. Fluorescence in situ hybridization showing the co-localization of Pomc (green) and Ebf1 (red) at E13.5 (A) and at E17.5 (B) and the co-localization of Pomc (green) and Pou4f1 (red) at E13.5 (C) and at E17.5 (D), respectively.
Scale bar: 50 µm. Image orientation: left, posterior (P); right, anterior (A); Pit: pituitary gland; Mes: mesenchyme.
Figure 2—figure supplement 2.
Figure 2—figure supplement 2.. Temporal gene expression patterns of the Pomc(med)/Nr4a2 and Pomc(low)/Pitx2 clusters.
(A) Violin plots showing the expression of signature genes in the Pomc(med)/Nr4a2 cluster at each developmental stage. (B) Fluorescence in situ hybridization showing the co-localization of Pomc (green) and Nr4a2 (red). (C) Reclustering cells from the Pomc(med)/Nr4a2 cluster reveals two subclusters denoted as 3–1 Pomc(low) and 3–2 Pomc(high) clusters. Violin plot showing the signature gene expression in 3–1 Pomc(low) and 3–2 Pomc(high) clusters. (D) Violin plots showing the expression of signature genes at each developmental stage in the Pomc(low)/Pitx2 cluster. (E) Fluorescence in situ hybridization showing the co-localization of Pomc (green) and Pitx2 (red). Scale bar: 50 µm. Insets are magnified views of the indicated boxes. Arrows indicate co-expressing neurons in the merged panels. Scale bar: 50 µm. Image orientation: left, posterior (P); right, anterior (A). RP: Rathke’s pouch; Pit: pituitary gland.
Figure 3.
Figure 3.. Temporal gene expression patterns of the Pomc(low)/Otp cluster and Pomc(low)/Tac2 cluster.
(A and E) Violin plots showing the expression of signature genes at each developmental stage in Pomc(low)/Otp cluster and Pomc(low)/Tac2 cluster, respectively. (B) Fluorescence in situ hybridization showing the co-localization of Pomc (green) and Npy (red) at E15.5. (C and G) Heatmaps showing the gene ontology analysis based on the top marker genes in the order of pseudotime in Pomc(low)/Otp cluster and Pomc(low)/Tac2 cluster, respectively. (D) Uniform Manifold Approximation and Projection (UMAP) plots showing cells in the Pomc(low)/Otp cluster expressing Sst, Agrp, Npy, Sst/Agrp, Sst/ Npy, or Agrp/Npy. Cells expressing Sst and cells expressing both Agrp/Npy are from two distinct cell populations. (F) Fluorescence in situ hybridization showing the co-localization of Pomc (green) and Tac2 (red), the co-localization of Pomc (green) and Tacr3 (red), and the co-localization of Pomc (green) and Sox14 (red) at the indicated developmental stages. Immunofluorescence showing the co-localization of TDTOMATO (red) and ESR1 (green) at the indicated developmental stages. Insets are magnified views of the indicated boxes. Arrows indicate co-expressing neurons in the merged panels. Scale bar: 50 µm. Image orientation: left, posterior; right, anterior; Pit: pituitary gland, RP: Rathke’s pouch.
Figure 3—figure supplement 1.
Figure 3—figure supplement 1.. Distribution of GABAergic and glutamatergic neurons in POMCDsRed cell clusters.
(A) Uniform Manifold Approximation and Projection (UMAP) plots showing the distribution of cells with Gad1 or Vglut2 gene expression. (B) Violin plots showing expression of the GABAergic or glutamatergic marker genes in each neuronal cluster.
Figure 3—figure supplement 2.
Figure 3—figure supplement 2.. Temporal gene expression patterns of the Pomc(low)/Dlx5 and Pomc(low)/Prdm13 clusters.
(A) Violin plots showing the expression of signature genes at each developmental stage in the Pomc(low)/Dlx5 cluster. (B) Fluorescence in situ hybridization showing the co-localization of Pomc (green) and Dlx5 (red). (C) Violin plots showing the expression of signature genes at each developmental stage in the Pomc(low)/Prdm13 cluster. (D) Fluorescence in situ hybridization showing the co-localization of Pomc (green) and Prdm13 (red). Insets are magnified views of the indicated boxes. Arrows indicate co-expressing neurons in the merged panels. Scale bar: 50 µm. Image orientation: left, posterior; right, anterior; Pit: pituitary gland.
Figure 4.
Figure 4.. Uniform Manifold Approximation and Projection (UMAP) plots showing the distribution of major cell clusters at each developmental stage.
(A) E11.5, (B) E13.5, (C) E15.5, (D) E17.5, (E) P5, and (F) P12. The developmental subclusters derived from each primary cluster are colored to corresponding cells in the UMAP plot in Figure 1B.
Figure 4—figure supplement 1.
Figure 4—figure supplement 1.. POMCDsRed developmental cell subclusters shown in Figure 4 are projected to the original integrated cell clusters from Figure 1.
The projections were based on the Seurat analysis and manual comparisons of feature genes in each subcluster (Figure 1—source data 2 and Figure 4—source data 2). The clusters from individual stages leading to the same final integrated clusters are labeled with the same color. Question marks indicate uncertainties of individual projections.
Figure 4—figure supplement 2.
Figure 4—figure supplement 2.. Overview of neuropeptide, secretory granule, and processing enzyme gene expression patterns across clusters and developmental ages.
The size of dots indicates the percentage of cells expressing the specific transcripts. The color intensity corresponds to the levels of normalized gene expression.
Figure 4—figure supplement 3.
Figure 4—figure supplement 3.. Overview of G-protein-coupled receptor (GPCR) gene expression patterns across clusters and developmental ages.
The size of dots indicates the percentage of cells expressing the specific transcripts. The color intensity corresponds to the levels of normalized gene expression. The list of genes was acquired from https://www.guidetopharmacology.org/targets.jsp and Gene Ontology (GO:0005576).
Figure 5.
Figure 5.. Translating ribosome affinity purification with RNA-sequencing (TRAP-seq) showing gene enrichment and gene expression profiles at P12 and P60.
(A) Schematic diagram showing the generation of Pomc-CreERT2; ROSA26eGFP-L10a mice for TRAP-seq experiment. Immunofluorescence validated the co-localization of proopiomelanocortin (POMC) and eGFP. (B) Principal component analysis showing the separation of the RNA sequencing data from beads pull-down vs. supernatant at P12 (purple) and P60 (green), respectively. (C) Heatmap showing both Pomc and eGFP were highly expressed in beads pull-down samples. Rows are the biological replicates of each sample. Sup: Supernatant samples; PD: pull-down samples. Data were presented as scaled counts per million (CPM). (D) Gene enrichment plots showing 1143 genes and 1047 genes were significantly expressed in beads pull-down samples at P12 and P60, respectively (p < 0.05). (E) Venn diagram showing the number of genes highly enriched in both P12 (purple) and P60 (green) beads pull-down samples. (F) Gene ontology analysis showing the top 15 biological processes that were represented in P12 and P60 co-expressed genes, P12 uniquely expressed genes and P60 uniquely expressed genes. (G) Expression profile of the top enriched genes from both P12 and P60 TRAP-seq datasets across eight neuronal clusters; gray boxes indicate the higher expression of these genes in the two postnatal stages. The two heatmaps (right) indicating the top genes expression in P12 and P60 TRAP-seq datasets. (H) Uniform Manifold Approximation and Projection (UMAP) plot showing the distribution of the top enriched genes from both P12 and P60 TRAP-seq datasets in eight neuronal cell clusters. CPM: counts per million; org.: organization; reg.: regulation; pos.:positive; neg.: negative.
Figure 6.
Figure 6.. RNA velocity and diffusion maps analyses illustrating the developmental trajectories of hypothalamic neuronal clusters.
(A) RNA velocity analysis showing the multiple origins of embryonic proopiomelanocortin (POMC) cells in eight neuronal clusters according to Seurat analysis cell embedding. (B) RNA velocity analysis showing the multiple origins of POMC cells correspond to the early embryonic stages. (C–D) Diffusion map showing the cell lineages of POMC neurons during embryogenesis. Cells are colored on the basis of their developmental stage (C) or based on their previously defined clusters (D). (E) Diffusion maps showing the expression of selected genes according to previous characterization of the feature genes representing each cluster. The color intensity corresponds to the normalized gene expression from Seurat analysis.
Figure 6—figure supplement 1.
Figure 6—figure supplement 1.. Overview of neuronal clusters split by developmental stages.
(A) Uniform Manifold Approximation and Projection (UMAP) plots showing the splitting of neuronal clusters by developmental stages. Clusters were dash-dot circled to show the emerging/evolving progress through development. (B) RNA velocity analysis showing the multiple origins of proopiomelanocortin (POMC) cells are mainly from 1. Pomc(high)/Prdm12 and 2. Pomc(med)/Ebf1 clusters and are mainly from E11.5 and E13.5. (C) RNA velocity analysis on neurons from three late embryonic stages (E13.5, E15.5, and E17.5) showing two origins of POMC cells from 1. Pomc(high)/Prdm12 and 2. Pomc(med)/Ebf1 clusters at E13.5.

Similar articles

Cited by

References

    1. Andersson E, Tryggvason U, Deng Q, Friling S, Alekseenko Z, Robert B, Perlmann T, Ericson J. Identification of intrinsic determinants of midbrain dopamine neurons. Cell. 2006;124:393–405. doi: 10.1016/j.cell.2005.10.037. - DOI - PubMed
    1. Angerer P, Haghverdi L, Büttner M, Theis FJ, Marr C, Buettner F. destiny: diffusion maps for large-scale single-cell data in R. Bioinformatics. 2016;32:1241–1243. doi: 10.1093/bioinformatics/btv715. - DOI - PubMed
    1. Appleyard SM, Hayward M, Young JI, Butler AA, Cone RD, Rubinstein M, Low MJ. A role for the endogenous opioid beta-endorphin in energy homeostasis. Endocrinology. 2003;144:1753–1760. doi: 10.1210/en.2002-221096. - DOI - PubMed
    1. Bergen V, Lange M, Peidli S, Wolf FA, Theis FJ. Generalizing RNA velocity to transient cell states through dynamical modeling. Nature Biotechnology. 2020;38:1408–1414. doi: 10.1038/s41587-020-0591-3. - DOI - PubMed
    1. Bouret SG. Formation of Projection Pathways from the Arcuate Nucleus of the Hypothalamus to Hypothalamic Regions Implicated in the Neural Control of Feeding Behavior in Mice. Journal of Neuroscience. 2004a;24:2797–2805. doi: 10.1523/JNEUROSCI.5369-03.2004. - DOI - PMC - PubMed

Publication types

Substances

Associated data