. 2022 Jan 19;17(1):e0262119.
doi: 10.1371/journal.pone.0262119. eCollection 2022.

Quantitative, traceable determination of cell viability using absorbance microscopy

Affiliations

Quantitative, traceable determination of cell viability using absorbance microscopy

Greta Babakhanova et al. PLoS One. .

Abstract

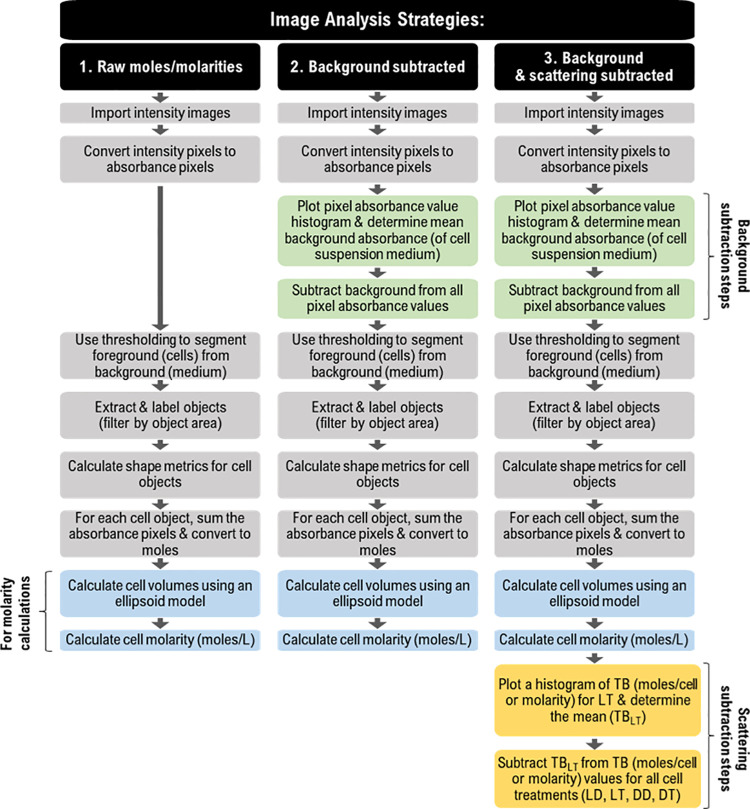
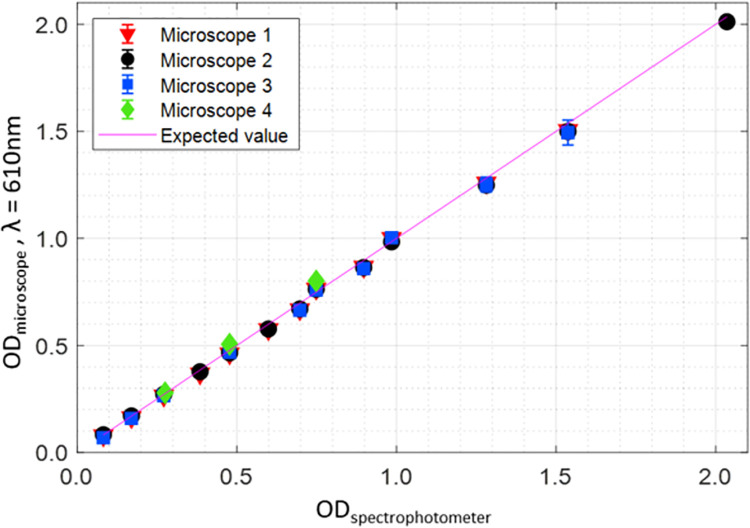
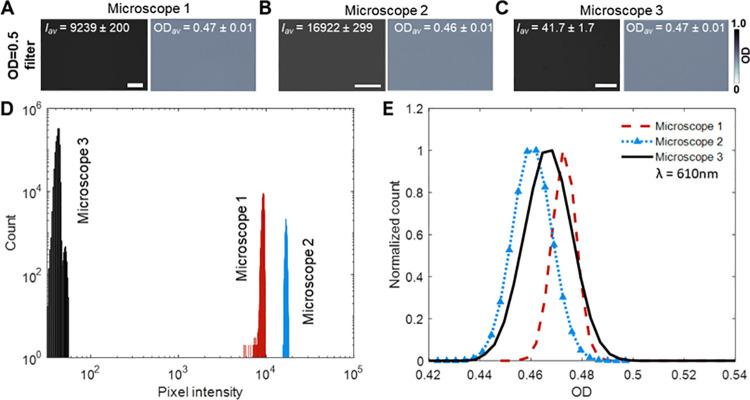
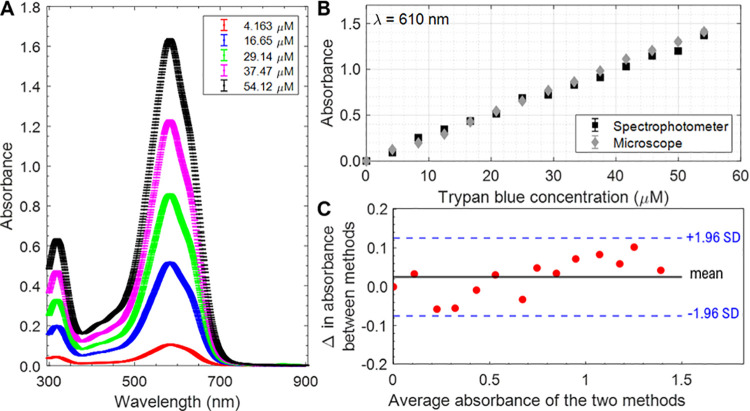
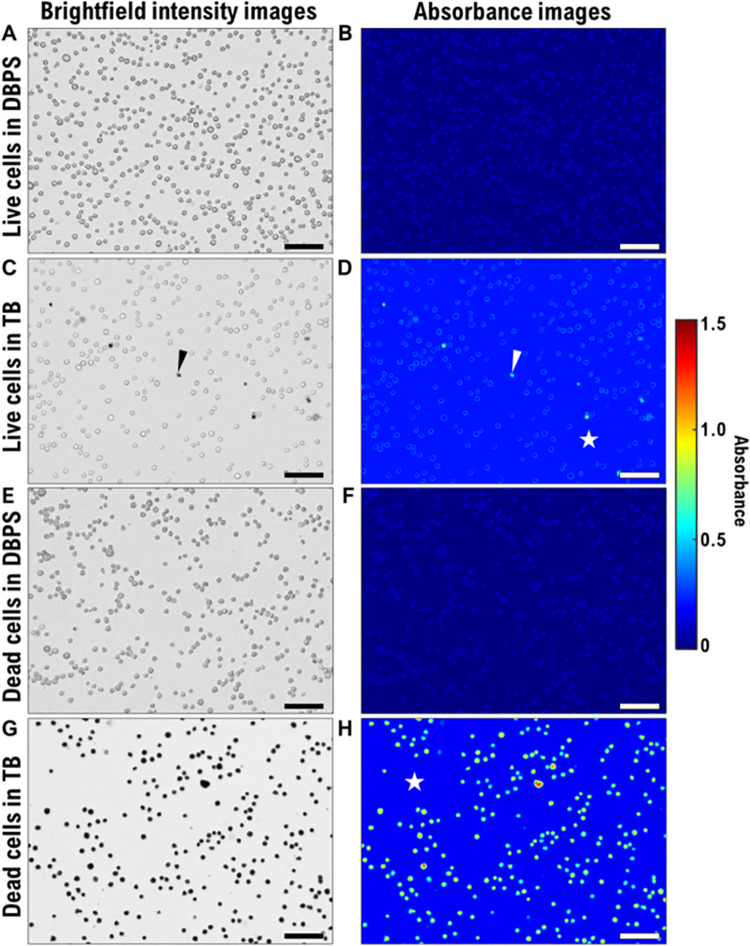
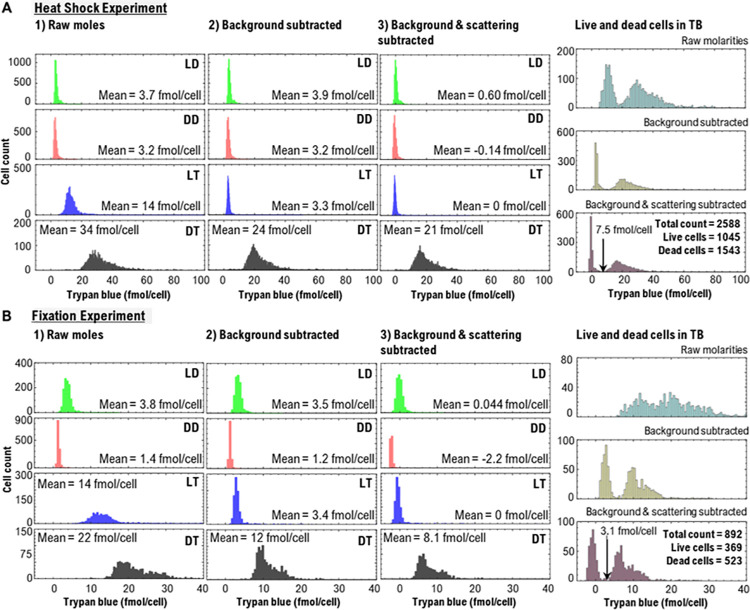
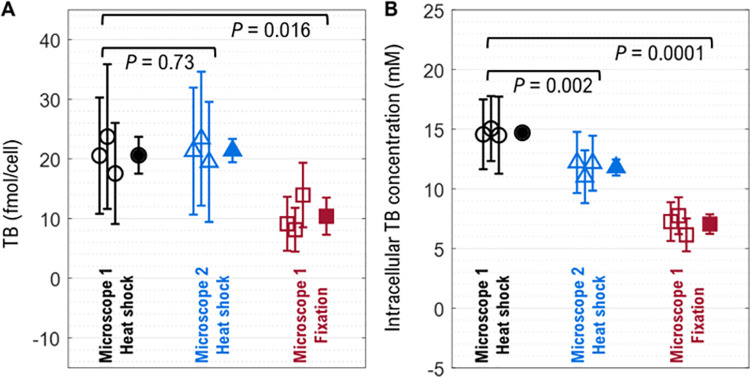
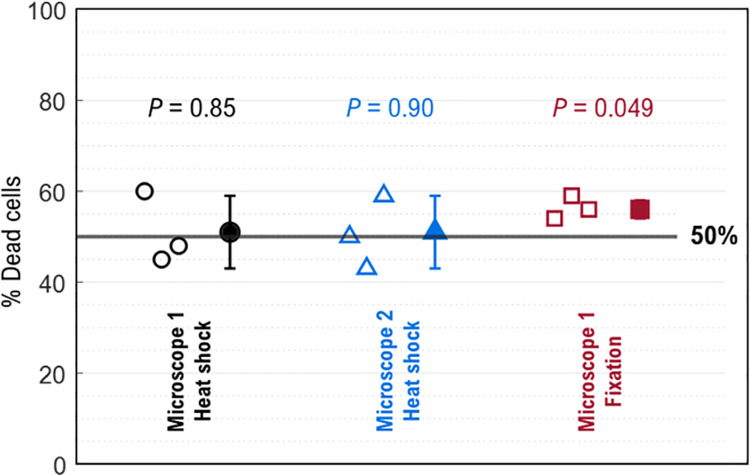
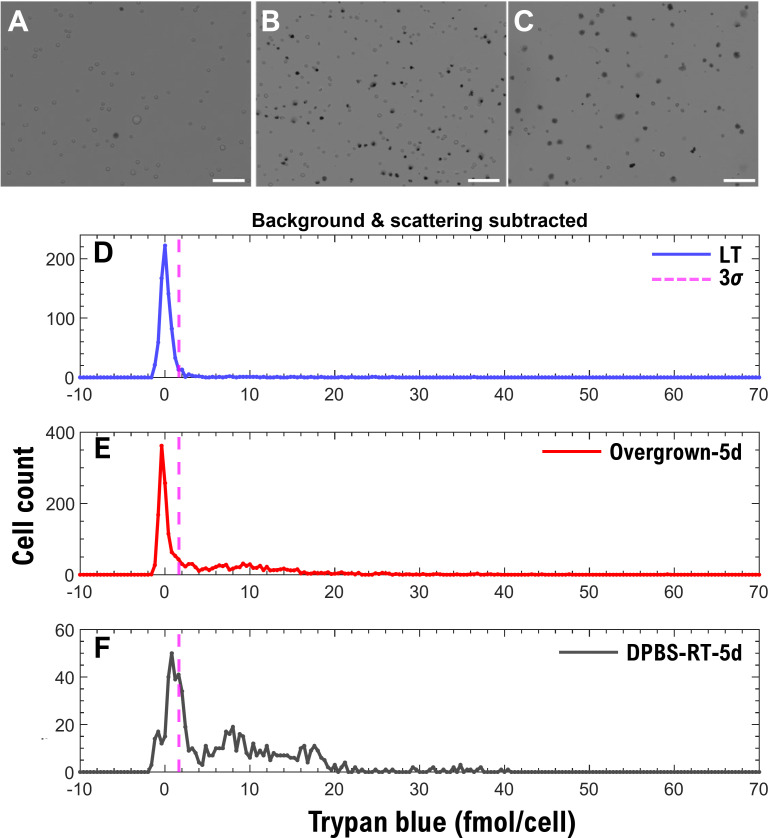
Cell viability, an essential measurement for cell therapy products, lacks traceability. One of the most common cell viability tests is trypan blue dye exclusion where blue-stained cells are counted via brightfield imaging. Typically, live and dead cells are classified based on their pixel intensities which may vary arbitrarily making it difficult to compare results. Herein, a traceable absorbance microscopy method to determine the intracellular uptake of trypan blue is demonstrated. The intensity pixels of the brightfield images are converted to absorbance images which are used to calculate moles of trypan blue per cell. Trypan blue cell viability measurements, where trypan blue content in each cell is quantified, enable traceable live-dead classifications. To implement the absorbance microscopy method, we developed an open-source AbsorbanceQ application that generates quantitative absorbance images. The validation of absorbance microscopy is demonstrated using neutral density filters. Results from four different microscopes demonstrate a mean absolute deviation of 3% from the expected optical density values. When assessing trypan blue-stained Jurkat cells, the difference in intracellular uptake of trypan blue in heat-shock-killed cells using two different microscopes is 3.8%. Cells killed with formaldehyde take up ~50% less trypan blue as compared to the heat-shock-killed cells, suggesting that the killing mechanism affects trypan blue uptake. In a test mixture of approximately 50% live and 50% dead cells, 53% of cells were identified as dead (±6% standard deviation). Finally, to mimic batches of low-viability cells that may be encountered during a cell manufacturing process, viability was assessed for cells that were 1) overgrown in the cell culture incubator for five days or 2) incubated in DPBS at room temperature for five days. Instead of making live-dead classifications using arbitrary intensity values, absorbance imaging yields traceable units of moles that can be compared, which is useful for assuring quality for biomanufacturing processes.


Conflict of interest statement

The authors have declared that no competing interests exist.

Figures

Fig 1
Fig 1. Flow chart outlining three strategies of the image analysis workflow.
As the complexity of the image analysis workflow increases, so does the accuracy of the intracellular content of trypan blue (TB) calculation. Abbreviations: LD = live cells in Dulbecco’s phosphate-buffered saline (DPBS) solution, LT = live cells in TB solution mixed with DPBS at a 1:4 (TB:DPBS) ratio, DD = dead cells in DPBS, DT = dead cells in TB solution mixed with DPBS at a 1:4 ratio (TB:DPBS) and TBLT = TB content in LT sample.
Fig 2
Fig 2. Validation of absorbance microscopy method.
Absorbance microscopy data of ND filters plotted against the measured OD values using a spectrophotometer (average OD at λ = 598 to 622 nm). There is a strong correlation between OD measured by each microscope and the spectrophotometer indicating that the brightfield microscopy can be used to achieve comparable absorbance measurements even when microscopy instruments differ. Imaging was performed using four different microscopes equipped with different cameras and a 610 nm bandpass filter. The error bars represent the standard deviation.
Fig 3
Fig 3. Demonstrating comparability of the absorbance imaging.
(A-C) Using three different microscopes, a brightfield image of an OD = 0.5 neutral density (ND) filter was captured as shown on the left of each panel. Corresponding absorbance images are shown on the right. The average pixel values of intensity and OD are indicated on each image. Microscope 1: Biotek Lionheart FX, Microscope 2: Nikon Ti2; Microscope 3: Zeiss Axiovert S100; Microscopes 1 and 2 yield 16-bit while Microscope 3 yields 8-bit images. (D) Histograms of pixel intensities of the brightfield images do not overlap when imaging the same ND filter, which shows that pixel intensities cannot be used to compare data when using different microscopes. (E) Overlapping histograms of the OD values show that the absorbance microscopy method can be used to compare data collected on different microscopes (the number of pixels in each image presented on the y-axis count was normalized since the image dimensions for each microscope differ). All microscopes were equipped with a 610 nm bandpass filter. Scale bars: 200 μm.
Fig 4
Fig 4. Trypan blue (TB) absorbance measurements.
(A) TB absorbance spectrum in Dulbecco’s phosphate-buffered saline (DPBS) measured using a spectrophotometer. Each data point is an average of three replicates (3 readings of the same cuvette) and error bars are standard deviation (SD). (B) TB absorbance at λ = 610 nm measured using a spectrophotometer (black squares) and absorbance microscopy (gray diamonds). The error bars represent SD (3 readings of the same cuvette). (C) Bland–Altman plot for assessing agreement between two methods presented in panel (B), where the solid black line denotes the bias between the mean differences (Δ) and dashed blue lines indicate ± 1.96 SD, which cover 95% of the values.
Fig 5
Fig 5. Brightfield intensity images and corresponding absorbance images of four Jurkat cell treatments.
(A,B) LD: Live cells in Dulbecco’s phosphate-buffered saline (DPBS) solution; (C,D) LT: Live cells in trypan blue (TB) solution mixed with DPBS at a 1:4 (TB:DPBS) ratio; (E,F) DD: Dead cells in DPBS; (G,H) DT: Dead cells in TB solution mixed with DPBS at a 1:4 ratio (TB:DPBS). Dead cells were produced using the heat-shock cell killing method. Arrowheads in panels C and D indicate a dead cell in the LT sample. The stars in panels D and H indicate the medium which contains TB solution mixed with DPBS at a 1:4 ratio (TB:DPBS) and absorbs light giving it a lighter shade of blue (higher absorbance value as compared to panels B and F). Scale bars: 100 μm.
Fig 6
Fig 6. Determination of intracellular trypan blue (TB) content (mol/cell) using absorbance images.
Absorbance microscopy output data for (A) heat-shock and (B) fixation experiments illustrating the histograms of the intracellular moles of TB using three different image processing strategies: 1) ‘Raw moles,’ 2) ‘Background subtracted,’ and 3) ‘Background & scattering subtracted.’ The far-right column reveals the live and dead cell counts for the control ‘Live and dead cells in TB’ experiment, where an equal number of live and dead cells were mixed in TB+DPBS solution. The arrow in the far-right column denotes the calculated threshold using LT and DT samples using image processing strategy #3. The threshold is used to calculate live cells (cells below the threshold) and dead cells (cells above the threshold). Abbreviations: LD = live cells in Dulbecco’s phosphate-buffered saline (DPBS) solution, LT = live cells in trypan blue (TB) solution mixed with DPBS at a 1:4 (TB:DPBS) ratio, DD = dead cells in DPBS, and DT = dead cells in TB solution mixed with DPBS at a 1:4 ratio (TB:DPBS). The histograms in panels (A) and (B) show that the intracellular uptake of TB is different depending on the cell-killing method.
Fig 7
Fig 7. Trypan blue (TB) measurements in dead Jurkat cells after implementing the “background and scattering subtracted” image processing routine for three different datasets.
Results are presented in (A) mol/cell and (B) mmol/L. Open symbols indicate triplicate experiments (same sample preparation, data acquired on three different days) of heat-shock treatment using Microscope 1 (black circles), heat-shock treatment using Microscope 2 (blue triangles), and fixation treatment using Microscope 1 (red squares). Microscope 1: Biotek Lionheart FX, Microscope 2: Nikon Ti2. The filled symbols represent the mean of three replicates. The error bars represent the standard deviation. The heat-shock killed dead cells uptake twice the TB as compared to the fixed dead cells. P-values from t-tests are shown below brackets.
Fig 8
Fig 8. Percent dead cells of three different experimental conditions of ‘Live and dead cells in TB’ experiment.
Open symbols indicate triplicate experiments (same sample preparation, data acquired on three different days) of heat-shock treatment using Microscope 1 (black circles), heat-shock treatment using Microscope 2 (blue triangles), and fixation treatment using Microscope 1 (red squares). Microscope 1: Biotek Lionheart FX, Microscope 2: Nikon Ti2. The filled symbols represent the mean of three replicates and the corresponding error bars indicate standard deviation. Above the data are P-values from a one-sample t-test (two-tailed) where a low P-value indicates an increased probability that the sample mean is different from the 50% hypothesized value.
Fig 9
Fig 9. Intracellular trypan blue (TB) content (mol/cell) for cells overgrown for five days and cells incubated in DPBS at room temperature for five days.
Brightfield images of (A) LT, (B) ‘Overgrown-5d’ and (C) ‘DPBS-RT-5d’ samples. Absorbance microscopy histograms for (D) LT, (E) ‘Overgrown-5d’ and (F) ‘DPBS-RT-5d’ samples indicate the TB uptake by Jurkat cells (the background TB and scattering are subtracted). Abbreviations: LT = live cells in trypan blue (TB) solution mixed with Dulbecco’s phosphate-buffered saline (DPBS) at a 1:4 (TB:DPBS) ratio. The dashed purple line marks three standard deviations (3σ) for the Gaussian fit of the histogram in panel (D), which serves as a threshold point for counting dead cells in panels (E) and (F). Scale bars: 100 μm.

Similar articles

Cited by

References

    1. Arora D, Babakhanova G, Simon CG. Tissue Engineering Measurands. Acs Biomaterials Science & Engineering. 2020;6(10):5368–76. doi: 10.1021/acsbiomaterials.0c00475 - DOI - PubMed
    1. Bauer SR. Stem Cell-based Products in Medicine: FDA Regulatory Considerations. Handbook of Stem Cells. 2004:805–14. Epub 2007/09/28. doi: 10.1016/B978-012436643-5/50163-2 - DOI
    1. Arcidiacono JA, Bauer SR, Kaplan DS, Allocca CM, Sarkar S, Lin-Gibson S. FDA and NIST collaboration on standards development activities supporting innovation and translation of regenerative medicine products. Cytotherapy. 2018;20(6):779–84. doi: 10.1016/j.jcyt.2018.03.039 - DOI - PubMed
    1. F2739 Standard Guide for Quantifying Cell Viability and Related Attributes within Biomaterial Scaffolds. West Conshohocken, PA: ASTM International; 2019.
    1. ISO 20391–1:2018 Biotechnology—Cell counting—Part 1: General guidance on cell counting methods. International Organization for Standardization.