. 2022 Mar 7;221(3):e202109016.
doi: 10.1083/jcb.202109016. Epub 2022 Jan 19.

A loop extrusion-independent mechanism contributes to condensin I-mediated chromosome shaping

Affiliations

A loop extrusion-independent mechanism contributes to condensin I-mediated chromosome shaping

Kazuhisa Kinoshita et al. J Cell Biol. .

Abstract

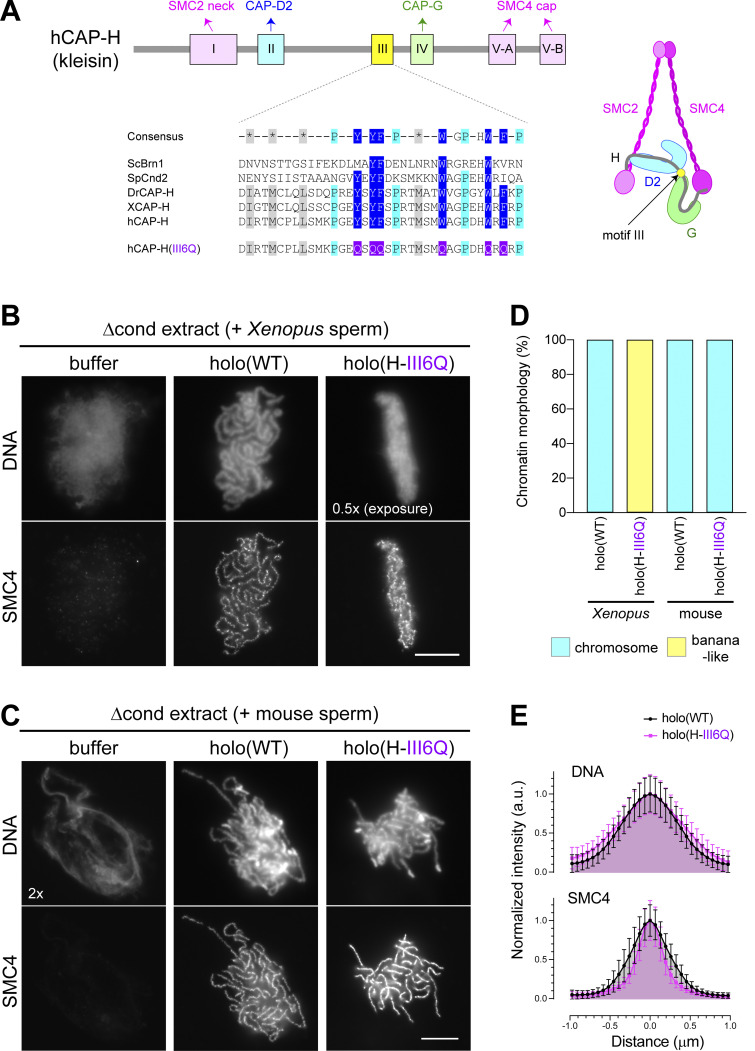
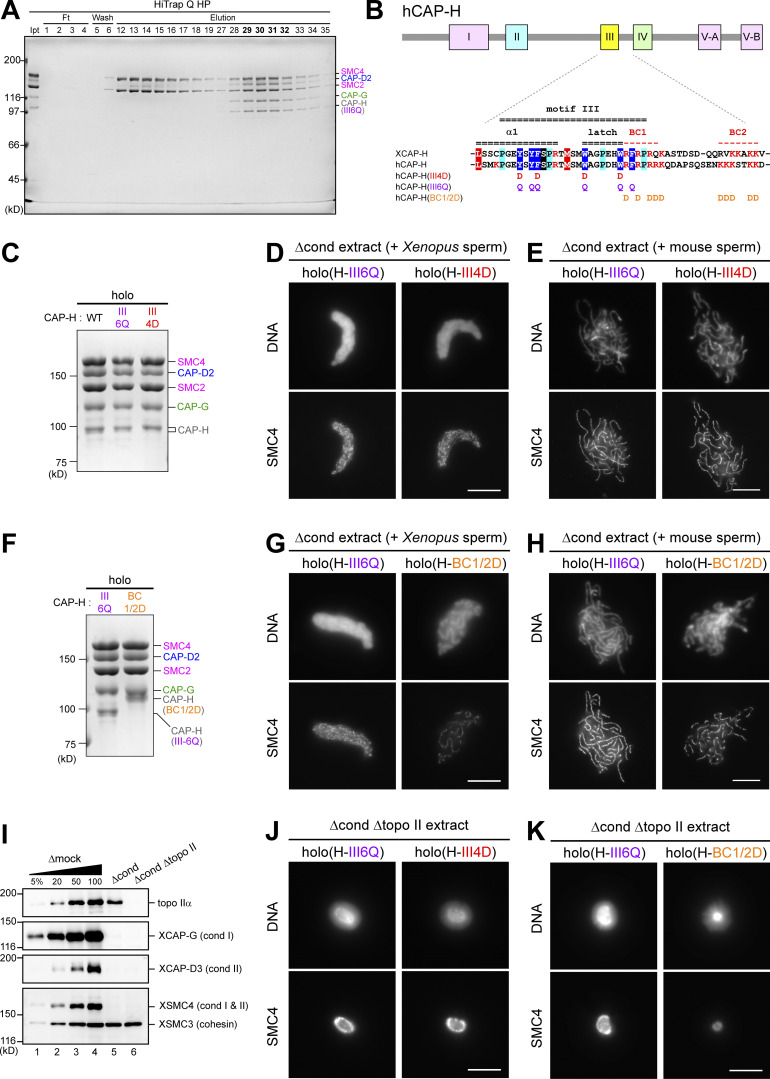
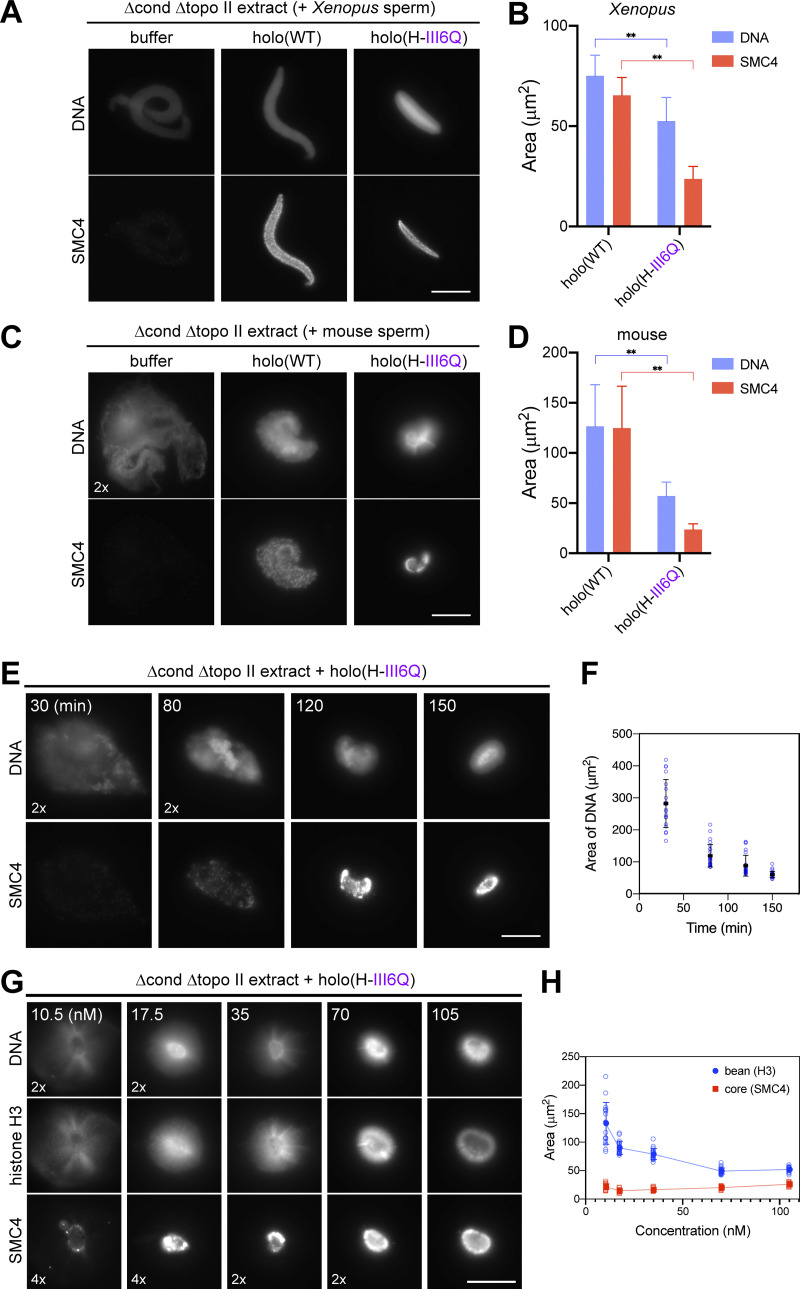
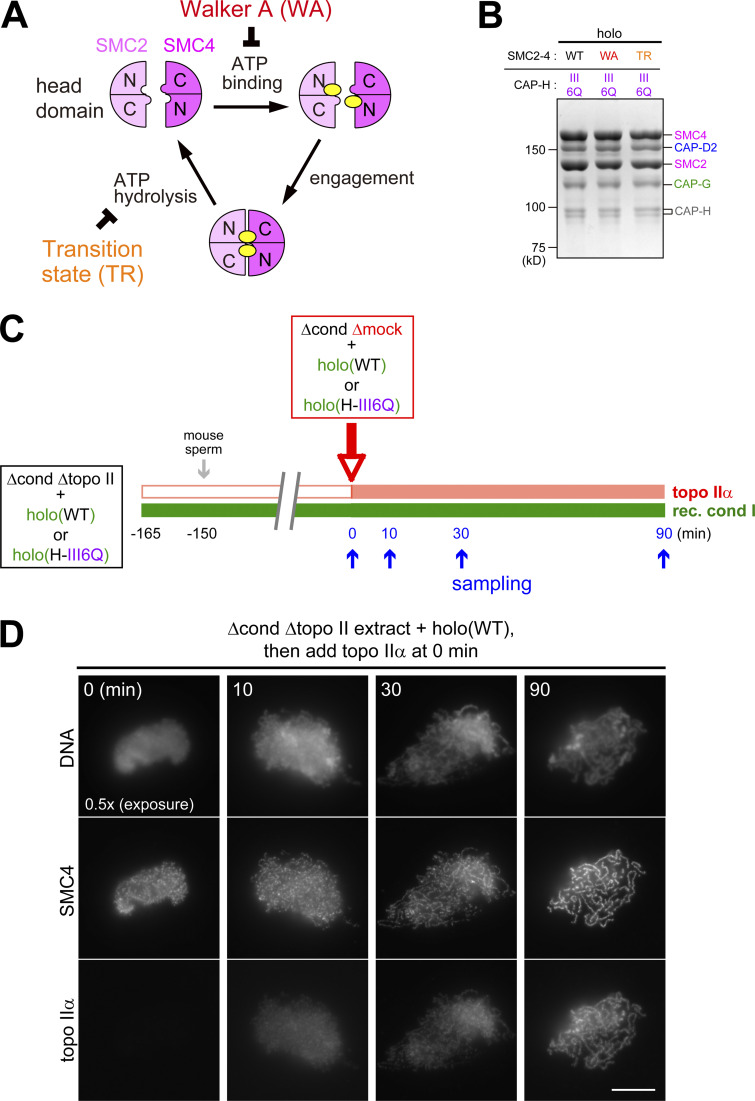
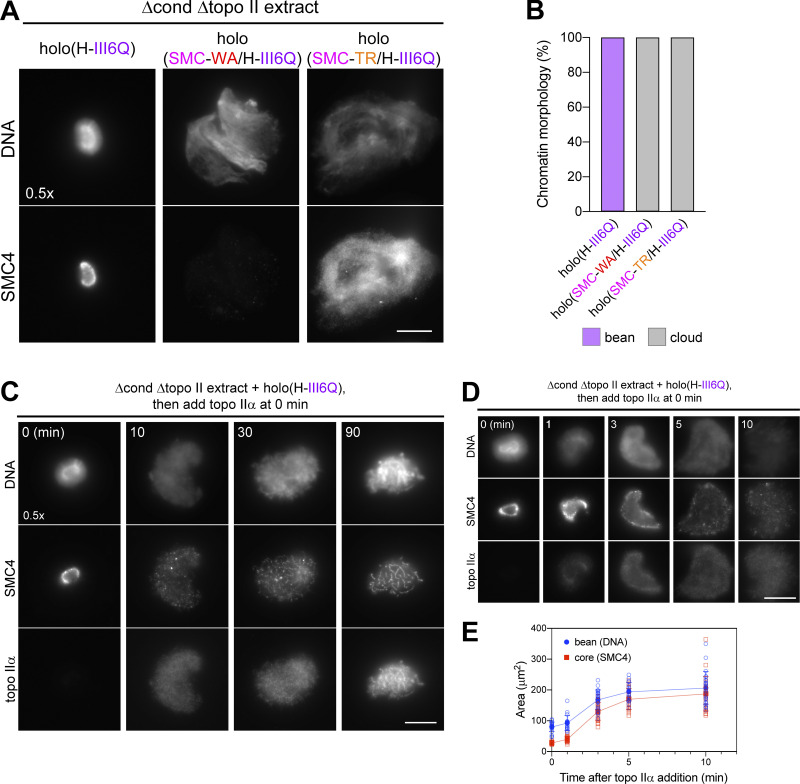
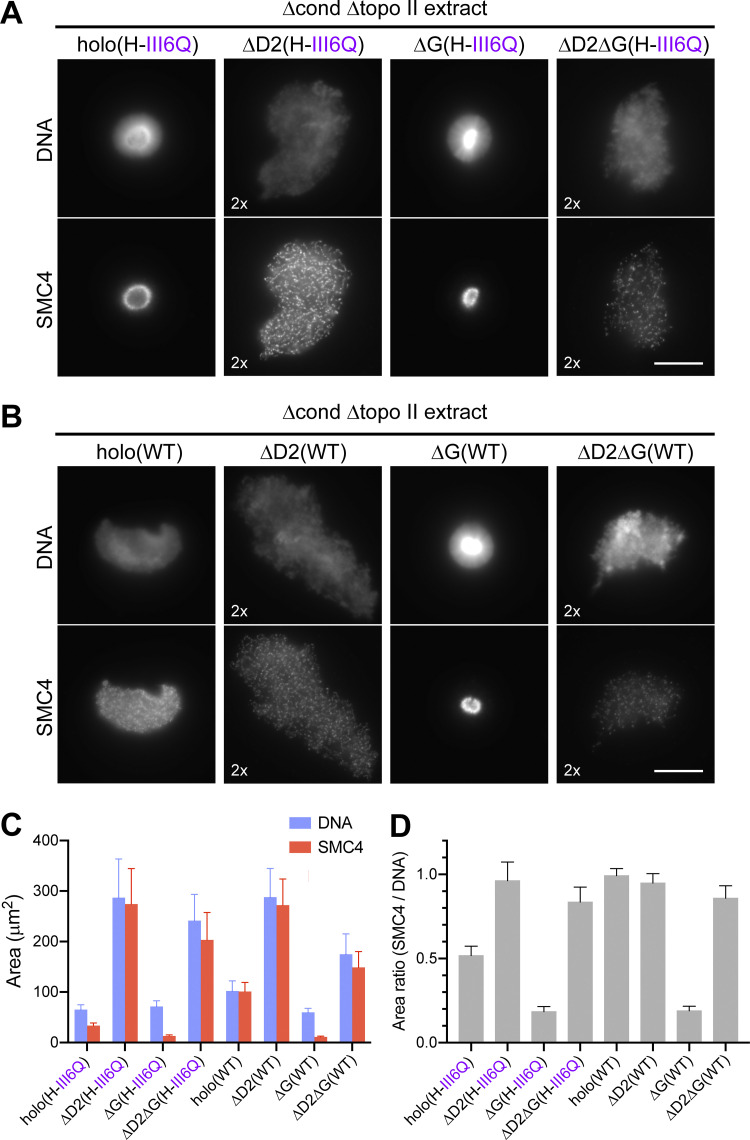
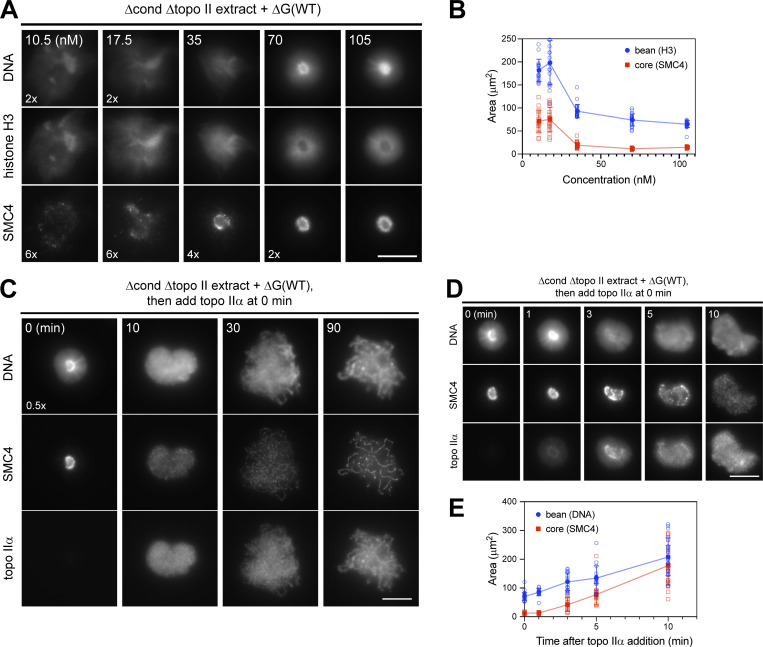
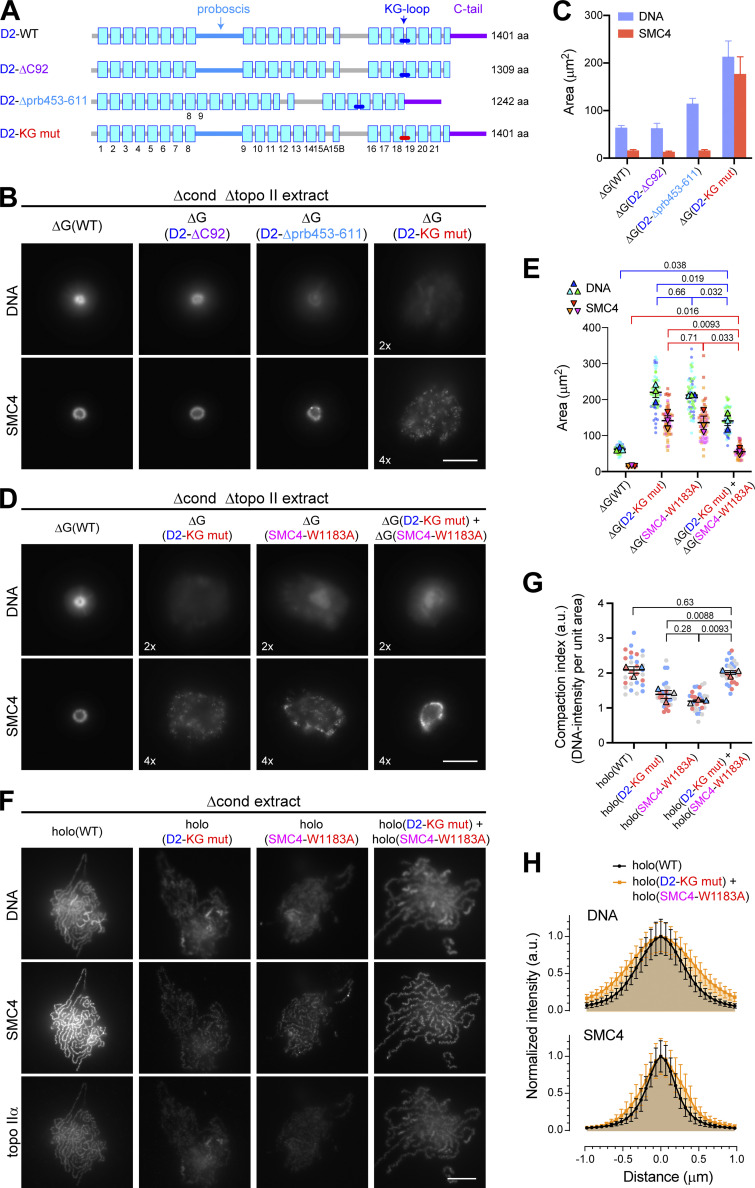
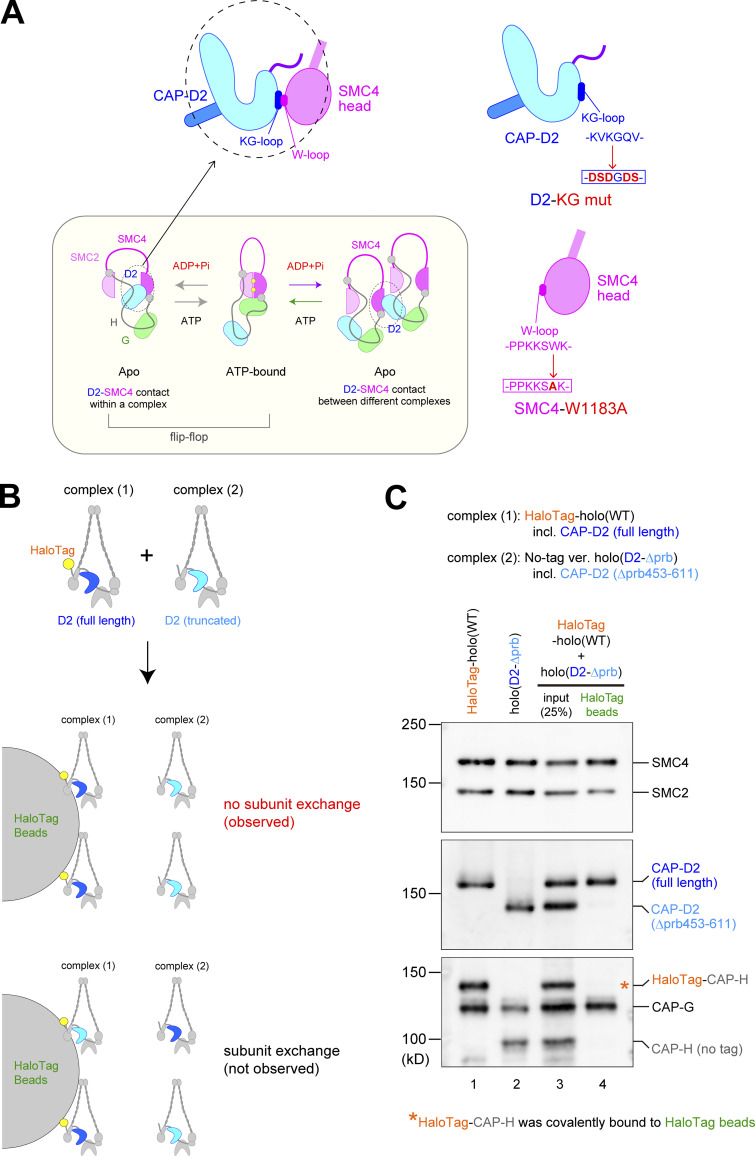
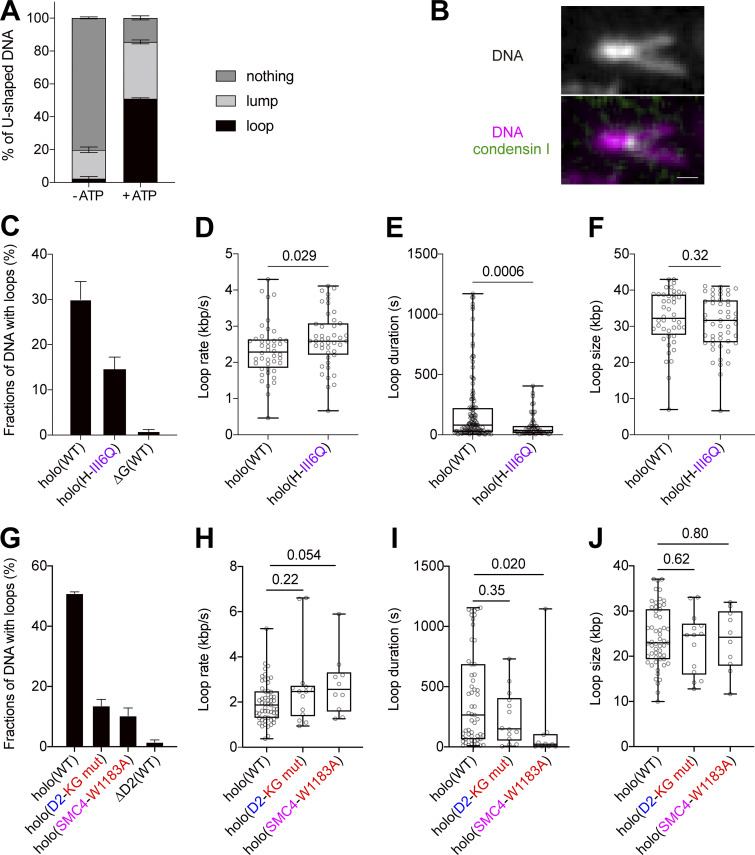
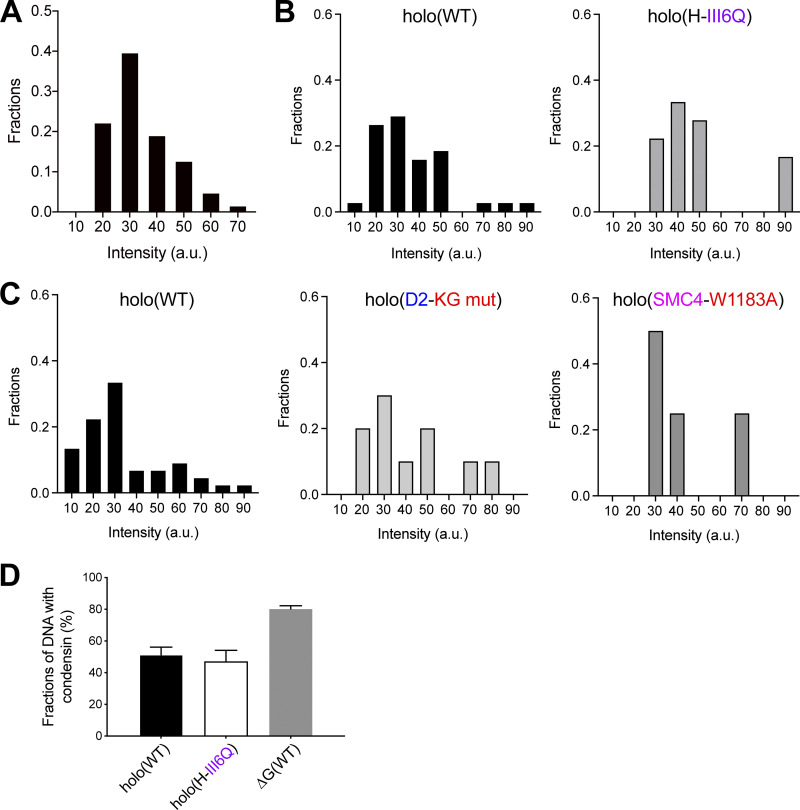
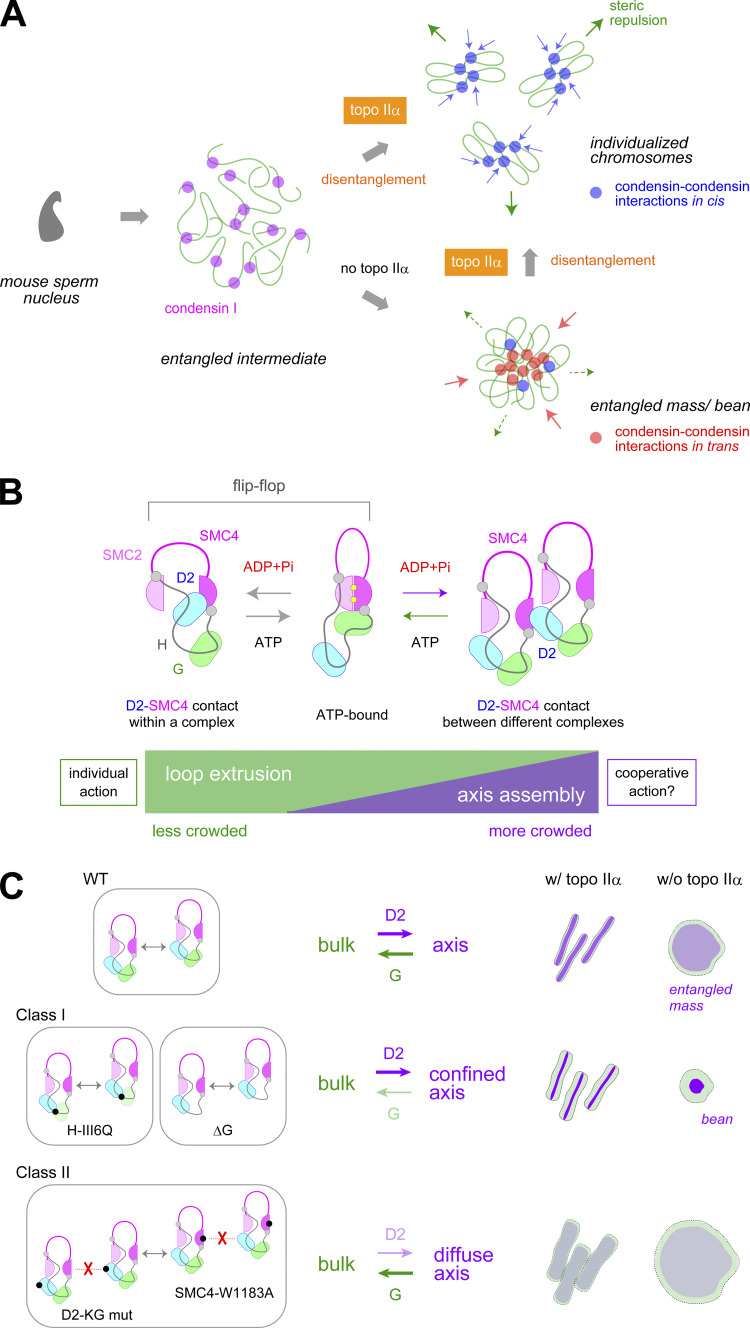
Condensin I is a five-subunit protein complex that is central to mitotic chromosome assembly in eukaryotic cells. Despite recent progress, its molecular mechanisms of action remain to be fully elucidated. By using Xenopus egg extracts as a functional assay, we find that condensin I complexes harboring mutations in its kleisin subunit CAP-H produce chromosomes with confined axes in the presence of topoisomerase IIα (topo IIα) and highly compact structures (termed "beans") with condensin-positive central cores in its absence. The bean phenotype depends on the SMC ATPase cycle and can be reversed by subsequent addition of topo IIα. The HEAT repeat subunit CAP-D2, but not CAP-G, is essential for the bean formation. Notably, loop extrusion activities of the mutant complexes cannot explain the chromosomal defects they exhibit in Xenopus egg extracts, implying that a loop extrusion-independent mechanism contributes to condensin I-mediated chromosome assembly and shaping. We provide evidence that condensin-condensin interactions underlie these processes.


Figures

Figure 1.
Figure 1.
CAP-H motif III mutant complexes assemble chromosomes with confined axes. (A) Domain organization of the CAP-H/kleisin subunit. CAP-H has five motifs that are well conserved among eukaryotic species (motifs I to V). Shown here is a sequence alignment of the CAP-H orthologues from Saccharomyces cerevisiae (ScBrn1), Schizosaccharomyces pombe (SpCnd2), Danio rerio (DrCAP-H), Xenopus laevis (XCAP-H), and human (hCAP-H). Conserved residues are labeled in dark blue (Y/F/W), light blue (P), and gray (I/M/L*). All of the six aromatic residues conserved in motif III were replaced with nonaromatic polar residues, glutamines (Q), to generate the H-III6Q mutations. A cartoon depicting the holocomplex of condensin I is shown on the right. (B) Add-back assay using Xenopus sperm nuclei as a substrate. Xenopus sperm nuclei were incubated with condensin-depleted (Δcond) extracts that had been supplemented with a control buffer (buffer), holo(WT), or holo(H-III6Q). After 120 min, the reaction mixtures were fixed and labeled with an antibody against SMC4. DNA was counterstained with DAPI. The DAPI image of the structure produced by holo(H-III6Q) was taken with a shorter exposure time (0.5x) than the others. The data from a single representative experiment out of four repeats are shown. Scale bar, 10 µm. (C) Add-back assay using mouse sperm nuclei as a substrate. Mouse sperm nuclei were incubated with the same set of extracts as described in B for 150 min and analyzed as above. A different relative exposure time (2x) was used where indicated. The data from a single representative experiment out of three repeats are shown. Scale bar, 10 µm. (D) Chromosome morphology as judged by the DAPI-stained images shown in B and C. In each reaction, the morphology of the final products was highly homogeneous, displaying either “chromosome” or “banana-like” morphology (n = 38, 48, 46, and 43 from left to right). (E) Line profiles of chromosomes assembled from mouse sperm nuclei. The signal intensities of DNA (top) and SMC4 (bottom) of the chromosomes assembled with holo(WT) (black) or holo(H-III6Q) (magenta) were scanned along the lines drawn perpendicular to chromosome axes (n = 20). The mean and SD of 20 lines were plotted as normalized intensities (a.u.). We confirmed that there are significant differences between the holo(WT) and holo(H-III6Q) data after Gaussian curve fitting in both plots (P < 0.05 by extra sum-of-squares F test).
Figure S1.
Figure S1.
Holo(H-III4D) and holo(H-BC1/2D) produce structures similar to those produced by holo(H-III6Q) in the presence or absence of topo IIα. (A) Purification of the condensin I holocomplex harboring the H-III6Q mutations by HiTrap Q HP. Fractions released from a glutathione affinity column were pooled and subjected to a HiTrap Q HP column. Protein samples at each step were subjected to SDS-PAGE, and the gel was stained with Coomassie brilliant blue (CBB; input [ipt]; flowthrough [Ft]; wash fractions [Wash]; elution fractions [Elution]). Peak fractions (elution fractions 29–32) were pooled, concentrated, aliquoted, and stored at −80°C. (B) The III4D and BC1/2D mutations of CAP-H. The III4D mutations of CAP-H were an equivalent to the ϕD mutations of budding yeast Brn1 that were designed by Kschonsak et al. (2017). BC1 and BC2, positively charged patches present in motif III, were identified as subregions that are required for DNA binding by the CAP-H/Brn1 subunit (Kschonsak et al., 2017). The BC1/2D mutations were created by substituting all basic residues (K/R) conserved in BC1 and BC2 with aspartic acid residues (D). (C) The WT and two motif III mutant complexes (H-III6Q and H-III4D) were purified and subjected to SDS-PAGE. The gel was stained with CBB. (D) Add-back assay using Xenopus sperm nuclei as a substrate. Xenopus sperm nuclei were incubated with condensin-depleted (Δcond) extracts that had been supplemented with holo(H-III6Q) or holo(H-III4D). After 120 min, the reaction mixtures were fixed and labeled with an antibody against SMC4. DNA was counterstained with DAPI. Scale bar, 10 µm. (E) Add-back assay using mouse sperm nuclei as a substrate. Mouse sperm nuclei were incubated with the same set of extracts as described in D for 150 min and analyzed as above. Scale bar, 10 µm. (F) Holo(H-III6Q) and holo(H-BC1/2D) were purified and subjected to SDS-PAGE. The gel was stained with CBB. (G) Add-back assay using Xenopus sperm nuclei as a substrate. Xenopus sperm nuclei were incubated with condensin-depleted (Δcond) extracts that had been supplemented with holo(H-III6Q) or holo(H-BC1/2D). After 120 min, the reaction mixtures were fixed and labeled with an antibody against SMC4. DNA was counterstained with DAPI. We noticed that the banana-shaped structures produced by holo(H-BC1/2D) were slightly thicker than those produced by holo(H-III6Q). Scale bar, 10 µm. (H) Add-back assay using mouse sperm nuclei as a substrate. Mouse sperm nuclei were incubated with the same set of extracts as described in G for 150 min and analyzed as above. We noticed that the axis structures produced by holo(H-BC1/2D) were less continuous than those produced by holo(H-III6Q). Scale bar, 10 µm. (I) Immunodepletion. Xenopus egg extracts were immunodepleted with control IgG (Δmock), antibodies against condensin subunits (Δcond), or a mixture of antibodies against condensin subunits and topo IIα (Δcond Δtopo II; see Materials and methods for details). To estimate the efficiency of immunodepletion, an aliquot of each extract along with decreasing amounts of the Δmock extract (100, 50, 20, and 5%) were analyzed with the antibodies indicated. Xenopus SMC3 (XSMC3), a subunit of the cohesin complex, was used as a loading control. (J) Topo II–depleted add-back assay using mouse sperm nuclei as a substrate. Mouse sperm nuclei were incubated with Δcond Δtopo II extracts that had been supplemented with holo(H-III6Q) or holo(H-III4D). After 150 min, the reaction mixtures were fixed and labeled with an antibody against SMC4. DNA was counterstained with DAPI. Scale bar, 10 µm. (K) Topo II–depleted add-back assay using mouse sperm nuclei as a substrate. Mouse sperm nuclei were incubated with Δcond Δtopo II extracts that had been supplemented with holo(H-III6Q) or holo(H-BC1/2D) for 150 min and analyzed as above. Scale bar, 10 µm.
Figure 2.
Figure 2.
CAP-H motif III mutant complexes produce “beans” in the absence of topo IIα. (A) Topo II–depleted add-back assay. Xenopus sperm nuclei were incubated with extracts depleted of both condensins and topo IIα (Δcond Δtopo II) that had been supplemented with a control buffer, holo(WT), or holo(H-III6Q). After 120 min, the reaction mixtures were fixed and labeled with an antibody against SMC4. DNA was counterstained with DAPI. The data from a single representative experiment out of three repeats are shown. Scale bar, 10 µm. (B) Quantification of DNA-positive (shown in blue) and SMC4-positive (shown in red) areas in the chromatin structures shown in A. The mean and SD are shown (n = 30, 27 from left to right). **, P < 0.01 by a two-tailed Mann-Whitney U test. (C) Topo II–depleted add-back assay. Mouse sperm nuclei were incubated with the same set of extracts as described in A for 150 min and analyzed as above. A different relative exposure time (2x) was used where indicated. The data from a single representative experiment out of three repeats are shown. Scale bar, 10 µm. (D) Quantification of DNA-positive (shown in blue) and SMC4-positive (shown in red) areas in the chromatin structures shown in C. The mean and SD are shown (n = 25, 34 from left to right). **, P < 0.01 by a two-tailed Mann-Whitney U test. (E) Time course of bean formation. Mouse sperm nuclei were incubated with a Δcond Δtopo II extract that had been supplemented with holo(H-III6Q). Aliquots were taken at the time points indicated, fixed, and analyzed as in C. Different relative exposure times were used wherever indicated (2x). Scale bar, 10 µm. (F) Quantification of DNA-positive areas in the chromatin structures shown in E. The mean and SD are shown (n = 20, 26, 26, and 29 from 30 to 150 min). (G) Titration experiment. Mouse sperm nuclei were incubated with Δcond Δtopo II extracts that had been supplemented with the indicated concentrations of holo(H-III6Q). After 150 min, the reaction mixtures were fixed and labeled with antibodies against histone H3 and SMC4. DNA was counterstained with DAPI. Different relative exposure times were used wherever indicated (2x or 4x). Scale bar, 10 µm. (H) Quantification of histone H3-positive (bean, shown in blue) and SMC4-positive (core, shown in red) areas in the structures shown in G. The mean and SD are shown (n = 17, 19, 20, 25, and 19 from 10.5 to 105 nM).
Figure S2.
Figure S2.
SMC ATPase cycle mutations and subsequent addition of topo IIα to topo II–depleted extracts. (A) A schematic view of the SMC ATPase cycle. Two ATP molecules are sandwiched between the head domains of SMC2 and SMC4, and engagement of the ATP-bound head domains triggers ATP hydrolysis. The Walker A mutations (WA) block ATP binding, whereas the transition state mutations (TR) greatly slow the rate of ATP hydrolysis. (B) The H-III6Q mutant holocomplexes harboring WT or ATPase mutations (WA or TR) in the SMC2–4 subunits were purified and subjected to SDS-PAGE. The gel was stained with CBB. (C) Experimental procedure for subsequent add-back of topo IIα. Extracts depleted of both condensins and topo IIα (Δcond Δtopo II) were supplemented with holo(WT) or holo(H-III6Q) at −165 min. After 15-min preincubation, mouse sperm nuclei were incubated with the extracts for 150 min to form chromatin masses or beans, respectively. Then Δcond extracts that had been supplemented with holo(WT) or holo(H-III6Q) were added at 0 min. Aliquots were taken at the time intervals indicated, fixed, and processed for immunofluorescence. (D) Add-back of topo IIα after chromatin mass formation. A reaction with holo(WT) was set up as described in C. Aliquots were taken at the time intervals indicated, fixed, and processed for immunofluorescence with antibodies against SMC4 and topo IIα. DNA was counterstained with DAPI. The DAPI image of the structure produced at 0 min was taken with a shorter exposure time (0.5x) than the others. Scale bar, 10 µm.
Figure 3.
Figure 3.
The bean phenotype depends on the SMC ATPase cycle and can be reversed by subsequent addition of topo IIα. (A) Topo II–depleted add-back assay. Mouse sperm nuclei were incubated with Δcond Δtopo II extracts that had been supplemented with holo(H-III6Q), holo(SMC-WA/H-III6Q), or holo(SMC-TR/H-III6Q). After 150 min, the reaction mixtures were fixed and labeled with an antibody against SMC4. DNA was counterstained with DAPI. A different relative exposure time (0.5x) was used where indicated. Scale bar, 10 µm. (B) Chromosome morphology as judged by the DAPI-stained images shown in A. In each reaction, the morphology of the final products was highly homogeneous, displaying either “bean” or “cloud” morphology (n = 28, 13, and 14 from left to right). (C) Add-back of topo IIα after bean formation. Mouse sperm nuclei were mixed with a Δcond Δtopo II extract that had been supplemented with holo(H-III6Q) and incubated for 150 min to assemble beans. A Δcond extract (containing native Xenopus topo IIα) that had been supplemented with holo(H-III6Q) was then added at time 0 min (Fig. S2 C). Aliquots were taken at the time points indicated, fixed, and labeled with antibodies against SMC4 and topo IIα. DNA was counterstained with DAPI. A different relative exposure time (0.5x) was used where indicated. Scale bar, 10 µm. (D) Add-back of topo IIα after bean formation. The same assembly mixture was set up as in C, but aliquots were taken at the earlier time points indicated and analyzed as above. Scale bar, 10 µm. (E) Quantification of DNA-positive (bean, shown in blue) and SMC4-positive (core, shown in red) areas in the structures shown in D. The mean and SD are shown (n = 21, 19, 23, 18, and 23 from 0 to 10 min).
Figure 4.
Figure 4.
The bean phenotype depends on CAP-D2 but not on CAP-G. (A) Topo II–depleted add-back assay using subcomplexes harboring the H-III6Q mutations. Mouse sperm nuclei were incubated with Δcond Δtopo II extracts that had been supplemented with holo(H-III6Q), ΔD2(H-III6Q), ΔG(H-III6Q), or ΔD2ΔG(H-III6Q). After 150 min, the reaction mixtures were fixed and labeled with an antibody against SMC4. DNA was counterstained with DAPI. Different relative exposure times were used wherever indicated (2x). Scale bar, 10 µm. (B) Topo II–depleted add-back assay using subcomplexes without the H-III6Q mutations. Mouse sperm nuclei were incubated with Δcond Δtopo II extracts that had been supplemented with holo(WT), ΔD2(WT), ΔG(WT), or ΔD2ΔG(WT) for 150 min and analyzed as in A. Different relative exposure times were used wherever indicated (2x). Scale bar, 10 µm. (C) Quantification of DNA-positive (bean, shown in blue) and SMC4-positive (core, shown in red) areas in the structures shown in A and B. The mean and SD are shown (n = 28, 26, 30, 22, 29, 29, 30, and 27 from left to right). (D) Comparison of the ratio of SMC4-positive to DNA-positive areas measured in C. The mean and SD are shown.
Figure S3.
Figure S3.
Additional characterization of ΔG(WT)-mediated bean formation. (A) Titration of ΔG(WT) in a topo II–depleted add-back assay. Mouse sperm nuclei were incubated with Δcond Δtopo II extracts that had been supplemented with the indicated concentrations of ΔG(WT). After 150 min, the reaction mixtures were fixed and labeled with antibodies against histone H3 and SMC4. DNA was counterstained with DAPI. Different relative exposure times were used wherever indicated (2x, 4x, or 6x). Scale bar, 10 µm. (B) Quantification of histone H3-positive (bean, shown in blue) and SMC4-positive (core, shown in red) areas in the structures shown in A. The mean and SD are shown (n = 17, 20, 24, 21, and 25 from 10.5 to 105 nM). (C) Add-back of topo IIα after bean formation by ΔG(WT). Mouse sperm nuclei were mixed with a Δcond Δtopo II extract had been supplemented with ΔG(WT) and incubated for 150 min to form beans. A Δcond extract that had been supplemented with ΔG(WT) was added at 0 min. Aliquots were taken at the time points indicated, fixed, and processed for immunofluorescence with antibodies against SMC4 and topo IIα. DNA was counterstained with DAPI. A different relative exposure time (0.5x) was used where indicated. Scale bar, 10 µm. (D) Add-back of topo IIα after bean formation by ΔG(WT). The same assembly mixture was set up as in C, but aliquots were taken at the earlier time points indicated and analyzed as above. Scale bar, 10 µm. (E) Quantification of DNA-positive (bean, shown in blue) and SMC4-positive (core, shown in red) areas in the structures shown in D. The mean and SD are shown (n = 28, 15, 17, 18, and 21 from 0 to 10 min).
Figure 5.
Figure 5.
A contact between CAP-D2 and SMC4 is essential for proper chromosome assembly and shaping. (A) Mutagenesis of the CAP-D2 subunit. The light blue box indicates a HEAT repeat unit. The D2-ΔC92 mutant lacks a 92-aa-long C-terminal tail of CAP-D2, which is intrinsically disordered. The D2-Δprb453-611 lacks a helical insertion domain, called “proboscis,” that is located between the HEAT repeat motifs 8 and 9. The D2-KG mut has substitution mutations (from KVKGQV to DSDGDS) in the KG-loop that is located between the HEAT repeat motifs 18 and 19 (see also Fig. S4 A). (B) Topo II–depleted add-back assay using ΔG subcomplexes harboring the CAP-D2 mutations. Mouse sperm nuclei were incubated with Δcond Δtopo II extracts that had been supplemented with ΔG(WT), ΔG(D2-ΔC92), ΔG(D2-Δprb453-611), or ΔG(D2-KG mut). After 150 min, the reaction mixtures were fixed and labeled with an antibody against SMC4. DNA was counterstained with DAPI. Different relative exposure times were used wherever indicated (2x or 4x). Scale bar, 10 µm. (C) Quantification of DNA-positive (bean, shown in blue) and SMC4-positive (core, shown in red) areas in the structures shown in B. The mean and SD are shown (n = 34, 28, 24, and 27 from left to right). (D) Topo II–depleted add-back assay using ΔG subcomplexes harboring D2-KG mut or SMC4-W1183A. Mouse sperm nuclei were incubated with Δcond Δtopo II extracts that had been supplemented with ΔG(WT), ΔG(D2-KG mut), or ΔG(SMC4-W1183A) at a concenttraion of 35 nM, or a mixture of ΔG(D2-KG mut) and ΔG(SMC4-W1183A) at a concentration of 17.5 nM each. After 150 min, the reaction mixtures were fixed and labeled with an antibody against SMC4. DNA was counterstained with DAPI. Different relative exposure times were used wherever indicated (2x or 4x). The data from a single representative experiment out of three replicates are shown. Scale bar, 10 µm. (E) Quantification of DNA-positive and SMC4-positive areas in the structures shown in D. Three biological replicates are color coded. For DNA-positive areas, data points are shown by the dots (blue, cyan, or green), and averages from individual experiments are shown by the triangles with the corresponding colors. For SMC4-positive areas, data points are shown by the dots (red, orange, or magenta), and averages from individual experiments are shown by the inverted triangles with the corresponding colors. Error bars represent SEM from n = 3 independent experiments, in each of which 20 chromatin masses were analyzed. The P values were assessed by a paired two-tailed t test. (F) Add-back assay using holocomplexes harboring D2-KG mut or SMC4-W1183A. Mouse sperm nuclei were incubated with Δcond extracts that had been supplemented with holo(WT), holo(D2-KG mut), or holo(SMC4-W1183A) at a concentration of 35 nM, or a mixture of holo(D2-KG mut) and holo(SMC4-W1183A) at a concentration of 17.5 nM each. After 150 min, the reaction mixtures were fixed and labeled with antibodies against SMC4 and topo IIα. DNA was counterstained with DAPI. The data from a single representative experiment out of three replicates are shown. Scale bar, 10 µm. (G) Quantification of the ratio of DNA intensity to DNA-positive area in the structures shown in F. Three biological replicates are color coded. Data points are shown by the dots (blue, red, or gray), and averages from individual experiments are shown by the triangles with the corresponding colors. Error bars represent SEM from n = 3 independent experiments, in each of which 10 clusters of chromosomes were analyzed. The P values were assessed by a paired two-tailed t test. (H) Line profiles of chromosomes assembled with holo(WT) (black) or a mixture of holo(D2-KG mut) and holo(SMC4-W1183A) (orange) shown in F. The signal intensities of DNA (top) and SMC4 (bottom) were scanned along the lines drawn perpendicular to chromosome axes (n = 20). The mean and SD of 20 lines were plotted as normalized intensities (a.u.).
Figure S4.
Figure S4.
The D2-SMC4 contact mutations and evidence for the lack of subunit–subunit exchange in the mixing experiment. (A) A schematic view of the D2-SMC4 contact originally reported by Hassler et al. (2019), in which the KG-loop of CAP-D2/Ycs4 and the W-loop of SMC4/Smc4 make a contact in the absence of ATP (Hassler et al., 2019; left, top). Upon ATP binding, CAP-D2 is released from SMC4, allowing ATP-dependent engagement between the SMC2 and SMC4 head domains. Together with cryo-EM studies, a so-called flip-flop mechanism of the condensin reaction cycle has been proposed (Lee et al., 2020; left, bottom). In the present study, we hypothesize that, under crowded conditions, the D2-SMC4 contact could occur not only within individual complexes but also between different complexes. The KG-loop mutations (KG mut) of CAP-D2 and the W-loop mutation (W1183A) of SMC4 were designed (right) based on the corresponding yeast mutations reported by Hassler et al. (2019). (B) Experimental design to rule out the possibility that the partial rescue observed in the mixing experiment (Fig. 5) was caused by subunit exchange between the two different input complexes. A mixture of complexes 1 and 2 (see Materials and methods for details) was incubated with egg extracts (Δcond extract) under the same condition as the standard add-back assay, and the Halo-tagged CAP-H was recovered on the Magne HaloTag Beads. If no subunit exchange occurred in the egg extracts, the truncated version of CAP-D2 would not be recovered on the beads (no subunit exchange). If subunit exchange occurred in the egg extracts, the truncated version in addition to the full-length version of CAP-D2 would be recovered on the beads (subunit exchange). (C) Experimental result. Two purified complexes (lanes 1 and 2), a mixture of the two complexes in Δcond extract (lane 3) and a HaloTag bead-bound fraction recovered from the mixture (lane 4), were subjected to SDS-PAGE followed by immunoblotting with the antibodies indicated. We found that the full-length CAP-D2 present in the HaloTag-conjugated complex 1 was efficiently recovered, whereas the truncated version of CAP-D2 present in complex 2 was barely detectable in the bead-bound fraction. Likewise, the untagged version of CAP-H present in complex 2 was not recovered. (Note that the HaloTag-conjugated CAP-H in complex 1 was not detectable in lane 4, because it was covalently bound to the HaloTag beads.) This result demonstrated that subunit exchange between different condensin complexes barely occurs in egg extracts under our experimental condition.
Figure 6.
Figure 6.
Loop extrusion activities of the condensin I mutant complexes. (A) Frequency of DNA loop formation by holo(WT) in the presence or absence of ATP (n = 3; ≥42 DNAs per condition; mean ± SEM). A nonloop compact structure of DNA observed regardless of the presence or absence of ATP was categorized as the “lump.” (B) Still image of DNA loop formed by holo(WT). Scale bar, 1 µm. (C) Frequency of DNA loop formation by holo(WT), holo(H-III6Q), or ΔG(WT) (n = 5; ≥61 DNAs per condition; mean ± SEM). (D) Loop extrusion rate by holo(WT) or holo(H-III6Q) (from five independent experiments; n = 44, 44 from left to right). The P values were assessed by a two-tailed Mann-Whitney U test. (E) Duration time to maintain DNA loops by holo(WT) or holo(H-III6Q) (from five independent experiments; n = 135, 62 from left to right). The P values were assessed by a two-tailed Mann-Whitney U test. The median values for holo(WT) and holo(H-III6Q) are 80 s and 35 s, respectively. (F) Loop size produced by holo(WT) or holo(H-III6Q) (from five independent experiments; n = 44, 49 from left to right). The P values were assessed by a two-tailed Mann-Whitney U test. (G) Frequency of DNA loop formation by holo(WT), holo(D2-KG mut), holo(SMC4-W1183A), or ΔD2(WT) (n = 3; ≥43 DNAs per condition; mean ± SEM). (H) Loop extrusion rate by holo(WT), holo(D2-KG mut), or holo(SMC4-W1183A) (from three independent experiments; n = 55, 14, and 10 from left to right). The P values were assessed by a two-tailed Mann-Whitney U test. (I) Duration time to maintain DNA loops by holo(WT), holo(D2-KG mut), or holo(SMC4-W1183A) (from three independent experiments, n = 55, 14, and 10 from left to right). The P values were assessed by a two-tailed Mann-Whitney U test. (J) Loop size produced by holo(WT), holo(D2-KG mut), or holo(SMC4-W1183A) (from three independent experiments; n = 55, 14, and 10 from left to right). The P values were assessed by a two-tailed Mann-Whitney U test.
Figure S5.
Figure S5.
Additional information on the loop extrusion assay. (A) Fluorescence intensity distribution of labeled holo(WT). Time traces of the condensin intensity were taken from a bleaching experiment. Shown here is the distribution of the intensities that were bleached in one step. 61 particles were analyzed in total. (B) Fluorescence intensity distribution of holo(WT) or holo(H-III6Q) signals localized at the base of loops (from five independent experiments, n = 40 [holo[WT]] and 22 [holo[H-III6Q]]). (C) Fluorescence intensity distribution of holo(WT), holo(D2-KG mut), or holo(SMC4-W1183A) signals localized at the base of loops (from three independent experiments, n = 52 [holo[WT]], 14 [holo[D2-KG mut]], and 8 [holo[SMC4-W1183A]]). (D) Fractions of DNA with condensin bound in the first set of experiments shown in Fig. 6 C (from five independent experiments, n = 427 [holo[WT]], 423 [holo[H-III6Q]], and 543 [ΔG[WT]]; mean ± SEM).
Figure 7.
Figure 7.
Models for condensin I–mediated chromosome assembly and shaping. (A) Chromosomal DNAs are entangled with each other within the mouse sperm nucleus. Upon incubation with a Xenopus egg extract, the nucleus rapidly swells following protamine release, and condensin I binds to entangled chromatin fibers. Topo IIα collaborates with condensin I to disentangle chromatin fibers, ensuring that the condensin–condensin interactions occur only in cis (within individual chromosomes). Steric repulsion between the loops, caused by condensin-mediated loop extrusion, further facilitates the individualization process. In the absence of topo IIα, no disentanglement is catalyzed, and the condensin–condensin interactions occur not only in cis but also in trans (between different chromosomes), producing an entangled chromatin mass or a bean. (B) According to the flip-flop mechanism proposed by Lee et al. (2020), CAP-G is mobile when CAP-D2 makes a contact with SMC4 in the absence of ATP (left). However, CAP-D2 becomes mobile when the SMC heads are engaged in the presence of ATP (center). This mechanism may underlie ATP-dependent loop extrusion supported by individual condensin complexes. We hypothesize that, under crowded conditions, the D2-SMC4 contact could also occur between different condensin complexes to facilitate chromosome axis assembly (right). (C) In the case of the WT holocomplex, balancing acts of the CAP-D2 and CAP-G subunits support the assembly of chromosome axes (Kinoshita et al., 2015). In the case of the mutant complex harboring H-III6Q or ΔG (class I), D2-dependent condensin–condensin interactions dominate over loop extrusion, producing confined axes. In the case of the mutant complex harboring D2-KG mut or SMC4-W1183A (class II), the D2-dependent condensin–condensin interactions are compromised, producing diffuse axes. When the two mutant complexes are mixed together, the interactions are partially restored (inset, gray double arrow), producing nearly normal yet slightly thick chromosomes. In the absence of topo IIα (far right), no individualization occurs, and the WT and mutant complexes behave accordingly to produce entangled masses (or beans) of different sizes.

Similar articles

Cited by

References

    1. Alipour, E., and Marko J.F.. 2012. Self-organization of domain structures by DNA-loop-extruding enzymes. Nucleic Acids Res. 40:11202–11212. 10.1093/nar/gks925 - DOI - PMC - PubMed
    1. Bayliss, R., Littlewood T., and Stewart M.. 2000. Structural basis for the interaction between FxFG nucleoporin repeats and importin-β in nuclear trafficking. Cell. 102:99–108. 10.1016/S0092-8674(00)00014-3 - DOI - PubMed
    1. Bayliss, R., Littlewood T., Strawn L.A., Wente S.R., and Stewart M.. 2002. GLFG and FxFG nucleoporins bind to overlapping sites on importin-β. J. Biol. Chem. 277:50597–50606. 10.1074/jbc.M209037200 - DOI - PubMed
    1. Cheng, T.M., Heeger S., Chaleil R.A., Matthews N., Stewart A., Wright J., Lim C., Bates P.A., and Uhlmann F.. 2015. A simple biophysical model emulates budding yeast chromosome condensation. eLife. 4:e05565. 10.7554/eLife.05565 - DOI - PMC - PubMed
    1. Davidson, I.F., Bauer B., Goetz D., Tang W., Wutz G., and Peters J.M.. 2019. DNA loop extrusion by human cohesin. Science. 366:1338–1345. 10.1126/science.aaz3418 - DOI - PubMed

Publication types

MeSH terms