. 2022 Mar 23;96(6):e0131121.
doi: 10.1128/JVI.01311-21. Epub 2022 Jan 19.

Microglia Activate Early Antiviral Responses upon Herpes Simplex Virus 1 Entry into the Brain to Counteract Development of Encephalitis-Like Disease in Mice

Affiliations

Microglia Activate Early Antiviral Responses upon Herpes Simplex Virus 1 Entry into the Brain to Counteract Development of Encephalitis-Like Disease in Mice

Georgios Katzilieris-Petras et al. J Virol. .

Abstract

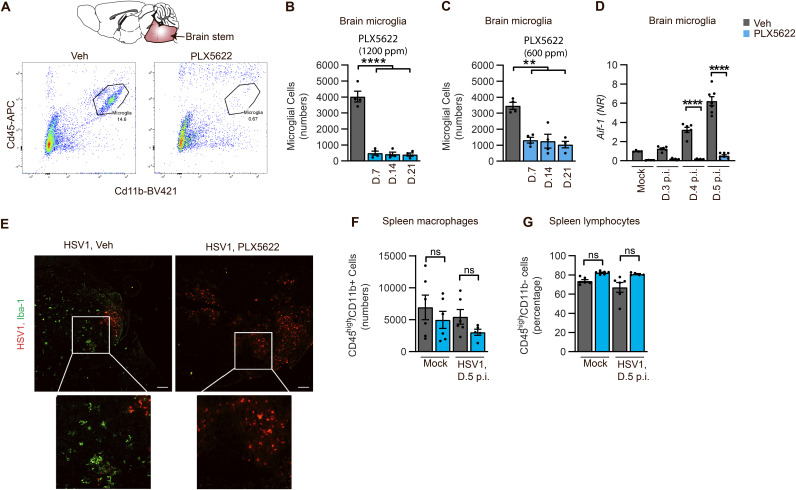
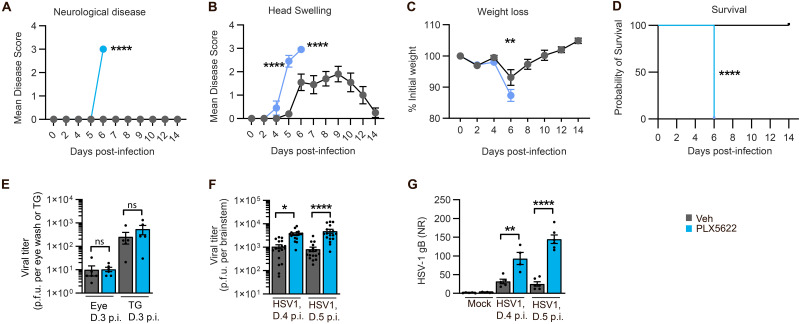
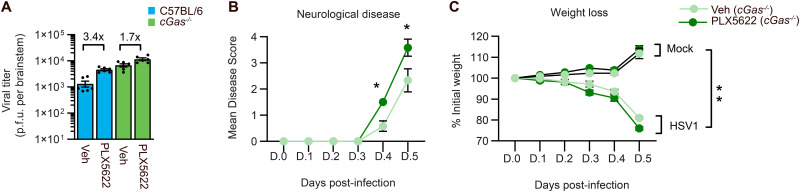
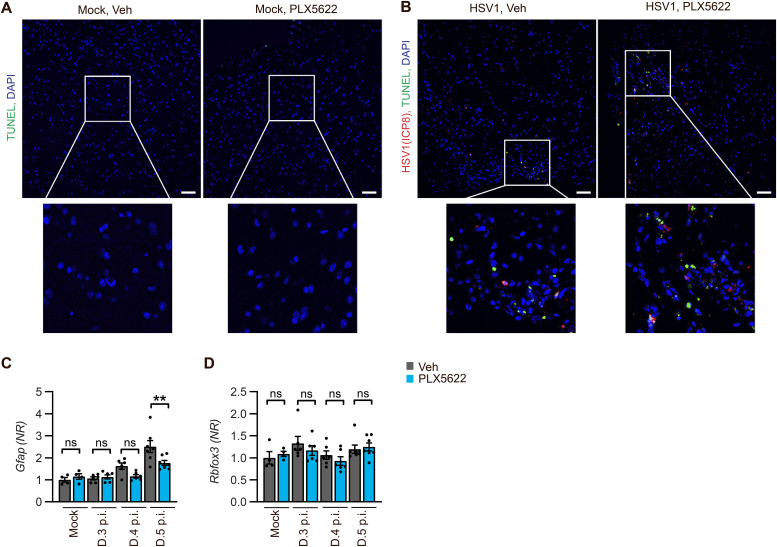
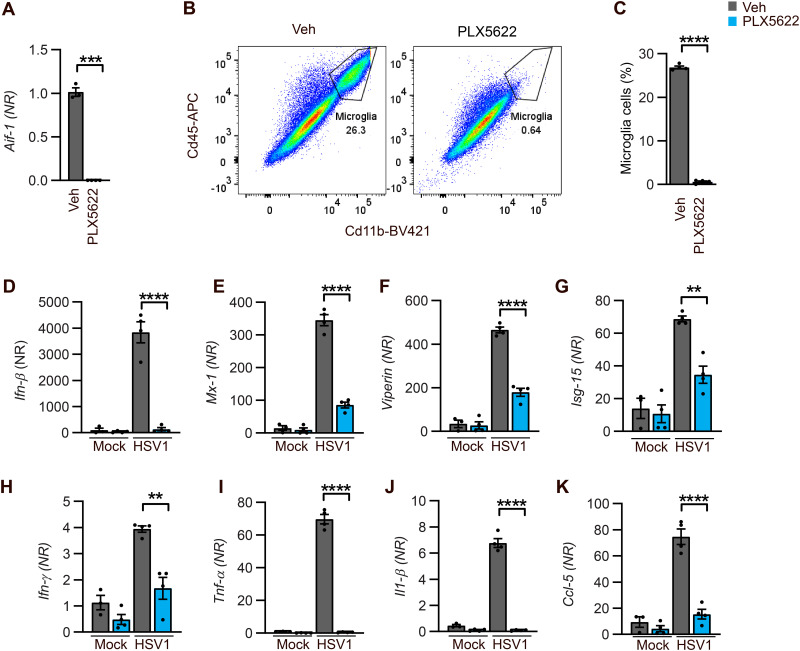
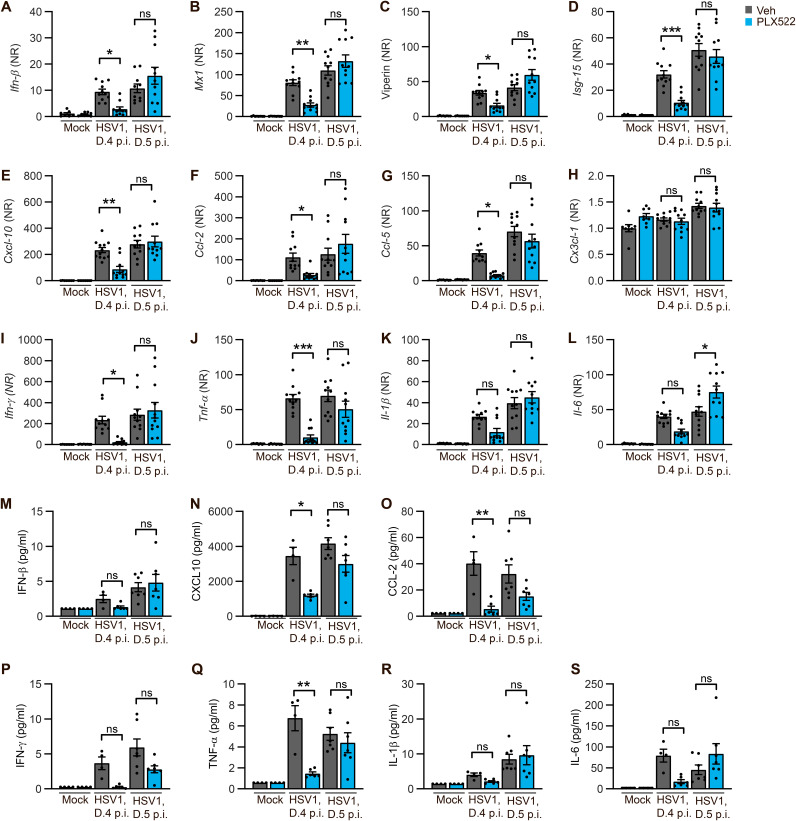
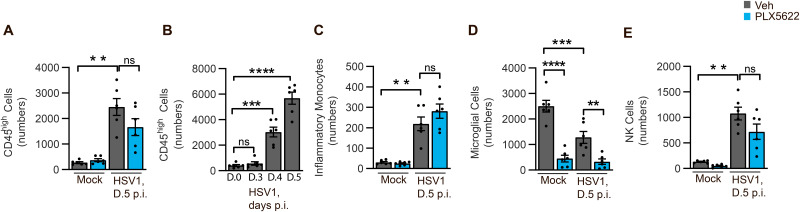
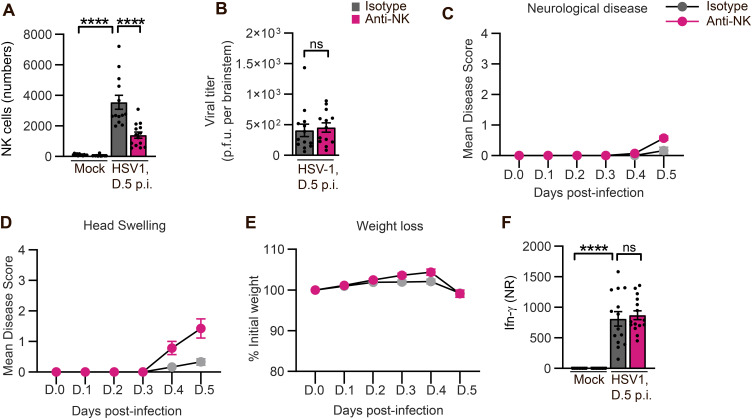
Spread of herpes simplex virus 1 (HSV1) from the periphery to the central nervous system (CNS) can lead to extensive infection and pathological inflammation in the brain, causing herpes simplex encephalitis (HSE). It has been shown that microglia, the CNS-resident macrophages, are involved in early sensing of HSV1 and induction of antiviral responses. In addition, infiltration of peripheral immune cells may contribute to the control of viral infection. In this study, we tested the effect of microglia depletion in a mouse model of HSE. Increased viral titers and increased disease severity were observed in microglia-depleted mice. The effect of microglia depletion was more pronounced in wild-type than in cGas-/- mice, revealing that this immune sensor contributes to the antiviral activity of microglia. Importantly, microglia depletion led to reduced production of type I interferon (IFN), proinflammatory cytokines, and chemokines at early time points after viral entry into the CNS. In line with this, in vitro experiments on murine primary CNS cells demonstrated microglial presence to be essential for IFN RNA induction, and control of HSV1 replication. However, the effect of microglia depletion on the expression of IFNs, and inflammatory cytokines was restricted to the early time point of HSV1 entry into the CNS. There was no major alteration of infiltration of CD45-positive cells in microglia-depleted mice. Collectively, our data demonstrate a key role for microglia in controlling HSV1 replication early after viral entry into the CNS and highlight the importance of a prompt antiviral innate response to reduce the risk of HSE development. IMPORTANCE One of the most devastating and acute neurological conditions is encephalitis, i.e., inflammation of brain tissue. Herpes simplex virus 1 (HSV1) is a highly prevalent pathogen in humans, and the most frequent cause of viral sporadic encephalitis called herpes simplex encephalitis (HSE). HSV1 can infect peripheral neurons and reach the central nervous system (CNS) of humans, where it can be detected by brain resident cells and infiltrating immune cells, leading to protective and damaging immune responses. In this study, we investigated the effects of microglia depletion, the main brain-resident immune cell type. For this purpose, we used a mouse model of HSE. We found that viral levels increased, and disease symptoms worsened in microglia-depleted mice. In addition, mice lacking a major sensor of viral DNA, cGAS, manifested a more pronounced disease than wild-type mice, highlighting the importance of this immune sensor in the activity of microglia. Microglia depletion led to reduced production of many known antiviral factors, most notably type I interferon (IFN). The importance of microglia in the early control of HSV1 spread and the generation of antiviral responses is further demonstrated by experiments on murine mixed glial cell cultures. Interestingly, mice with microglia depletion exhibited an unaltered activation of antiviral responses and recruitment of immune cells from the periphery at later time points of infection, but this did not prevent the development of the disease. Overall, the data highlight the importance of rapid activation of the host defense, with microglia playing a critical role in controlling HSV1 infection, which eventually prevents damage to neurons and brain tissue.

Keywords: DNA sensor; PLX5622; cGAS; central nervous system infections; herpes simplex virus; innate immunity; interferon; microglia.


Conflict of interest statement

The authors declare no conflict of interest.

Figures

FIG 1
FIG 1
Efficiency and specificity of microglia depletion after administration of the CSF-1R inhibitor PLX5622. Flow cytometry and IHC analysis of brain stem samples from mock-infected (PBS inoculated) and HSV1-infected WT mice. The microglia-depleted groups had ad libitum access to high-dose PLX5622-formulated chow from 7 days before mock infection until the end of the infection period (5 days), resulting in a total treatment period of 12 days. For (B to C), the mice received two different doses of PLX5622-formulated chow for 14 and 21 days and all mice were euthanized after 5 days of mock infection. (A) Representative flow cytometry dot plots of microglial cell subset (CD45medCD11b+) in brain stem tissue. (B to C) Cell populations were counted in single-cell suspension samples originating from brain stem homogenates of mice. The gating strategy included the exclusion of counting beads, cell debris, doublets, dead cells, followed by gating the CD45medCD11b+ population of microglia. (D) WT mice were treated with high dose PLX5622 (1200 ppm) 7 days before mock or HSV1 infection. Treatment was maintained for the duration of HSV1 infection of 3, 4, or 5 days. RNA samples were extracted from brain stem homogenates, which were tested in a qPCR setup for the AIF-1 gene. Total mRNA levels were first normalized to GAPDH (glyceraldehyde-3-phosphate dehydrogenase) and then to the average value of the mock-infected WT group to calculate the normalized ratio (NR) values. (E) IHC sections from brain stem tissue were stained with antibodies against Iba-1 (microglia) (green), and HSV-1 (polyclonal, red). The scale bar is 100 μm. (F to G) Cell populations were counted in single-cell suspension samples originating from spleen homogenates of mice. The gating strategy for characterizing the splenic cellular subsets included the exclusion of counting beads, cell debris, doublets, dead cells, followed by gating the CD45highCD11b+ spleen macrophages and CD45highCD11b spleen T-lymphocyte populations. Total cell numbers were calculated by adding CountBright Absolute Counting Beads in each sample of interest before the flow cytometry run. All data in this figure are presented as the mean ± SEM of 2 independent experiments on day 5 post-mock infection. Each data point represents an individual mouse. Four to six mice were used in each group per experiment. P values: NS (not significant) P > 0.05; *P < 0.05; **P < 0.01; ***P < 0.001; ****P < 0.0001.
FIG 2
FIG 2
Monitoring the development of HSE-like disease after microglia depletion. Ocular infection with HSV1 (McKrae strain, 2.0 × 106 PFU/eye) or vehicle inoculation (PBS) was performed in both eyes of WT mice. Mice had ad libitum access to either high-dose PLX5622-formulated chow or control chow from 7 days before HSV1 ocular infection until the end of the infection period. (A to D) Clinical scores and weights of infected mice were measured from day 0 until the end of the infection. Disease evaluation included weight loss in percentage of initial weight, head swelling, neurological disease (motor-related functions), and mortality. Mice reaching a humane endpoint or weight loss equal to or more than 20% were euthanized. The mock animals are not shown because they did not have any symptoms. (E and F) Viral titers (days 3, 4, and 5 pi) in the eyewash, trigeminal ganglia (TG), or brain stems of mice infected with HSV1. In (F), data are presented as means ± SEM and represent a combination of three independent experiments, n = 17 mice per group. (G) Total mRNA levels of HSV1 gB in harvested brain stems were measured by qPCR analysis. Bars represent relative gene expression levels (2−ΔΔCT). Values were normalized to housekeeping genes β-actin and GAPDH and subsequently to similar samples from vehicle-treated and mock-infected groups. Data are presented as the mean ± SEM of multiple experiments, which is repeated at least 3 times, 4 to 17 mice were used in each group. In (E to G), each data point represents an individual mouse. P values: NS (not significant) P > 0.05; *P < 0.05; **P < 0.01; ***P < 0.001; ****P < 0.0001.
FIG 3
FIG 3
Monitoring of viral titer and HSE-like disease symptoms after PLX5622 treatment in cGas−/− mice. Infected cGas−/− mice were treated with vehicle or PLX5622 (1200 ppm). Clinical scores and weights were measured from day 0 until the mice reached a humane endpoint. (A) Viral titers from the brain stem after 4 days pi were determined. Bars represent HSV-1 viral titer and ratios of PLX5622-treated versus vehicle-treated groups of the WT (C56BL/6) and cGas−/− mice. (B and C) Disease evaluation included head swelling and weight loss in percentage of initial weight. In (B), the mock animals are not shown because they did not have any symptoms. For all, 4 to 10 mice were used in each group per experiment, which is repeated at least 3 times. P values: NS (not significant) P > 0.05; *P < 0.05; **P < 0.01; ***P < 0.001; ****P < 0.0001.
FIG 4
FIG 4
PLX5622 treatment neither induces cell death nor affects the viability of other CNS-resident cells. Mice were microglia depleted and infected as described in Fig. 2. Infected mice were euthanized after 3, 4, or 5 days of infection, and mock-infected mice after 5 days of PBS inoculation. (A and B) IHC sections from brain stem tissue (5 days pi) were stained with antibodies for TUNEL assay (green), HSV-1 ICP-8 (red), and DAPI (blue). Scale bar, 100 μm. (C and D) Total mRNA levels of Gfap and Rbfox3 in harvested brain stems were measured by qPCR analysis. Bars represent relative gene expression levels (2-ΔΔCT). Values were normalized to housekeeping genes β-actin and GAPDH and subsequently to similar samples from the vehicle-treated and mock-infected group. Data are presented as the mean ± SEM of multiple experiments on days 0 to 5 postinfection. Four to six mice were used in each group per experiment. Each data point represents an individual mouse. P values: NS (not significant) P > 0.05; *P < 0.05; **P < 0.01; ***P < 0.001; ****P < 0.0001.
FIG 5
FIG 5
Induction of antiviral, proinflammatory, and chemotactic responses by HSV1 in the presence or absence of microglia in primary murine mixed glial cells in vitro. Mixed glial cells, isolated from the brains of newborn WT mice, were cultured for 31 days. Media was complemented with either DMSO or PLX5622 and renewed every 3 days to achieve microglia depletion. (A) Total RNA extracted from the samples was examined in a multiplex qPCR setup for AIF-1 gene expression on day 31 of treatment. Bars represent relative gene expression levels (2−ΔΔCT). Values were normalized to housekeeping genes β-actin and GAPDH and subsequently to similar samples from the vehicle-treated group. (B) Gating plots for the characterization of microglial population. Characterization strategy included the exclusion of cell debris, doublets, and dead cells. CD45med/CD11b+ population represents the microglial cells. (C) Bars represent the percentages of microglial cells in vehicle- and PLX5622-treated samples after treatment of 31 days. Percentages of the cell population were counted in single-cell suspension samples originating from mixed glial cell samples. (D to K) After 31 days of treatment, cultures were infected with HSV1 (multiplicity of infection (MOI) of 3) for 6 h. RNA samples extracted from mixed glial cell cultures were tested by qPCR for multiple genes (IFN-β, MX1, Viperin, ISG-15, IFN-γ, TNF-α, IL-1β, and CCL5). Bars represent relative gene expression levels (2−ΔΔCT). Values were normalized to housekeeping genes β-actin and GAPDH and subsequently to similar samples from vehicle-treated and mock-infected groups. Data are presented as the mean ± SEM of multiple experiments. n = 4 samples/group per experiment. P values: NS (not significant) P > 0.05; *P < 0.05; **P < 0.01; ***P < 0.001; ****P < 0.0001.
FIG 6
FIG 6
Immediate antiviral, proinflammatory, and chemotactic responses are initiated immediately after HSV1 presence in the brain tissue in a microglia-dependent manner. Characterization of RNA and protein profile of WT mice. Mice were infected and treated with PLX5622 as described in Fig. 1. Mice were euthanized after 4 or 5 days of mock or HSV1 infection. (A to K) RNA samples extracted from brain stem homogenates were tested in a multiplex qPCR setup for multiple genes (IFN-β, MX1, Viperin, ISG-15, CXCL10, CCL2, CCL5, Cx3cl1, IFN-γ, TNF-α, IL-1β, and IL-6). Values were normalized to housekeeping genes β-actin and GAPDH and subsequently to similar samples from vehicle-treated and mock-infected groups. Relative gene expression levels (2−ΔΔCT) are presented as the mean ± SEM of multiple experiments on days 0 to 5 postinfection. Eight to eleven mice were used in each group per experiment. (L to R) Protein samples extracted from brain stem homogenates and 2.0 mg/mL total protein samples from each brain stem were tested in a multiplex sandwich immunoassay (Meso Scale Discovery (MSD) U-PLEX Biomarker Group 1 (Mouse) Multiplex Assays kit) for multiple proteins (IFN-β, CXCL10, CCL2, IFN-γ, TNF-α, IL-1β, and IL-6). Data are presented as the mean ± SEM and represent two independent experiments. Each data point represents an individual mouse (n = 4 to 6 mice/group). P values: NS (not significant) P > 0.05; *P < 0.05; **P < 0.01; ***P < 0.001; ****P < 0.0001.
FIG 7
FIG 7
Microglia depletion has a minor effect on the infiltration of leukocytes into the brain after HSV1 infection of the CNS. Flow cytometry of brain stem samples from WT mice after ocular infection with HSV1 and PLX5622 treatment as described in Fig. 2 (A and C to E) Infected mice were euthanized after 5 days of infection and mock-infected mice after 5 days of PBS inoculation. (B) Infected mice were euthanized 3, 4, or 5 days postinfection and 5 days post-mock inoculation with PBS. Cell populations were counted in single-cell suspension samples originating from brain stem homogenates of mice. The gating strategy for characterizing the following cellular subsets included the exclusion of counting beads, cell debris, doublets, and dead cells. CD45high population represents the infiltrating peripheral leukocytes. CD45highLy6C+ population represents inflammatory monocytes. CD11b+NK1.1+ represents NK cells. CD45medCD11b+ population represents microglia. Total cell numbers were calculated by adding CountBright Absolute Counting Beads in each sample of interest before the flow cytometry run. Data are presented as the mean ± SEM of 2 independent experiments on day 5 postinfection. Each data point represents an individual mouse. n = 4 to 6 mice/group per experiment. P values: NS (not significant) P > 0.05; *P < 0.05; **P < 0.01; ***P < 0.001; ****P < 0.0001.
FIG 8
FIG 8
Depletion of NK cells and the effect HSV1 spread, disease phenotype, or IFN-γ production during the first 5 days of HSV1 infection. Ocular infection with HSV1 or vehicle inoculation (PBS) was performed as previously explained in Fig. 2. Mice were injected intraperitoneally with either an isotype or anti-NK1.1 antibody at day 0 and 3 postinfection at a dose of 200 μg/injection. Mice were euthanized after 5 days of infection. (A) The numbers for NK cells in the brain stem were determined by flow cytometry. (B) Viral titers in the brainstems of mice infected with HSV1. Data are presented in (A and B) as means ± SEM of three independent experiments, n = 12 to 14 mice per group. (C to E) Clinical scores and weights of infected mice were measured from day 0 until the end of the infection. Disease evaluation included weight loss in percentage of initial weight, head swelling, and neurological disease (motor-related functions). Mice reaching a score of 4 in head swelling or motor-related functions, or weight loss equal to or more than 20% were euthanized. (F) Total mRNA levels of IFN-γ in harvested brain stems were measured by qPCR. Bars represent relative gene expression levels (2−ΔΔCT). Values were normalized to housekeeping genes β-actin and GAPDH and subsequently to similar samples from the vehicle-treated and mock-infected group. All data are presented as the mean ± SEM of multiple experiments on days 0 to 5 postinfection. Seven to eight mice were used in each group per experiment. In (A, B, and F), each data point represents an individual mouse. P values: NS (not significant) P > 0.05; *P < 0.05; **P < 0.01; ***P < 0.001; ****P < 0.0001.

Similar articles

Cited by

References

    1. Murray PR, Rosenthal KS, Pfaller MA. 2016. Medical Microbiology 8th Edition Elsevier.
    1. Koelle DM, Corey L. 2003. Recent progress in herpes simplex virus immunobiology and vaccine research. Clin Microbiol Rev 16:96–113. 10.1128/CMR.16.1.96-113.2003. - DOI - PMC - PubMed
    1. Granerod J, Ambrose HE, Davies NWS, Clewley JP, Walsh AL, Morgan D, Cunningham R, Zuckerman M, Mutton KJ, Solomon T, Ward KN, Lunn MPT, Irani SR, Vincent A, Brown DWG, Crowcroft NS, UK Health Protection Agency (HPA) Aetiology of Encephalitis Study Group. 2010. Causes of encephalitis and differences in their clinical presentations in England: a multicentre, population-based prospective study. Lancet Infect Dis 10:835–844. 10.1016/S1473-3099(10)70222-X. - DOI - PubMed
    1. Whitley RJ. 2006. Herpes simplex encephalitis: adolescents and adults. Antiviral Res 71:141–148. 10.1016/j.antiviral.2006.04.002. - DOI - PubMed
    1. Paludan SR, Bowie A. 2013. Immune Sensing of DNA. Immunity 38:870–880. 10.1016/j.immuni.2013.05.004. - DOI - PMC - PubMed

Publication types

MeSH terms