. 2022 Mar 16;110(6):992-1008.e11.
doi: 10.1016/j.neuron.2021.12.019. Epub 2022 Jan 18.

Genome-wide identification of the genetic basis of amyotrophic lateral sclerosis

Collaborators, Affiliations

Genome-wide identification of the genetic basis of amyotrophic lateral sclerosis

Sai Zhang et al. Neuron. .

Abstract

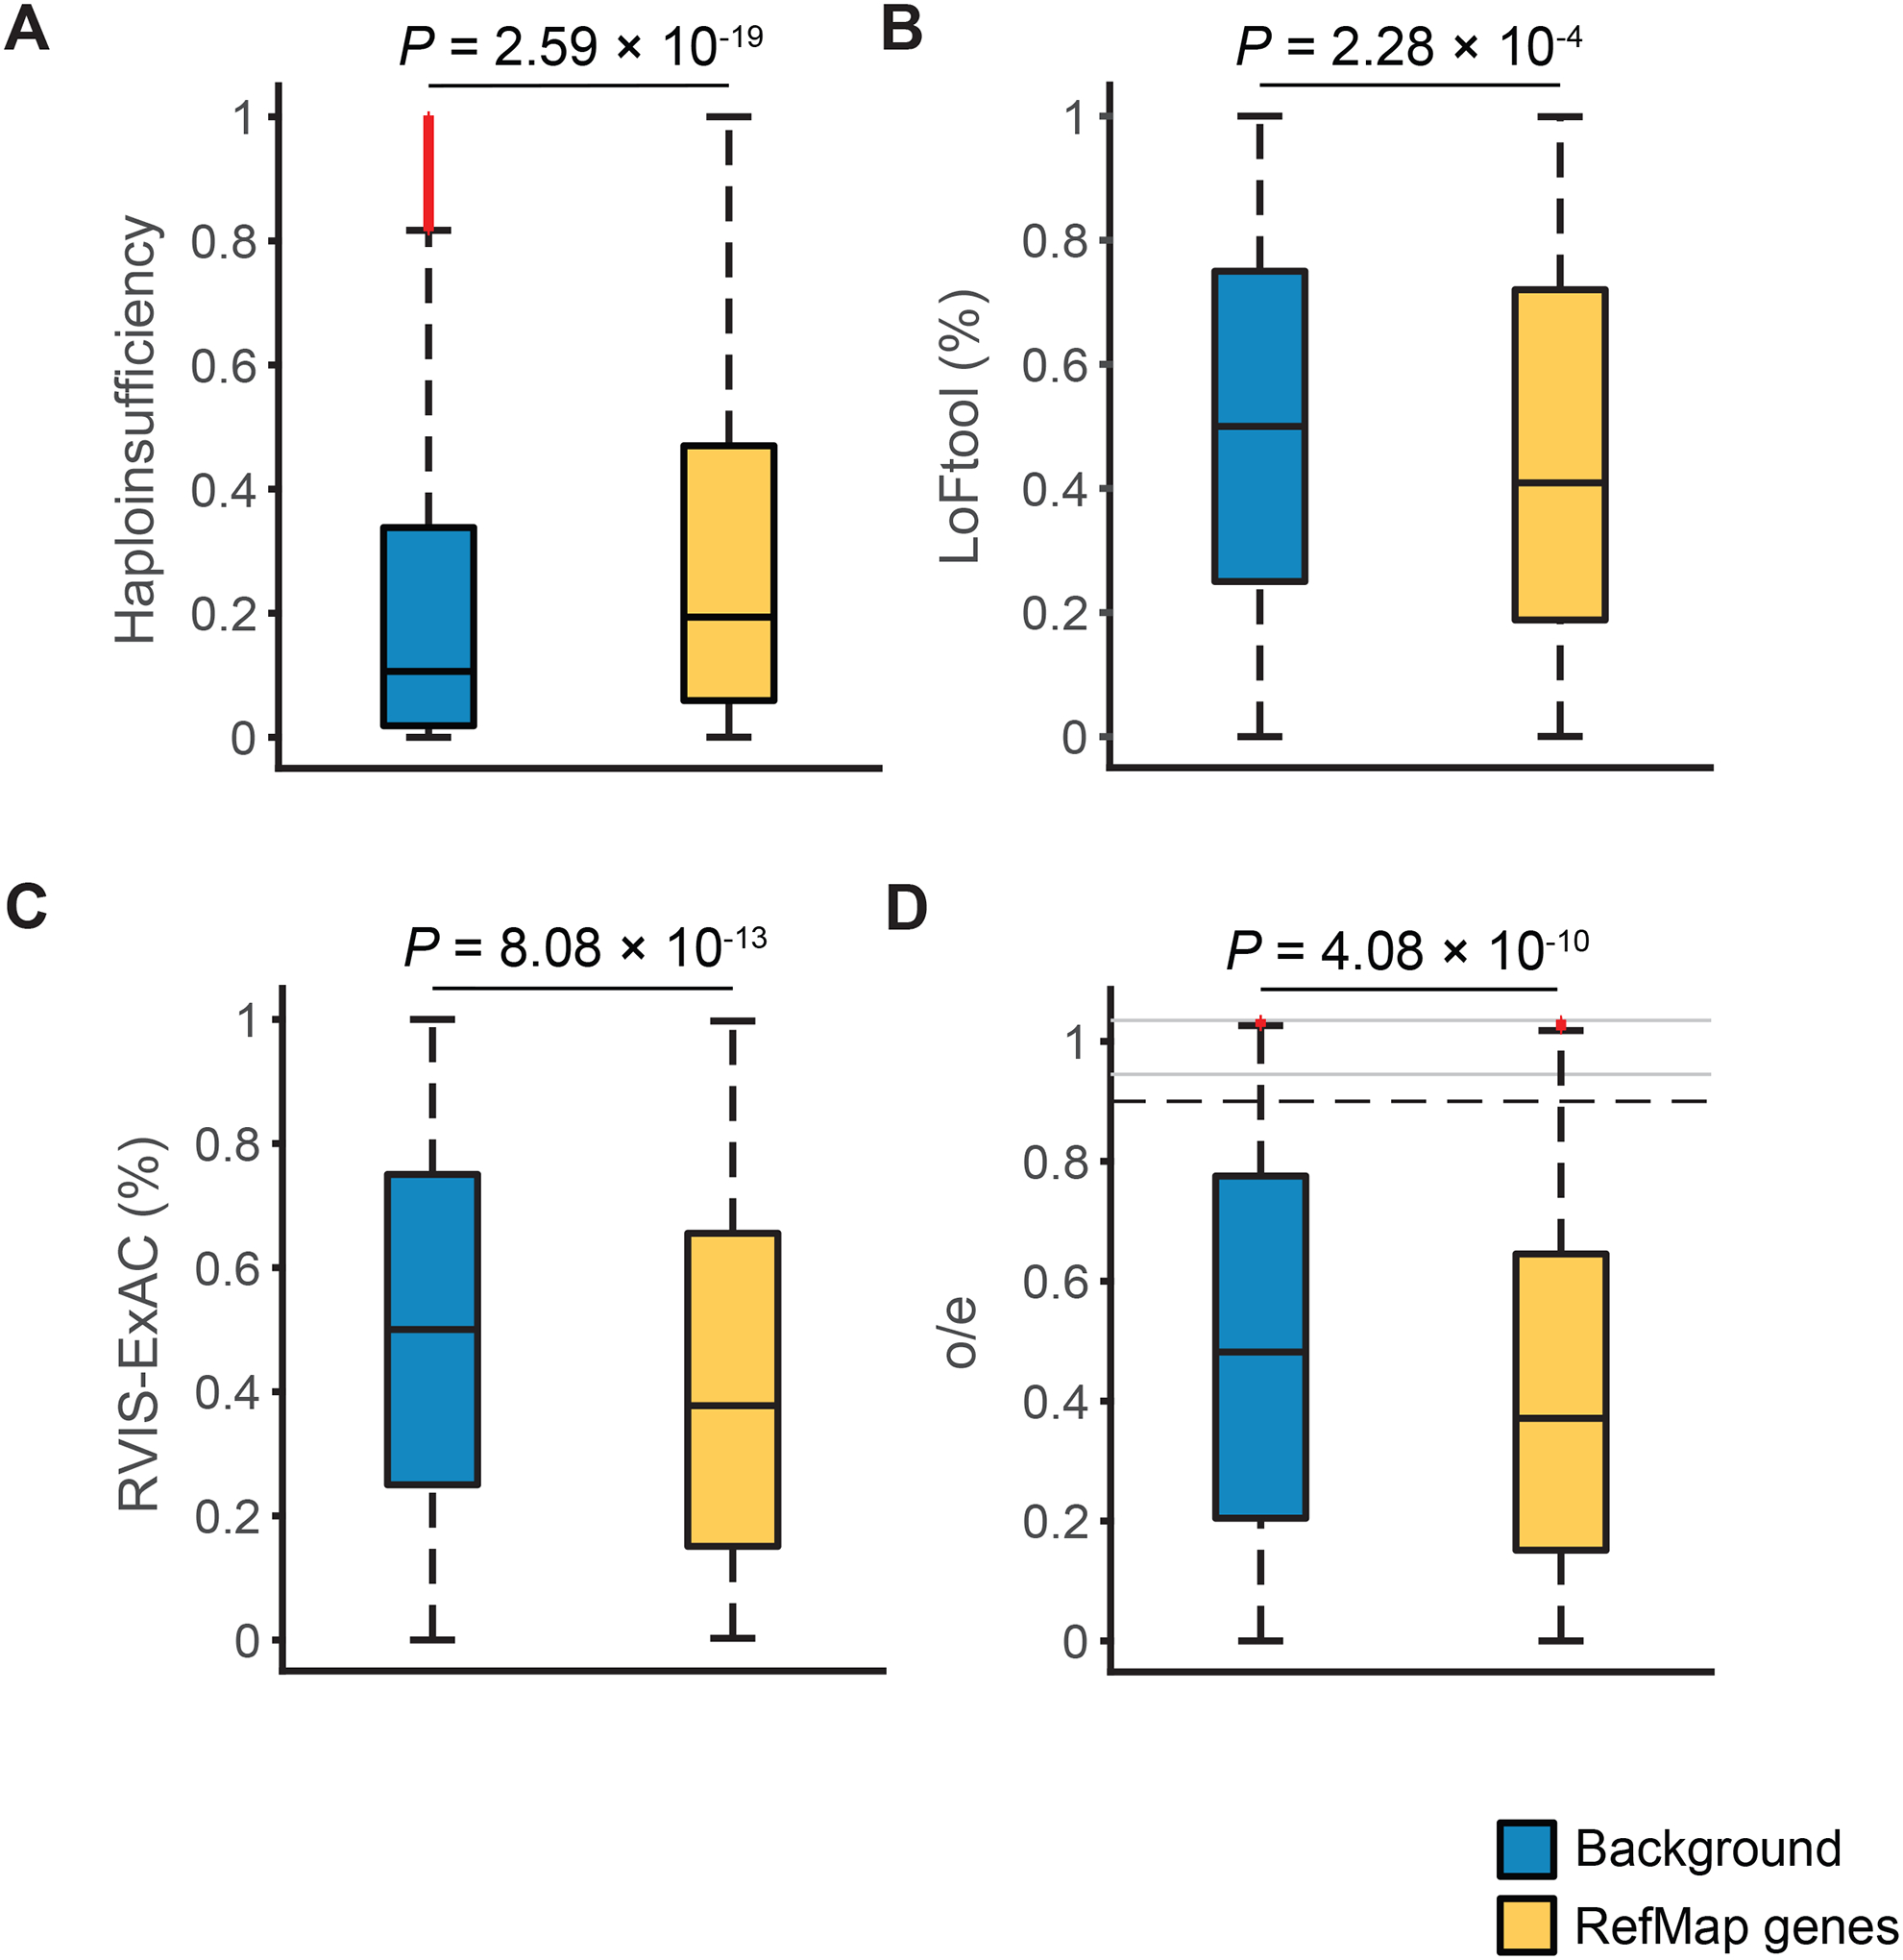
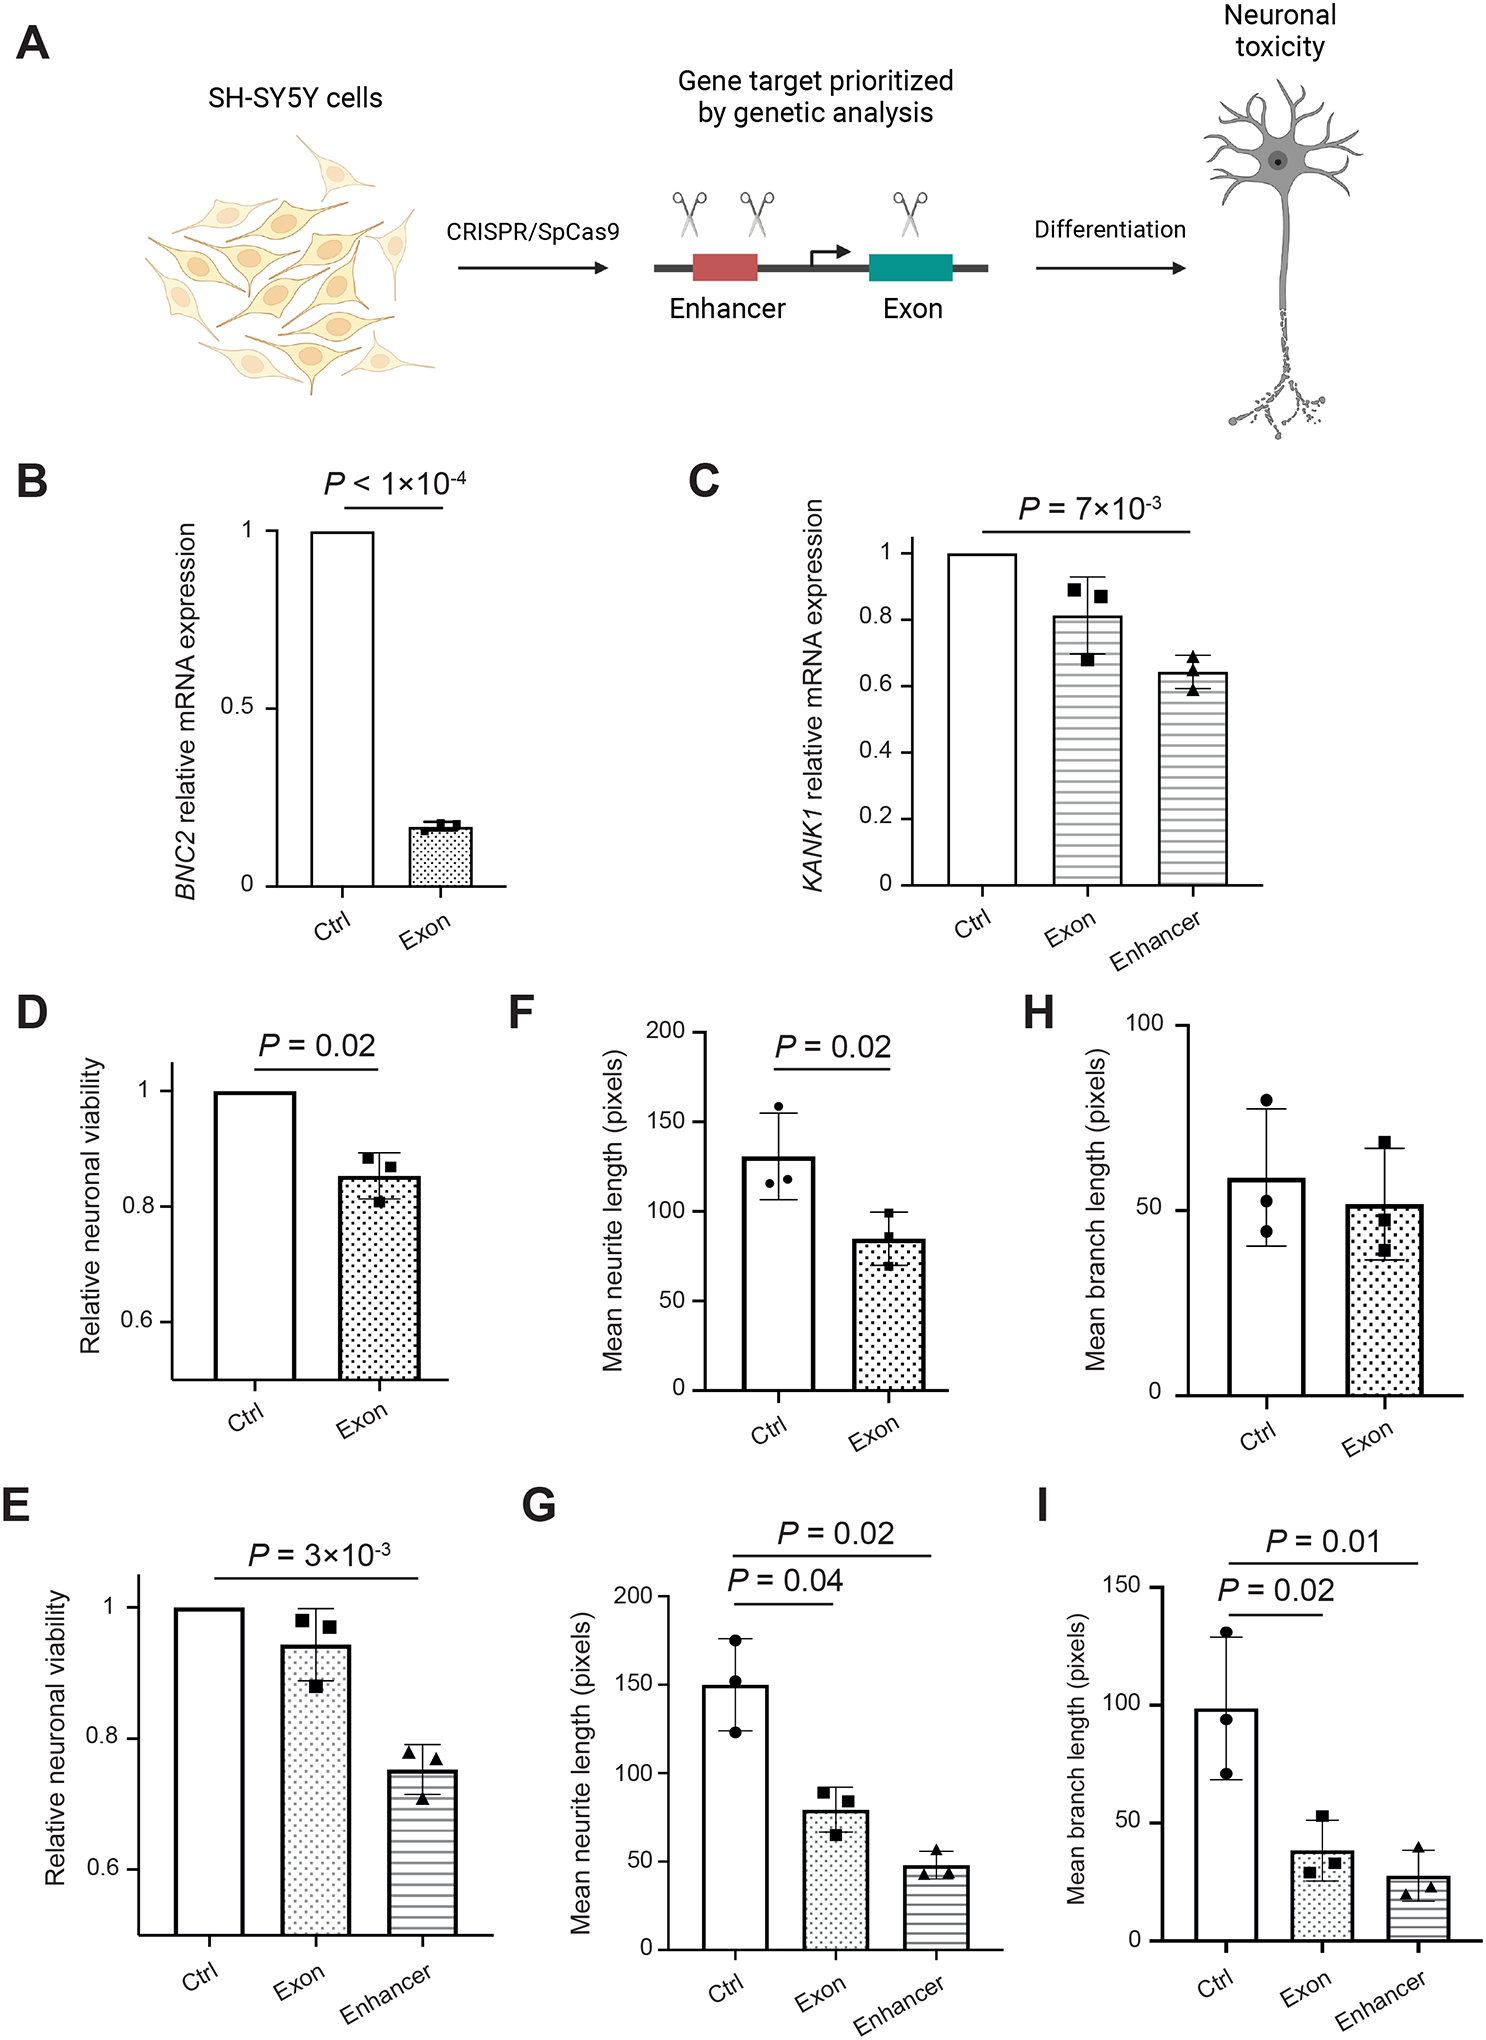
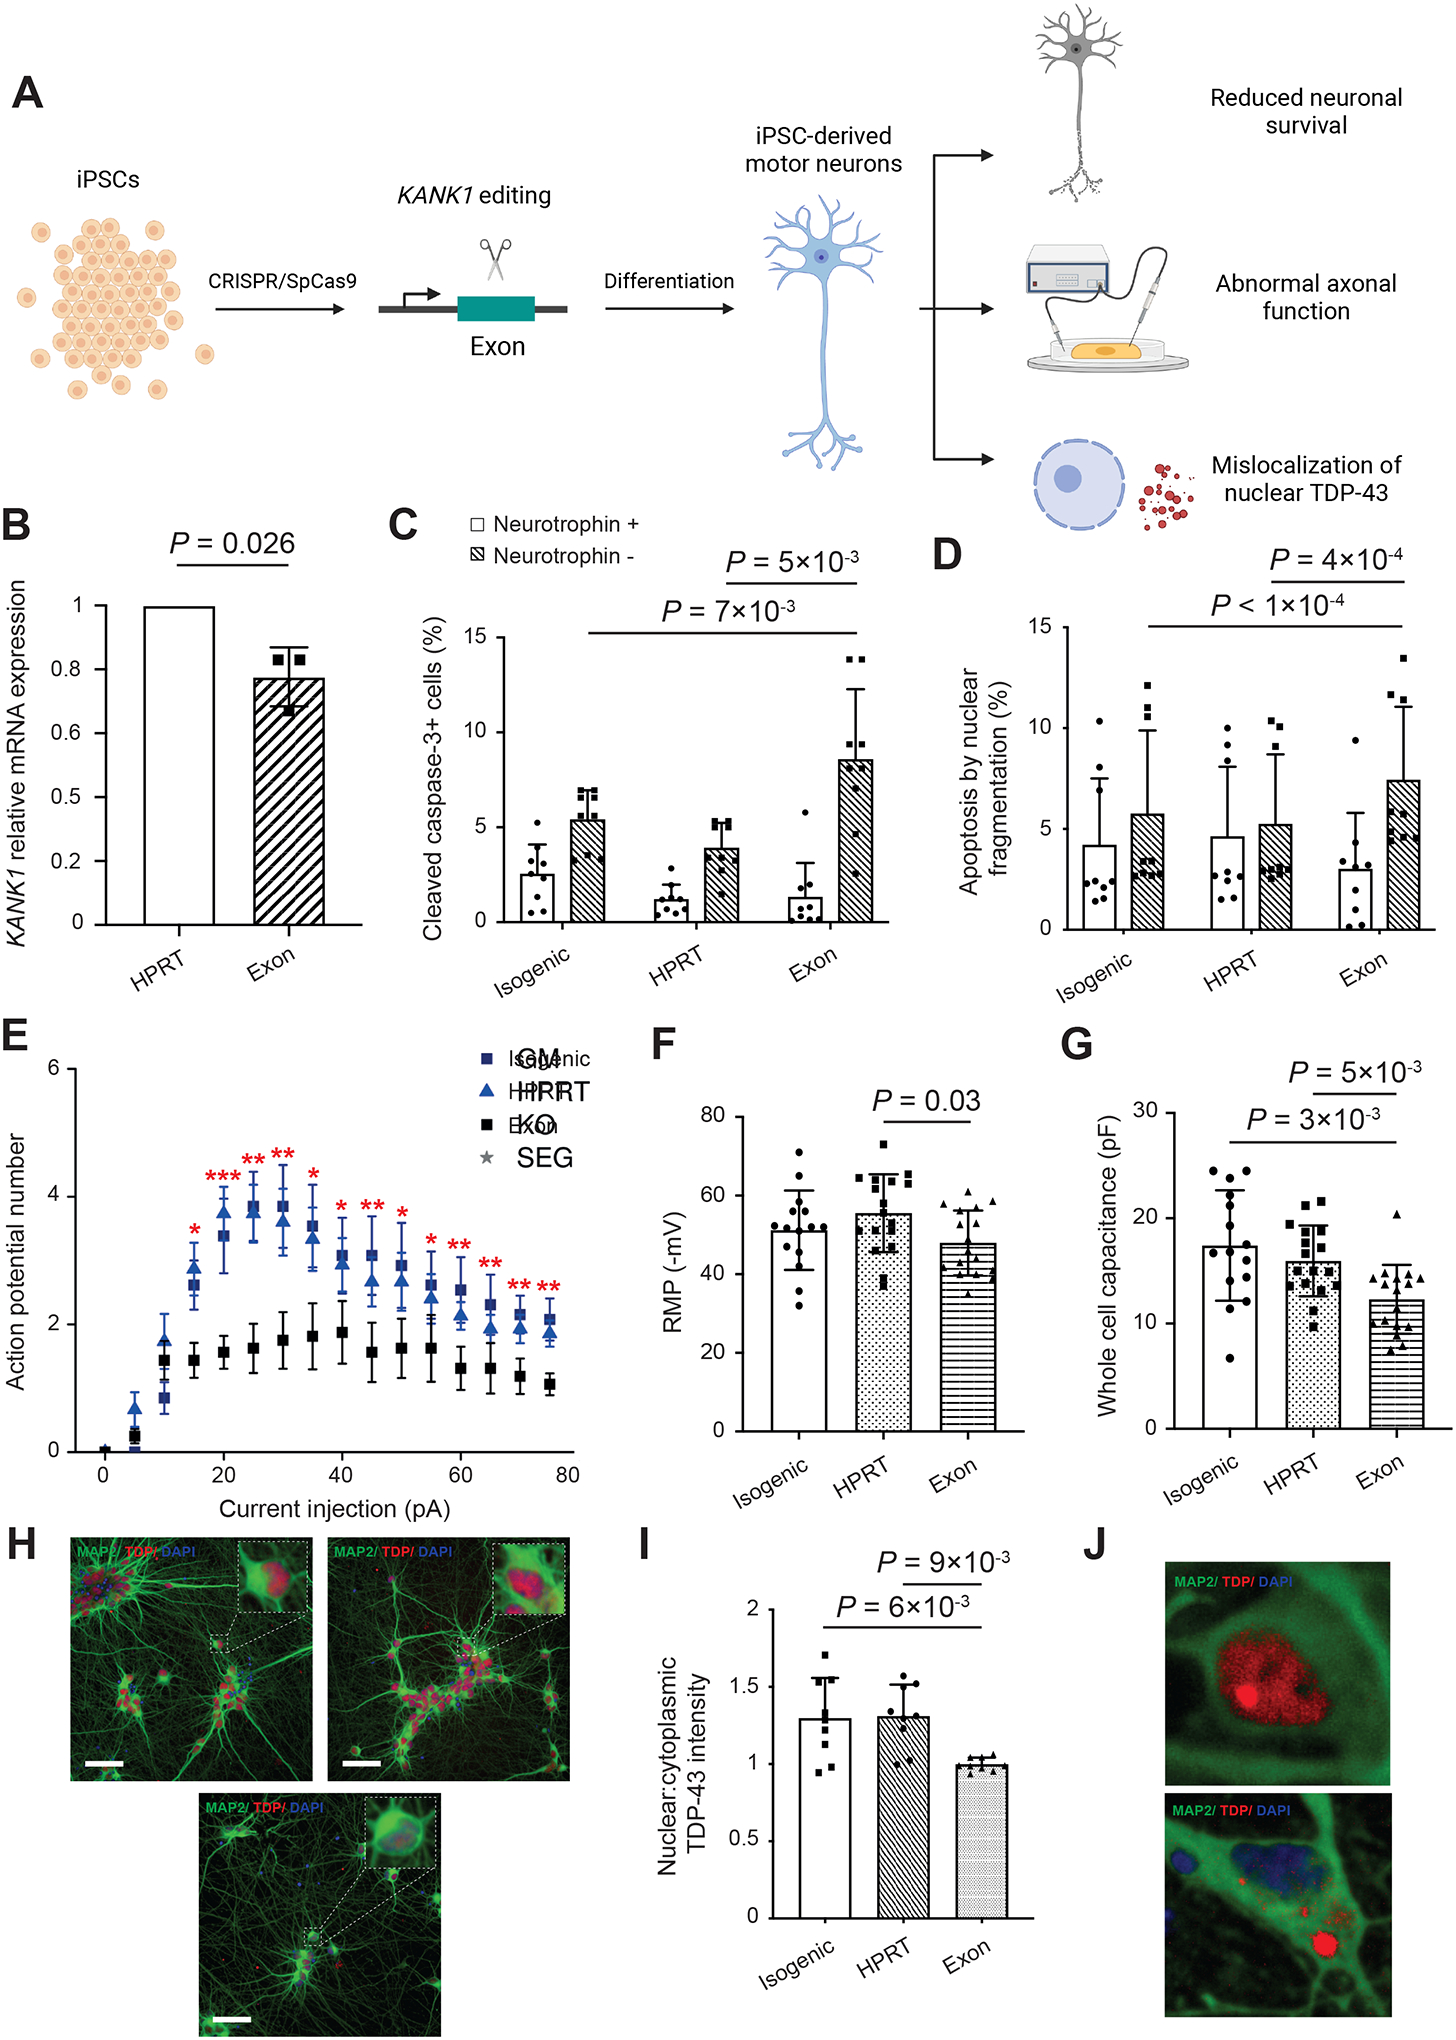
Amyotrophic lateral sclerosis (ALS) is a complex disease that leads to motor neuron death. Despite heritability estimates of 52%, genome-wide association studies (GWASs) have discovered relatively few loci. We developed a machine learning approach called RefMap, which integrates functional genomics with GWAS summary statistics for gene discovery. With transcriptomic and epigenetic profiling of motor neurons derived from induced pluripotent stem cells (iPSCs), RefMap identified 690 ALS-associated genes that represent a 5-fold increase in recovered heritability. Extensive conservation, transcriptome, network, and rare variant analyses demonstrated the functional significance of candidate genes in healthy and diseased motor neurons and brain tissues. Genetic convergence between common and rare variation highlighted KANK1 as a new ALS gene. Reproducing KANK1 patient mutations in human neurons led to neurotoxicity and demonstrated that TDP-43 mislocalization, a hallmark pathology of ALS, is downstream of axonal dysfunction. RefMap can be readily applied to other complex diseases.

Keywords: ALS; TDP-43 mislocalization; axonal dysfunction; epigenetics; gene discovery; genetics; iPSC; machine learning; motor neurons; multiomics.


Conflict of interest statement

Declaration of interests M.P.S. is a co-founder and member of the scientific advisory board of Personalis, Qbio, January, SensOmics, Protos, Mirvie, NiMo, Onza, and Oralome. He is also on the scientific advisory board of Danaher, Genapsys, and Jupiter. J.L. is a co-founder of SensOmics. No other authors have competing interests.

Figures

Figure 1.
Figure 1.. RefMap identifies ALS risk genes by integrating ALS GWAS data with the molecular profiling of motor neurons
(A) Schematic of the study design. (1 and 2) We sequenced the transcriptome and epigenome of the iPSC-derived MNs. By integrating (3) ALS GWAS data with functional genomics of MNs, (4) a machine learning model called RefMap was developed to fine-map ALS-associated regions. (5) After linking those identified regions to their regulatory targets, 690 ALS-associated genes were pinpointed. (6) Transcriptome analysis based on iPSC-derived MNs, human tissues, and mouse models, as well as (7) network analysis were performed to demonstrate the functional significance of RefMap ALS genes. (8) CRISPR/Cas9 reproduction of identified ALS-associated mutations experimentally verified the proposed link to neuronal toxicity. The LD heatmap matrix in (4) is visualized in both R2 (red) and D’ (blue) using LDmatrix (https://ldlink.nci.nih.gov/?tab=ldmatrix). cCRE, candidate cis-regulatory element; GO, gene ontology. (B) A region (chr12:112,036,001–112,038,000) around ATXN2 precisely pinpointed by RefMap because of elevated SNP Z-scores as well as enriched epigenetic peaks (ATAC-seq, H3K27ac and H3K4me3 histone ChIP-seq). The output of RefMap is labeled as Q-score. ATAC-seq and ChIP-seq signals are shown in fold change (FC) based on one replicate from sample CS14. See also Figure S1D and Supplemental Note.
Figure 2.
Figure 2.. RefMap genes are haploinsufficient and intolerant to loss of function
(A-D) Comparison of haploinsufficiency score (A), LoFtool percentile (B), RVIS-ExAC percentile (C), and o/e score (D) between RefMap genes and all protein-coding genes in the background transcriptome. Comparison was performed using the one-sided Wilcoxon rank-sum test. The bottom and top of the boxes indicate the first and third quartiles, respectively, where the black line between indicates the median. Whiskers denote the minimal value within 1.5 interquartile range (IQR) of the lower quartile and the maximum value within 1.5 IQR of the upper quartile. Red symbols denote outliers. In D, black dashed lines indicate the lower and upper limits of the regions with regular scale. Outliers beyond the black dashed lines are visualized with a compressed scale in the regions denoted by gray lines. See also Figures S2B and S2C.
Figure 3.
Figure 3.. Transcriptomics supports the functional importance of RefMap genes in motor neurons and in ALS
(A) Comparative gene expression analysis of RefMap genes in iPSC-derived MNs from neurologically normal individuals (n=3). For a fair comparison, we only considered those genes with evidence for MN expression (TPM>1). (B) Comparative gene expression analysis of RefMap genes in post-mortem CNS tissues from C9orf72-ALS (n=8) and sporadic ALS (n=10) patients versus neurologically normal controls (n=17). FC, frontal cortex; CB, cerebellum. (C) Comparative gene expression analysis of RefMap genes in iPSC-derived MNs from ALS patients (n=55) versus neurologically normal controls (n=15). All comparisons in A-C were performed using the one-sided Wilcoxon rank-sum test, and the Benjamini-Hochberg (BH) correction was carried out in B. In A-C, the bottom and top of the boxes indicate the first and third quartiles, respectively, where the black line in between indicates the median. Whiskers denote the minimal value within 1.5 IQR of the lower quartile and the maximum value within 1.5 IQR of the upper quartile. Red symbols denote outliers. In B and C, black dashed lines indicate the lower and upper limits of the regions with regular scale. Outliers beyond the black dashed lines are visualized with a compressed scale in the regions denoted by gray lines. (D) Heatmap showing hierarchical clustering of expression changes of RefMap genes during disease progression based on the SOD1-G93A mouse model. RefMap genes were mapped to their mouse homologs (n=510). Gene expression levels were estimated using the β scores calculated in (Maniatis et al., 2019), and were averaged across different sections of spinal cords at each time point. Time points p30, p70, p100, and p120 represent presymptomatic, onset, symptomatic, and end-stage, respectively. Difference of gene expression levels between SOD1-G93A and SOD1-WT mice at each time point was quantified by the difference in β (Δβ). Before clustering, Δβ were standardized across genes, and one minus correlation was used as the clustering distance. (E) Two distinct expression patterns (C1: 286 genes; C2: 224 genes) of RefMap genes were identified after clustering. The larger cluster C1 was progressively downregulated during ALS progression. Solid plot represents the mean of expression levels within each cluster, and the standard error is shown as shading. (F) Gene ontology analysis of C1, showing that C1 is enriched with functions related to the MN distal axon and synapse. GO, gene ontology; GOBP, gene ontology biological process; GOCC, gene ontology cellular compartment. Black vertical line represents P=0.05. See also Table S4.
Figure 4.
Figure 4.. Network analysis associates RefMap genes with distal axonopathy in motor neurons
(A and B) PPI network analysis revealed two modules that are significantly (FDR<0.1) enriched with RefMap genes: M421 (721 genes) (A) and M604 (308 genes) (B). Hypergeometric test was performed to quantify the enrichment followed by BH correction. Module nodes are colored to demonstrate the enrichment, where RefMap genes are in blue and other module genes are yellow. Edge thickness is proportional to STRING confidence score (>700). (C and D) RefMap modules, including M421 (C) and M604 (D), are enriched for MN functions localized within the distal axon. GOBP, gene ontology biological process; GOCC, gene ontology cellular compartment. Black vertical line represents P=0.05. (E) Representation of pathways enriched in each module (C and D) in MNs. (F) Comparative gene expression analysis of RefMap module genes in control MNs. All comparisons were performed using the one-sided Wilcoxon rank-sum test. The bottom and top of the boxes indicate the first and third quartiles, respectively, where the black line in between indicates the median. Whiskers denote the minimal value within 1.5 IQR of the lower quartile and the maximum value within 1.5 IQR of the upper quartile. Red symbols denote outliers. Black dashed lines indicate the lower and upper limits of the regions with regular scale. Outliers beyond the black dashed lines are visualized with a compressed scale in the regions denoted by gray lines. See also Figures S3A, S3C, S3D and Table S5.
Figure 5.
Figure 5.. Rare variant analysis demonstrates the association of RefMap genes with ALS severity
(A) Survival curves showing the number of rare LoF variants within RefMap ALS genes carried by an ALS patient is inversely correlated with the age of disease onset. Plot shows age of onset for ALS patients grouped by the number of rare LoF variants affecting one or more RefMap ALS genes. P-value by the logrank test. (B-E) Correlation analysis of the expression of ADAMTSL1 (B), BNC2 (C), KANK1 (D), and VAV2 (E) in iPSC-derived MNs obtained from ALS patients (n=55) versus the age of ALS onset. Gene expression level (x-axis) is plotted against the age of onset (y-axis). Lines (blue) of best fit are shown with 95% confidence interval (CI, grey area). The BH method was used for multiple testing correction. See also Figure S3B and Table S6.
Figure 6.
Figure 6.. Loss of function of BNC2 or KANK1 produces neurotoxicity
(A) Study design of experimental evaluation of BNC2 and KANK1 function in human neurons. We performed CRISPR/SpCas9 perturbation proximate to patient mutations in coding and enhancer regions of RefMap genes in SH-SY5Y neurons, and then investigated gene expression change and neuronal health. (B and C) Comparison of expression levels of BNC2 (B) and KANK1 (C) in corresponding edited neurons versus in control cells. (D and E) Comparison of neuronal viability by MTT assay between BNC2-edited (D), KANK1-edited neurons (E) and control cells. (F and G) Comparison of axonal length between BNC2-edited (F), KANK1-edited neurons (G) and control cells. (H and I) Comparison of axonal-branch length between BNC2-edited (H), KANK1-edited neurons (I) and control cells. Data are mean ± standard deviation. All comparisons were performed using the paired Student’s t-test. P-values smaller than 0.05 are annotated. See also Figures S4, S5A and S5B.
Figure 7.
Figure 7.. Loss of function of KANK1 in iPSC-derived motor neurons leads to neuronal toxicity, distal axon dysfunction, and TDP-43 mislocalization
(A) Schematic of experimental study design. To experimentally evaluate the effect of loss of function of KANK1, we performed CRISPR/SpCas9 perturbation proximate to patient KANK1 exonic mutations in iPSCs, which were then differentiated into mature MNs. MNs were evaluated for evidence of toxicity, deficient electrophysiological function, and for molecular phenotypes associated with ALS, including cytoplasmic displacement of TDP-43 with formation of cytoplasmic inclusions. (B) Comparison of KANK1 expression in KANK1-edited versus HPRT-edited cells. (C) Comparison of the proportion of cleaved caspase-3-positive cells between KANK1-edited iPSC-derived motor neurons and controls. (D) Comparison of the proportion of nuclear fragmentation between KANK1 edited motor neurons and controls. Comparisons in B-D were performed using the paired Student’s t-test. (E) Comparison of action potential firing between KANK1-edited motor neurons and controls. *, P<0.05; **, P<0.01; ***, P<0.001. (F) Comparison of resting membrane potential (RMP) between KANK1-edited motor neurons and controls. (G) Comparison of whole cell capacitance between KANK1-edited motor neurons and controls. Comparisons in E-G were performed using the Mann-Whitney U-test. (H) Immunocytochemistry reveals loss of nuclear TDP-43 in KANK1-edited motor neurons. (I) Comparison of the ratio of nuclear to cytoplasmic TDP-43 intensity between KANK1-edited motor neurons and controls. Comparison was performed using the one-way ANOVA. (J) Immunocytochemistry reveals cytoplasmic TDP-43-positive protein aggregates in KANK1-edited motor neurons. Data are mean ± standard deviation. P-values smaller than 0.05 are annotated. See also Figures S5C, S5D, S6 and S7.

Comment in

References

    1. Arganda-Carreras I et al. (2010) ‘3D reconstruction of histological sections: Application to mammary gland tissue’, Microscopy Research and Technique, pp. 1019–1029. doi: 10.1002/jemt.20829. - DOI - PubMed
    1. Basu S and Pan W (2011) ‘Comparison of statistical tests for disease association with rare variants’, Genetic epidemiology, 35(7), pp. 606–619. - PMC - PubMed
    1. Benner C et al. (2016) ‘FINEMAP: efficient variable selection using summary data from genome-wide association studies’, Bioinformatics, 32(10), pp. 1493–1501. - PMC - PubMed
    1. Benner C et al. (2017) ‘Prospects of Fine-Mapping Trait-Associated Genomic Regions by Using Summary Statistics from Genome-wide Association Studies’, American journal of human genetics, 101(4), pp. 539–551. - PMC - PubMed
    1. van Berkum NL et al. (2010) ‘Hi-C: a method to study the three-dimensional architecture of genomes’, Journal of visualized experiments: JoVE, (39). doi: 10.3791/1869. - DOI - PMC - PubMed

Publication types

MeSH terms

Substances

LinkOut - more resources