. 2022 May;101(5):534-541.
doi: 10.1177/00220345211049395. Epub 2022 Jan 20.

HCV Infection Alters Salivary Gland Histology and Saliva Composition

Affiliations

HCV Infection Alters Salivary Gland Histology and Saliva Composition

J O Maldonado et al. J Dent Res. 2022 May.

Abstract

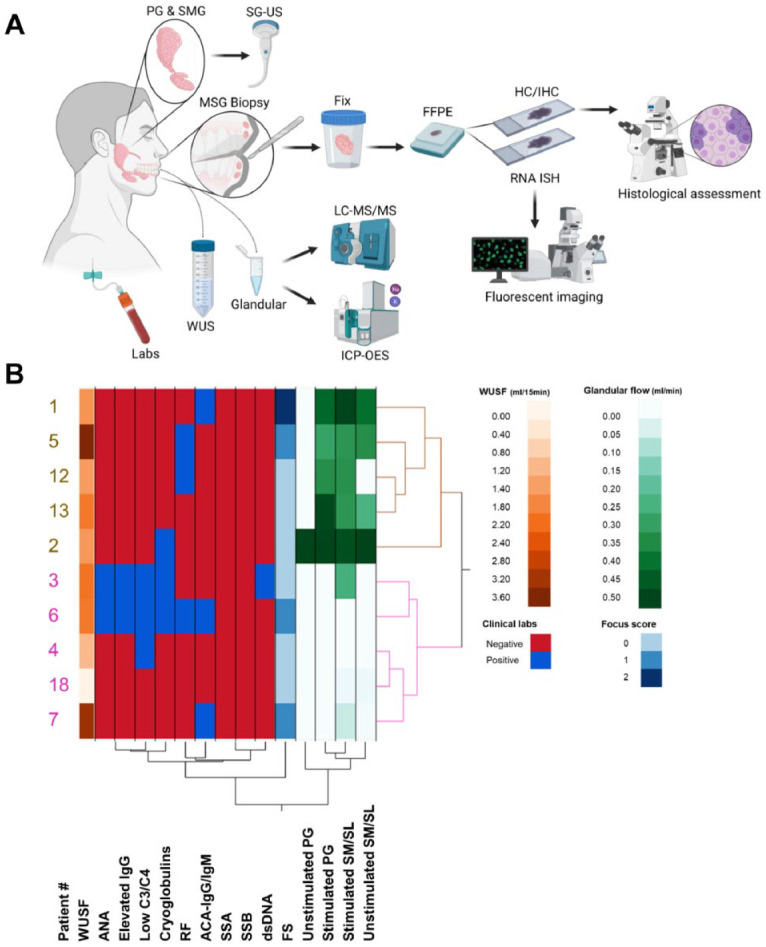
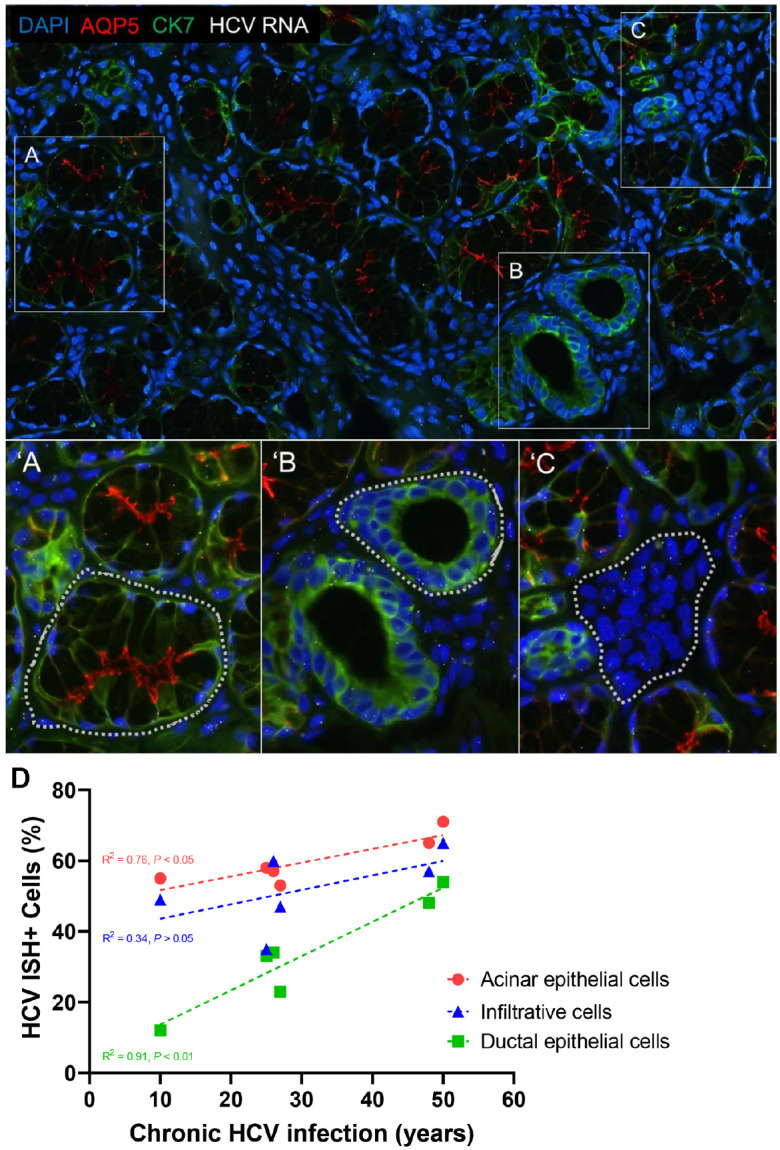
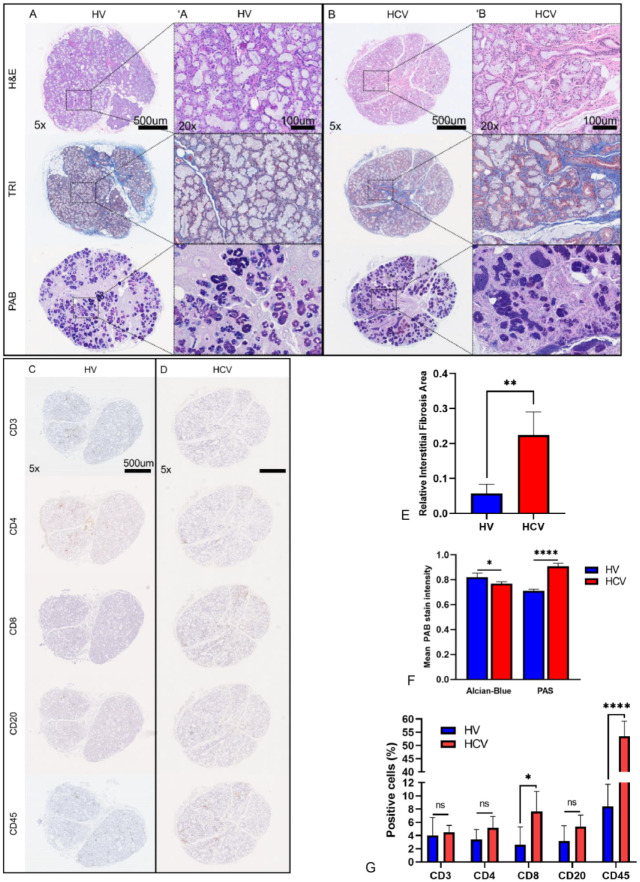
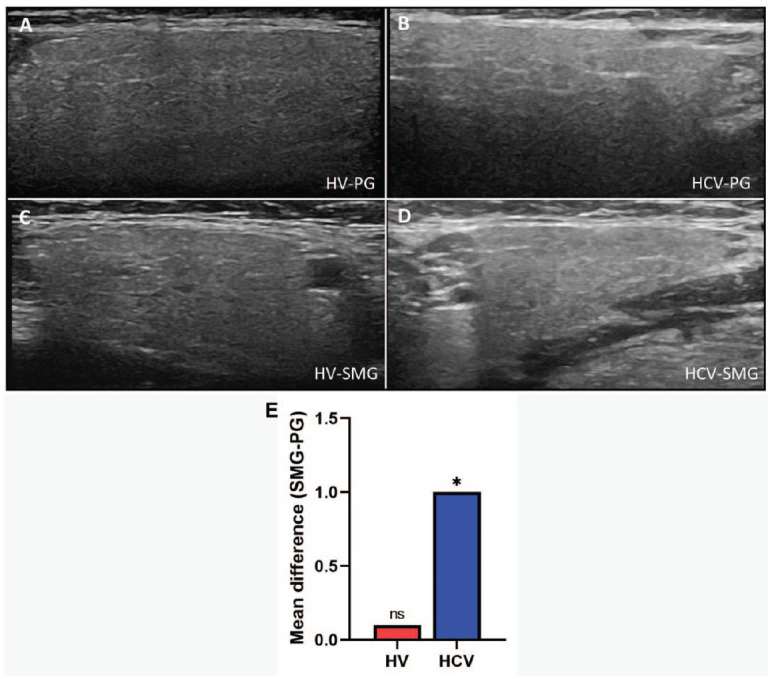
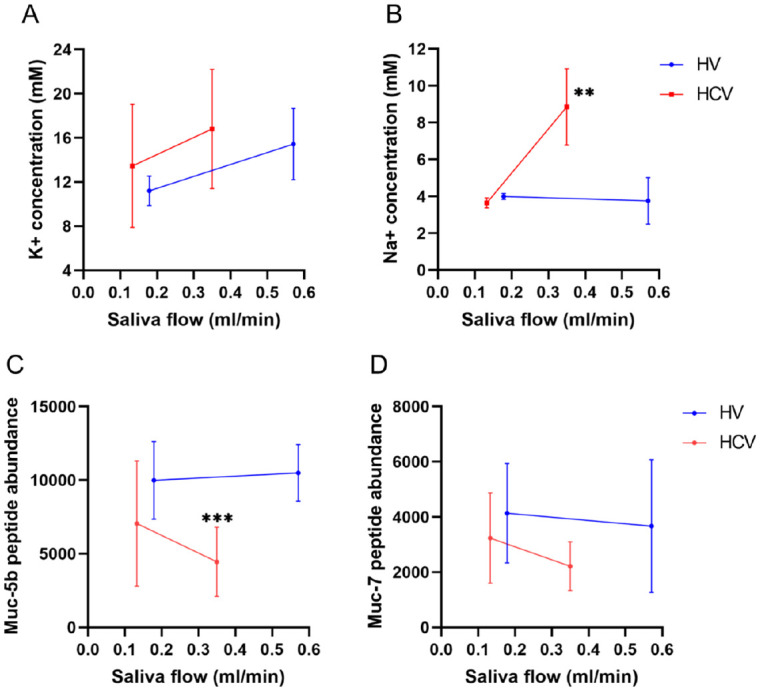
Hepatitis C virus (HCV) infection is the most common blood-borne chronic infection in the United States. Chronic lymphocytic sialadenitis and sicca syndrome have been reported in chronic HCV infection. Up to 55% of these patients may have xerostomia; the mechanisms of the xerostomia and salivary gland (SG) hypofunction remain controversial. The objectives of this project are to establish if xerostomia associates with SG and HCV infection and to characterize the structural changes in SG and saliva composition. Eighteen HCV-infected patients with xerostomia were evaluated for SG dysfunction; 6 of these patients (patients 1-6) were further evaluated for SG histopathological changes and changes in saliva composition. The techniques used include clinical and laboratory assessment, SG ultrasonography, histological evaluation, sialochemical and proteomics analysis, and RNA in situ hybridization. All the HCV patients had low saliva flow, chronic sialadenitis, and SG fibrosis and lacked Sjögren syndrome (SS) characteristic autoantibodies. Further evaluation of a subgroup of 6 HCV patients (patients 1-6) demonstrated diffuse lymphocytic infiltrates that are predominantly CD8+ T cells with a significant increase in the number of inflammatory cells. Alcian Blue/periodic acid-Schiff staining showed significant changes in the ratio and intensity of the acinar secretory units of the HCV patients' minor SG. The submandibular glands showed significant ultrasonographic abnormalities in the parenchyma relative to the parotid glands. Significant changes were also observed in the concentration of sodium and mucin 5b. Although no significant correlation was observed between the lymphocytic infiltrates and the years of HCV chronic infection, a positive correlation was observed between HCV RNA-positive epithelial cells and the years of HCV infection. Consistent with the low saliva flow and xerostomia, patients showed changes in several markers of SG acinar and ductal function. Changes in the composition of the saliva suggest that HCV infection can cause xerostomia by mechanisms distinct from SS.

Keywords: Sjögren’s syndrome; chronic infection; salivary hypofunction; sialadenitis; sicca syndrome; xerostomia.


Conflict of interest statement

Declaration of Conflicting Interests: The authors declared no potential conflicts of interest with respect to the research, authorship, and/or publication of this article.

Figures

Figure 1.
Figure 1.
Study design, clinical parameters, and sialometry. This study evaluated and enrolled 18 HCV–positive patients with complaints of xerostomia to understand the role that viruses play in the development of inflammation and dysfunction of the SG. Diagram depicts collection of blood, saliva fluids, and SG specimens from HVs and HCV patients for evaluation. Submandibular/sublingual saliva was used for sialometry and sialochemistry (i.e., sodium, potassium, and protein composition). Salivary gland ultrasonography was performed in the PG and SMG of study participants. Lower lip MSG biopsies were collected and fixed in formalin, and tissue sections were prepared from FFPE blocks for staining (i.e., H&E, TRI, PAB, IHC, RNA ISH) and histologically assessed (A). Hierarchical clustering analysis was used to identify groupings of patients who shared clinical features and chose representative patients of each group (patients with limited clinical data may not be shown in the diagram) (B). Two distinct clusters of patients were found among the HCV patients evaluated in this study (depicted in brown and pink), those with and without measurable glandular saliva flow. Patients 1, 2, and 5 represent patients from the group with measurable glandular saliva flow; patients 3, 4, and 6 represent patients from the group without measurable glandular saliva flow. Diagram made with Biorender. ACA, anticardiolipin antibodies; ANA, antinuclear antigen; FFPE, formalin fixed, paraffin embedded; FS, focus score; HCV, hepatitis C virus; HV, healthy volunteer; H&E, hematoxylin and eosin; IHC, immunohistochemistry; ISH, in situ hybridization; MSG, minor salivary gland; PAB, Alcian Blue/periodic acid–Schiff; PG, parotid gland; RF, rheumatoid factor; SG, salivary gland; SGUS, salivary gland ultrasonography; SLG, sublingual gland; SM, submandibular; SMG, submandibular gland; SS-A, Sjögren antibody A; SS-B, Sjögren antibody B; TRI, Masson’s trichrome; WUSF, whole unstimulated saliva flow.
Figure 2.
Figure 2.
Lip salivary gland biopsy HCV–RNA in situ hybridization. RNA ISH was used to investigate the presence and tropism of HCV in the salivary glands. Representative images of HCV RNA detection by RNAscope assay in acinar epithelial cells (A), ductal epithelial cells (B), and interlobular inflammatory cells (C). The percentage of acinar (′A), ductal (′B), and inflammatory (′C) cells expressing 1 or more HCV RNA ISH dots was calculated from the regions demarcated with a dotted line. Correlation of HCV RNA ISH signal and years of chronic HCV infection (D) with a XY graph illustrating the association between percentage of salivary gland (SG) acinar epithelial cells (red; P < 0.05; r = 0.8706), ductal epithelial cells (green; P < 0.01; r = 0.9537), and infiltrative cells (blue; P > 0.05; r = 0.5791) staining positive for HCV genomic RNA and the years of HCV infection. Each dot represents an individual case, and the colored dotted line represents a linear regression of the data. This observation suggests that during the course of the chronic infection, the virus is not static and continues to spread, a correlation that, to our knowledge, has not been reported for chronic liver infection and the percentage of HCV RNA–positive hepatocytes. Our study did not find a direct correlation between HCV RNA–positive SG epithelial cells and SG hypofunction or sialadenitis, as well as no correlation between the serum levels of HCV RNA and the percentage of SG HCV RNA ISH–positive cells. The brightness and contrast were adjusted equally among all the images for clarity. Blue, DAPI stain; green, cytokeratin 7 stain; red, AQP5 stain; white, HCV RNA; HCV, hepatitis C virus; ISH, in situ hybridization. Significance was set at P ≤ 0.05.
Figure 3.
Figure 3.
Glandular histopathology. Histological comparison of representative MSGB for each of the staining (A, B) and a basic immune panel (C, D) from HV and patients with HCV-induced xerostomia with mild chronic sialadenitis are shown, respectively. A 20× magnified region of the H&E-, TRI-, and PAB-stained tissue sections is shown for the HV (′A) and HCV (′B) patient, respectively. Increased interlobular fibrosis as highlighted by TRI staining (blue) relative to the HV is evident. All HCV patients presented a significant increase in RIFA compared to HV (E). Acinar atrophy and disorganization are evident in the HCV group, as highlighted by H&E and PAB staining (B, ′B). Increased glycoprotein expression as highlighted by PAS staining (dark purple) relative to the HV is evident. The HCV-induced xerostomia patients’ biopsies have a significant decrease in mucinous acini and a significant increase in serous acini as highlighted by PAB staining (F) and demonstrate a diffuse lymphocytic infiltration composed mainly of CD8+ T cells and a large population of histiocytes (D, G). H&E, hematoxylin and eosin; HCV, hepatitis C virus; HV, healthy volunteer; MSGB, minor salivary gland biopsy; PAB, Alcian Blue/PAS; PAS, periodic acid-Schiff; RIFA, relative interstitial fibrosis area; TRI, Masson’s trichrome. *P ≤ 0.05; **P ≤ 0.01; ****P ≤ 0.0001.
Figure 4.
Figure 4.
Salivary gland ultrasonography. Ultrasonography images of a PG of HV (A) and HCV (B) and of a SMG of HV (C) and HCV (D) are shown. Normal or abnormal parenchyma of the SG was evaluated from the entire image, including visibility of the PG posterior border. A simplified SGUS scoring system was used to assess parenchyma dyshomogeneity (Theander and Mandl 2014). The mean difference of the sum SMG and PG US score is shown (E). The HCV group SMG had a significantly higher SGUS score as compared to the HCV PG; the HV’s SMG showed a slightly higher SGUS score relative to the HV PG. Significance was set at P ≤ 0.05. HCV, hepatitis C virus; HV, healthy volunteer; SG, salivary gland; SGUS, salivary gland ultrasonography; SMG, submandibular gland; PG, parotid gland; US, ultrasonography. *P ≤ 0.05.
Figure 5.
Figure 5.
Sialochemistry. Limited sialochemical assessment was completed via ICP-OES analysis. An average of 2 values is reported (mM). The concentration of potassium (A) and sodium (B) in unstimulated saliva and stimulated saliva from HVs and HCV patients is shown in relation to the mean saliva flow (mL/min). The concentration of potassium was slightly increased during stimulation of saliva, while sodium significantly increased in the stimulated saliva of HCV patients relative to HVs, indicative of ductal epithelial dysregulation. Mass spectroscopy analysis was performed to assess changes in mucins concentration, which are thought to play an important role in the subjective sensation of moisture and lubricity, mainly mucin 5b and mucin 7. In this study, mucin 5b (C) and mucin 7 (D) were decreased in the saliva of the HCV patients. Mucin 5b was significantly decreased in the stimulated saliva of the HCV patients. Mucin 5b is a sticky, gel-forming high molecular weight mucin that forms multimers and a viscous coating that traps water molecules, which provides lubrication and moistening of the oral cavity. Mucin 7, a watery, monomeric low molecular weight mucin, absorbs much less water than mucin 5b. Thus, changes in the quantity, quality, or hydration of mucins may play a role in the perception of oral dryness and desiccation. Significance was set at P ≤ 0.05. HCV, hepatitis C virus; HV, healthy volunteer; ICP-OES, inductively coupled plasma optical emission spectroscopy; K+, potassium; mM, millimolar; MS, mass spectroscopy; muc-5b, mucin 5b; muc-7, mucin 7; Na+, sodium. **P ≤ 0.01; ***P ≤ 0.001.

Similar articles

Cited by

References

    1. Aceti A, Taliani G, Sorice M, Amendolea MA. 1992. HCV and Sjögren’s syndrome. Lancet. 339(8806):1425–1426. - PubMed
    1. Alliende C, Kwon YJ, Brito M, Molina C, Aguilera S, Perez P, Leyton L, Quest AF, Mandel U, Veerman E, et al.. 2008. Reduced sulfation of MUC5B is linked to xerostomia in patients with Sjögren syndrome. Ann Rheum Dis. 67(10):1480–1487. - PubMed
    1. Arrieta JJ, Rodriguez-Inigo E, Ortiz-Movilla N, Bartolome J, Pardo M, Manzarbeitia F, Oliva H, Macias DM, Carreno V. 2001. In situ detection of hepatitis C virus RNA in salivary glands. Am J Pathol. 158(1):259–264. - PMC - PubMed
    1. Baumert TF, Berg T, Lim JK, Nelson DR. 2019. Status of direct-acting antiviral therapy for hepatitis C virus infection and remaining challenges. Gastroenterology. 156(2):431–445. - PMC - PubMed
    1. Brito-Zerón P, Gheitasi H, Retamozo S, Bové A, Londoño M, Sánchez-Tapias J-M, Caballero M, Kostov B, Forns X, Kaveri SV. 2015. How hepatitis C virus modifies the immunological profile of Sjögren syndrome: analysis of 783 patients. Arthritis Res Ther. 17(1):1–9. - PMC - PubMed

Publication types