

Subversion of Serotonin Receptor Signaling in Osteoblasts by Kynurenine Drives Acute Myeloid Leukemia
- PMID: 35046097
- PMCID: PMC8983599
- DOI: 10.1158/2159-8290.CD-21-0692
Subversion of Serotonin Receptor Signaling in Osteoblasts by Kynurenine Drives Acute Myeloid Leukemia
Abstract
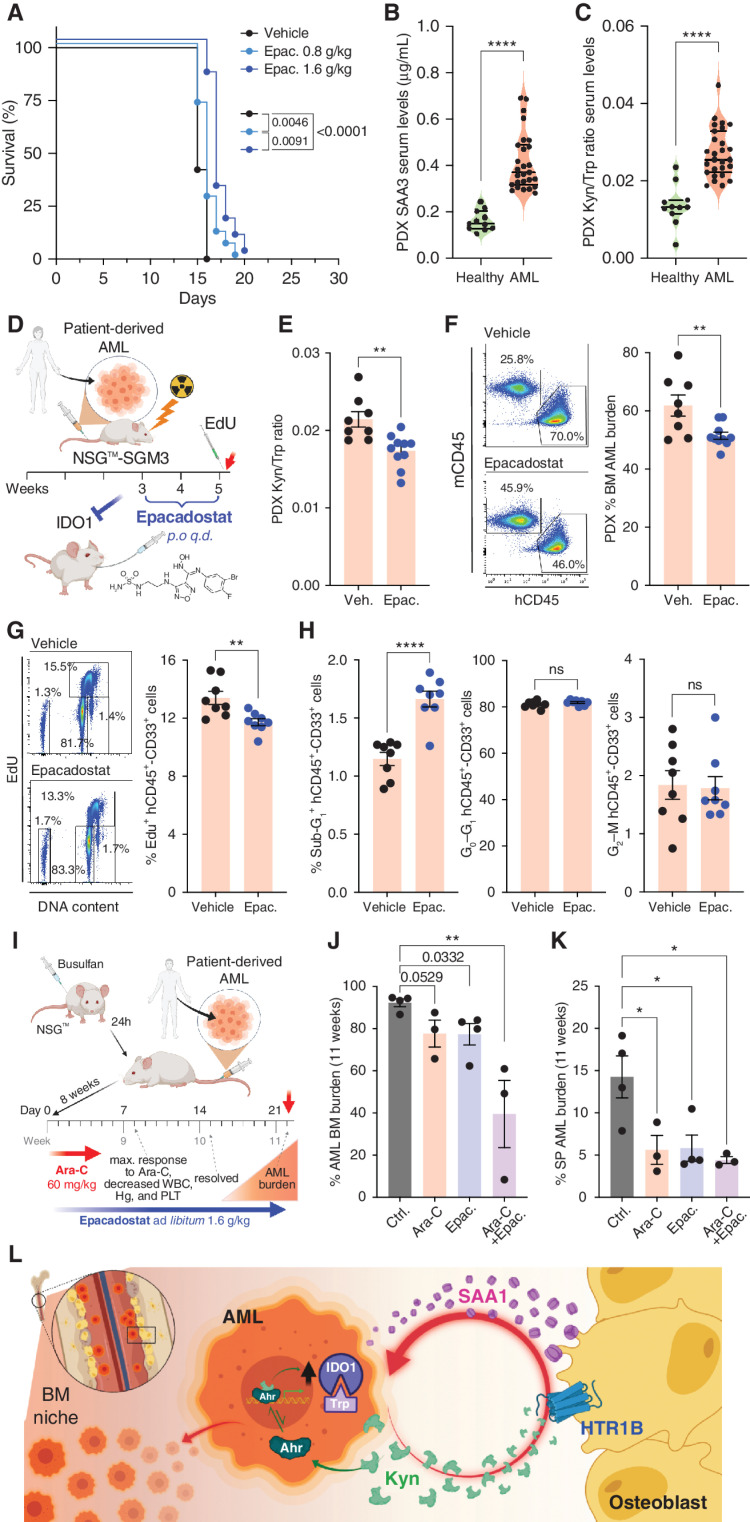
Remodeling of the microenvironment by tumor cells can activate pathways that favor cancer growth. Molecular delineation and targeting of such malignant-cell nonautonomous pathways may help overcome resistance to targeted therapies. Herein we leverage genetic mouse models, patient-derived xenografts, and patient samples to show that acute myeloid leukemia (AML) exploits peripheral serotonin signaling to remodel the endosteal niche to its advantage. AML progression requires the presence of serotonin receptor 1B (HTR1B) in osteoblasts and is driven by AML-secreted kynurenine, which acts as an oncometabolite and HTR1B ligand. AML cells utilize kynurenine to induce a proinflammatory state in osteoblasts that, through the acute-phase protein serum amyloid A (SAA), acts in a positive feedback loop on leukemia cells by increasing expression of IDO1-the rate-limiting enzyme for kynurenine synthesis-thereby enabling AML progression. This leukemia-osteoblast cross-talk, conferred by the kynurenine-HTR1B-SAA-IDO1 axis, could be exploited as a niche-focused therapeutic approach against AML, opening new avenues for cancer treatment.
Significance: AML remains recalcitrant to treatments due to the emergence of resistant clones. We show a leukemia-cell nonautonomous progression mechanism that involves activation of a kynurenine-HTR1B-SAA-IDO1 axis between AML cells and osteoblasts. Targeting the niche by interrupting this axis can be pharmacologically harnessed to hamper AML progression and overcome therapy resistance. This article is highlighted in the In This Issue feature, p. 873.
©2022 The Authors; Published by the American Association for Cancer Research.
Figures
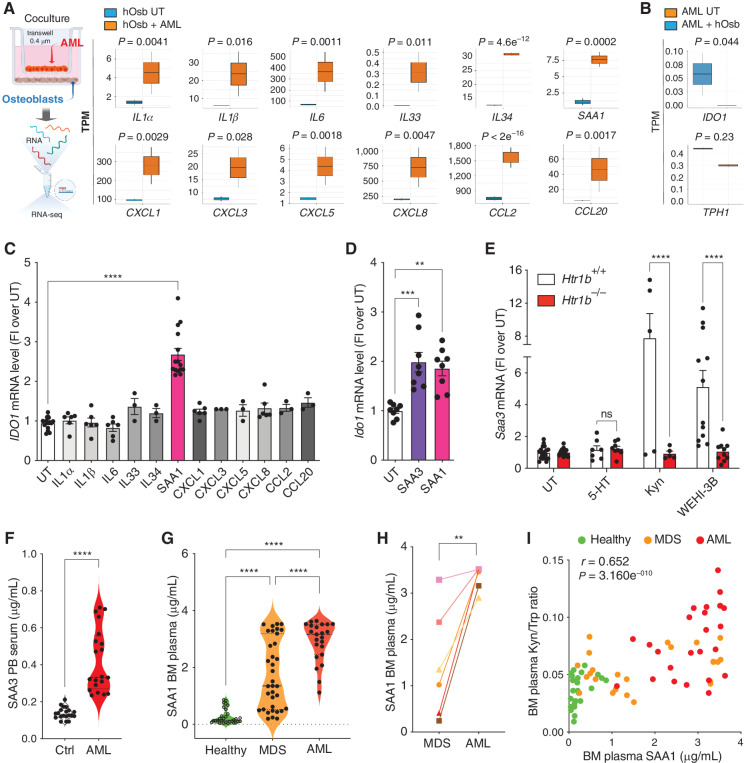
![Figure 2. Kynurenine (Kyn) is an oncometabolite increased in the BM niche of patients with MDS and AML that binds to HTR1B. A and B, Volcano plots for metabolites with CV <30% comparing OCI-AML3 cells untreated (AML) and human osteoblasts (hOsb; A) or AML cells untreated versus cocultures (24 hours). In B, arrows point to Kyn. C, Tryptophan (Trp) catabolism scheme. D, Relative abundance of Trp and its catabolic metabolites: Kyn, serotonin (5-HT), and 5-hydroxytryptophan (5-HTP) in the indicated supernatants at 24 hours (n = 6); two-way ANOVA. E, Heat map of the first 30 metabolites with CV <15% and histograms of fold induction (FI) of AML versus hOsb (gray) or AML versus coculture (blue). F, Violin plots of Kyn/Trp ratio levels in serum circulating levels of control-injected (n = 19) versus MLL/AF9-injected (n = 28) mice; unpaired t test. G, Violin plots of Kyn/Trp ratio levels in BM plasma from healthy donors (n = 27), MDS (n = 30), and AML (n = 24) patients; one-way ANOVA. H, Kyn/Trp levels in paired BM plasma samples at MDS stage and its corresponding transformed AML stage (n = 6); paired t test. I, RNA-sequencing analysis of BM-MNCs from patients with MDS (n = 30) and AML (n = 30) patients (TPM) for TPH1 and IDO1; two-way ANOVA. J, IDO1/TPH1 mRNA ratio in BM-MNCs from healthy donors (n = 32), patients with MDS (n = 10), and patients with AML (n = 20); one-way ANOVA. K, Concentration dependence of the Kyn-mediated competition of [3H]-5-HT (25 nmol/L, 41.3Ci/mmol) binding by HEK293T membranes overexpressing the mouse (n = 4 experiments) or the human receptor (n = 2 experiments), yielding an IC50 of 54.1 μmol/L and 24.4 μmol/L, respectively (see Table 1 for details). L, Gi/o-mediated cAMP inhibition assays (n = 14). M, Binding of [3H]-5-HT (25 nmol/L, 41.3 Ci/mmol) or [3H]-Kyn (50 μmol/L, 0.125 Ci/mmol) was measured with Htr1b-overexpressing HEK293T membranes in the presence of increasing concentrations of SB9 (n = 4). Nonlinear regression fitting was used to fit the isotherms, and the best-fit values and statistics of the fit are shown in Table 1. All data are expressed as mean ± SEM. *, P ≤ 0.05; **, P ≤ 0.01; ***, P ≤ 0.001; ****, P ≤ 0.0001. See also Supplementary Fig. S2 and Table 1.](https://cdn.ncbi.nlm.nih.gov/pmc/blobs/90b7/9394382/fccad5d5a06c/1106fig2.jpg)
Comment in
- Cancer Discov. 12:873.
- Cancer Discov. 12:873.
References
-
- Zhang J, Niu C, Ye L, Huang H, He X, Tong W-Get al. . Identification of the haematopoietic stem cell niche and control of the niche size. Nature 2003;425:836–41. - PubMed
Publication types
MeSH terms
Substances
Grants and funding
LinkOut - more resources
Full Text Sources
Medical
Molecular Biology Databases
Research Materials
