. 2022 Jan 19;76(5):471-481.
doi: 10.1136/jech-2021-217480. Online ahead of print.

Health trends, inequalities and opportunities in South Africa's provinces, 1990-2019: findings from the Global Burden of Disease 2019 Study

Affiliations

Health trends, inequalities and opportunities in South Africa's provinces, 1990-2019: findings from the Global Burden of Disease 2019 Study

Tom Achoki et al. J Epidemiol Community Health. .

Abstract

Background: Over the last 30 years, South Africa has experienced four 'colliding epidemics' of HIV and tuberculosis, chronic illness and mental health, injury and violence, and maternal, neonatal, and child mortality, which have had substantial effects on health and well-being. Using data from the 2019 Global Burden of Diseases, Injuries and Risk Factors Study (GBD 2019), we evaluated national and provincial health trends and progress towards important Sustainable Development Goal targets from 1990 to 2019.

Methods: We analysed GBD 2019 estimates of mortality, non-fatal health loss, summary health measures and risk factor burden, comparing trends over 1990-2007 and 2007-2019. Additionally, we decomposed changes in life expectancy by cause of death and assessed healthcare system performance.

Results: Across the nine provinces, inequalities in mortality and life expectancy increased over 1990-2007, largely due to differences in HIV/AIDS, then decreased over 2007-2019. Demographic change and increases in non-communicable diseases nearly doubled the number of years lived with disability between 1990 and 2019. From 1990 to 2019, risk factor burdens generally shifted from communicable and nutritional disease risks to non-communicable disease and injury risks; unsafe sex remained the top risk factor. Despite widespread improvements in healthcare system performance, the greatest gains were generally in economically advantaged provinces.

Conclusions: Reductions in HIV/AIDS and related conditions have led to improved health since 2007, though most provinces still lag in key areas. To achieve health targets, provincial governments should enhance health investments and exchange of knowledge, resources and best practices alongside populations that have been left behind, especially following the COVID-19 pandemic.

Keywords: HIV; health policy; healthcare disparities; public health.


Conflict of interest statement

Competing interests: AES reports personal fees from Servier, Novartis,Takeda, Omron Healthcare, and Abbott, outside the submitted work. DJS reports personal fees from Lundbeck, Takeda, Johnson & Johnson, and Servier, outside the submitted work.

Figures
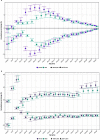
Figure 1
Figure 1
Annualised per cent change in age-specific and sex-specific mortality rates, 1990–2007 and 2007–2019. (A) all-cause mortality. (B) HIV/AIDS-specific mortality.
Figure 2
Figure 2
Contribution of various causes of death to changes in life expectancy (both sexes combined) by province. (A) Change in life expectancy between 1990 and 2007. (B) change in life expectancy between 2007 and 2019. In either panel, the vertical dotted lines denote life expectancy at the beginning of the period, and the solid vertical lines denote life expectancy at the end of the period. The figure is interpreted as follows. (A) since there was a decline in life expectancy over 1990–2007, causes of death that contributed to the loss of life expectancy are shown to the left of the vertical dotted lines, and causes of death that offset the loss of life expectancy are shown to the right of the vertical dotted lines. (B) since life expectancy increased over 2007–2019, causes of death that contributed to this improvement are shown to the right of the vertical dotted lines, and causes of death that offset the gains are shown to the left of the vertical lines. STIs-sexually transmitted infections; TB-tuberculosis; NTDs-neglected tropical diseases; CKD-chronic kidney disease.
Figure 3
Figure 3
Annualised per cent change in YLDs (all ages, both sexes) by province, 1990–2019. The 21 leading causes of YLDs in 2019 (in descending order) are shown here, except for HIV/AIDS, which had annualised per cent change values that exceeded the scale of this figure by orders of magnitude. (A) Change over 1990–2007. (B) Change over 2007–2019. YLDs, years lived with disability.
Figure 4
Figure 4
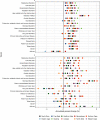
Heatmap showing top causes of age-standardised, risk-attributable DALYs per 100 000 population (both sexes) by province. (A) 1990. (B) 2007. (C) 2019. DALYs, disability-adjusted life-years. LDL-low-density lipoproteins.
Figure 5
Figure 5
GBD healthcare access and quality index values for South Africa and provinces compared with Southern African Development Community member states, 1990 and 2019. The GBD healthcare access and quality index is a summary measure of health system performance that incorporates estimates of age-standardised and risk-standardised mortality rates for 32 causes that are amenable to healthcare. The index scale ranges from 0 to 100, with higher values indicating better performance. GBD, Global Burden of Disease; SADC, Southern African Development Community.
Figure 6
Figure 6
Progress towards achievement of key health-related sustainable development goal targets in South Africa and provinces. In each plot, the left hand y axis shows the observed annualised rate of change in the indicator over 2015–2019, the start of the SDG period. The right hand y axis shows the annualised rate of change in the indicator that would be required to achieve SDG target by 2030. Locations whose rates of change are on track or exceeding needed rates of change are shown as horizontal lines; locations whose rates of change are off track are shown as diagonal lines, with the slope of the line indicating the extent to which the location is off track (steeper slopes indicate locations that are further behind). NCD, noncommunicable disease

References

    1. Pillay-van Wyk V, Msemburi W, Laubscher R, et al. . Mortality trends and differentials in South Africa from 1997 to 2012: second National burden of disease study. Lancet Glob Health 2016;4:e642–53. 10.1016/S2214-109X(16)30113-9 - DOI - PubMed
    1. Mayosi BM, Benatar SR. Health and health care in South Africa--20 years after Mandela. N Engl J Med 2014;371:1344–53. 10.1056/NEJMsr1405012 - DOI - PubMed
    1. Chopra M, Lawn JE, Sanders D, et al. . Achieving the health millennium development goals for South Africa: challenges and priorities. Lancet 2009;374:1023–31. 10.1016/S0140-6736(09)61122-3 - DOI - PubMed
    1. Mayosi BM, Lawn JE, van Niekerk A, et al. . Health in South Africa: changes and challenges since 2009. Lancet 2012;380:2029–43. 10.1016/S0140-6736(12)61814-5 - DOI - PubMed
    1. Kleinert S, Horton R. South Africa's health: departing for a better future? Lancet 2009;374:759–60. 10.1016/S0140-6736(09)61306-4 - DOI - PubMed