. 2022 Mar 16;42(11):2149-2165.
doi: 10.1523/JNEUROSCI.1708-21.2022. Epub 2022 Jan 19.

KIFC1 Regulates the Trajectory of Neuronal Migration

Affiliations

KIFC1 Regulates the Trajectory of Neuronal Migration

Hemalatha Muralidharan et al. J Neurosci. .

Abstract

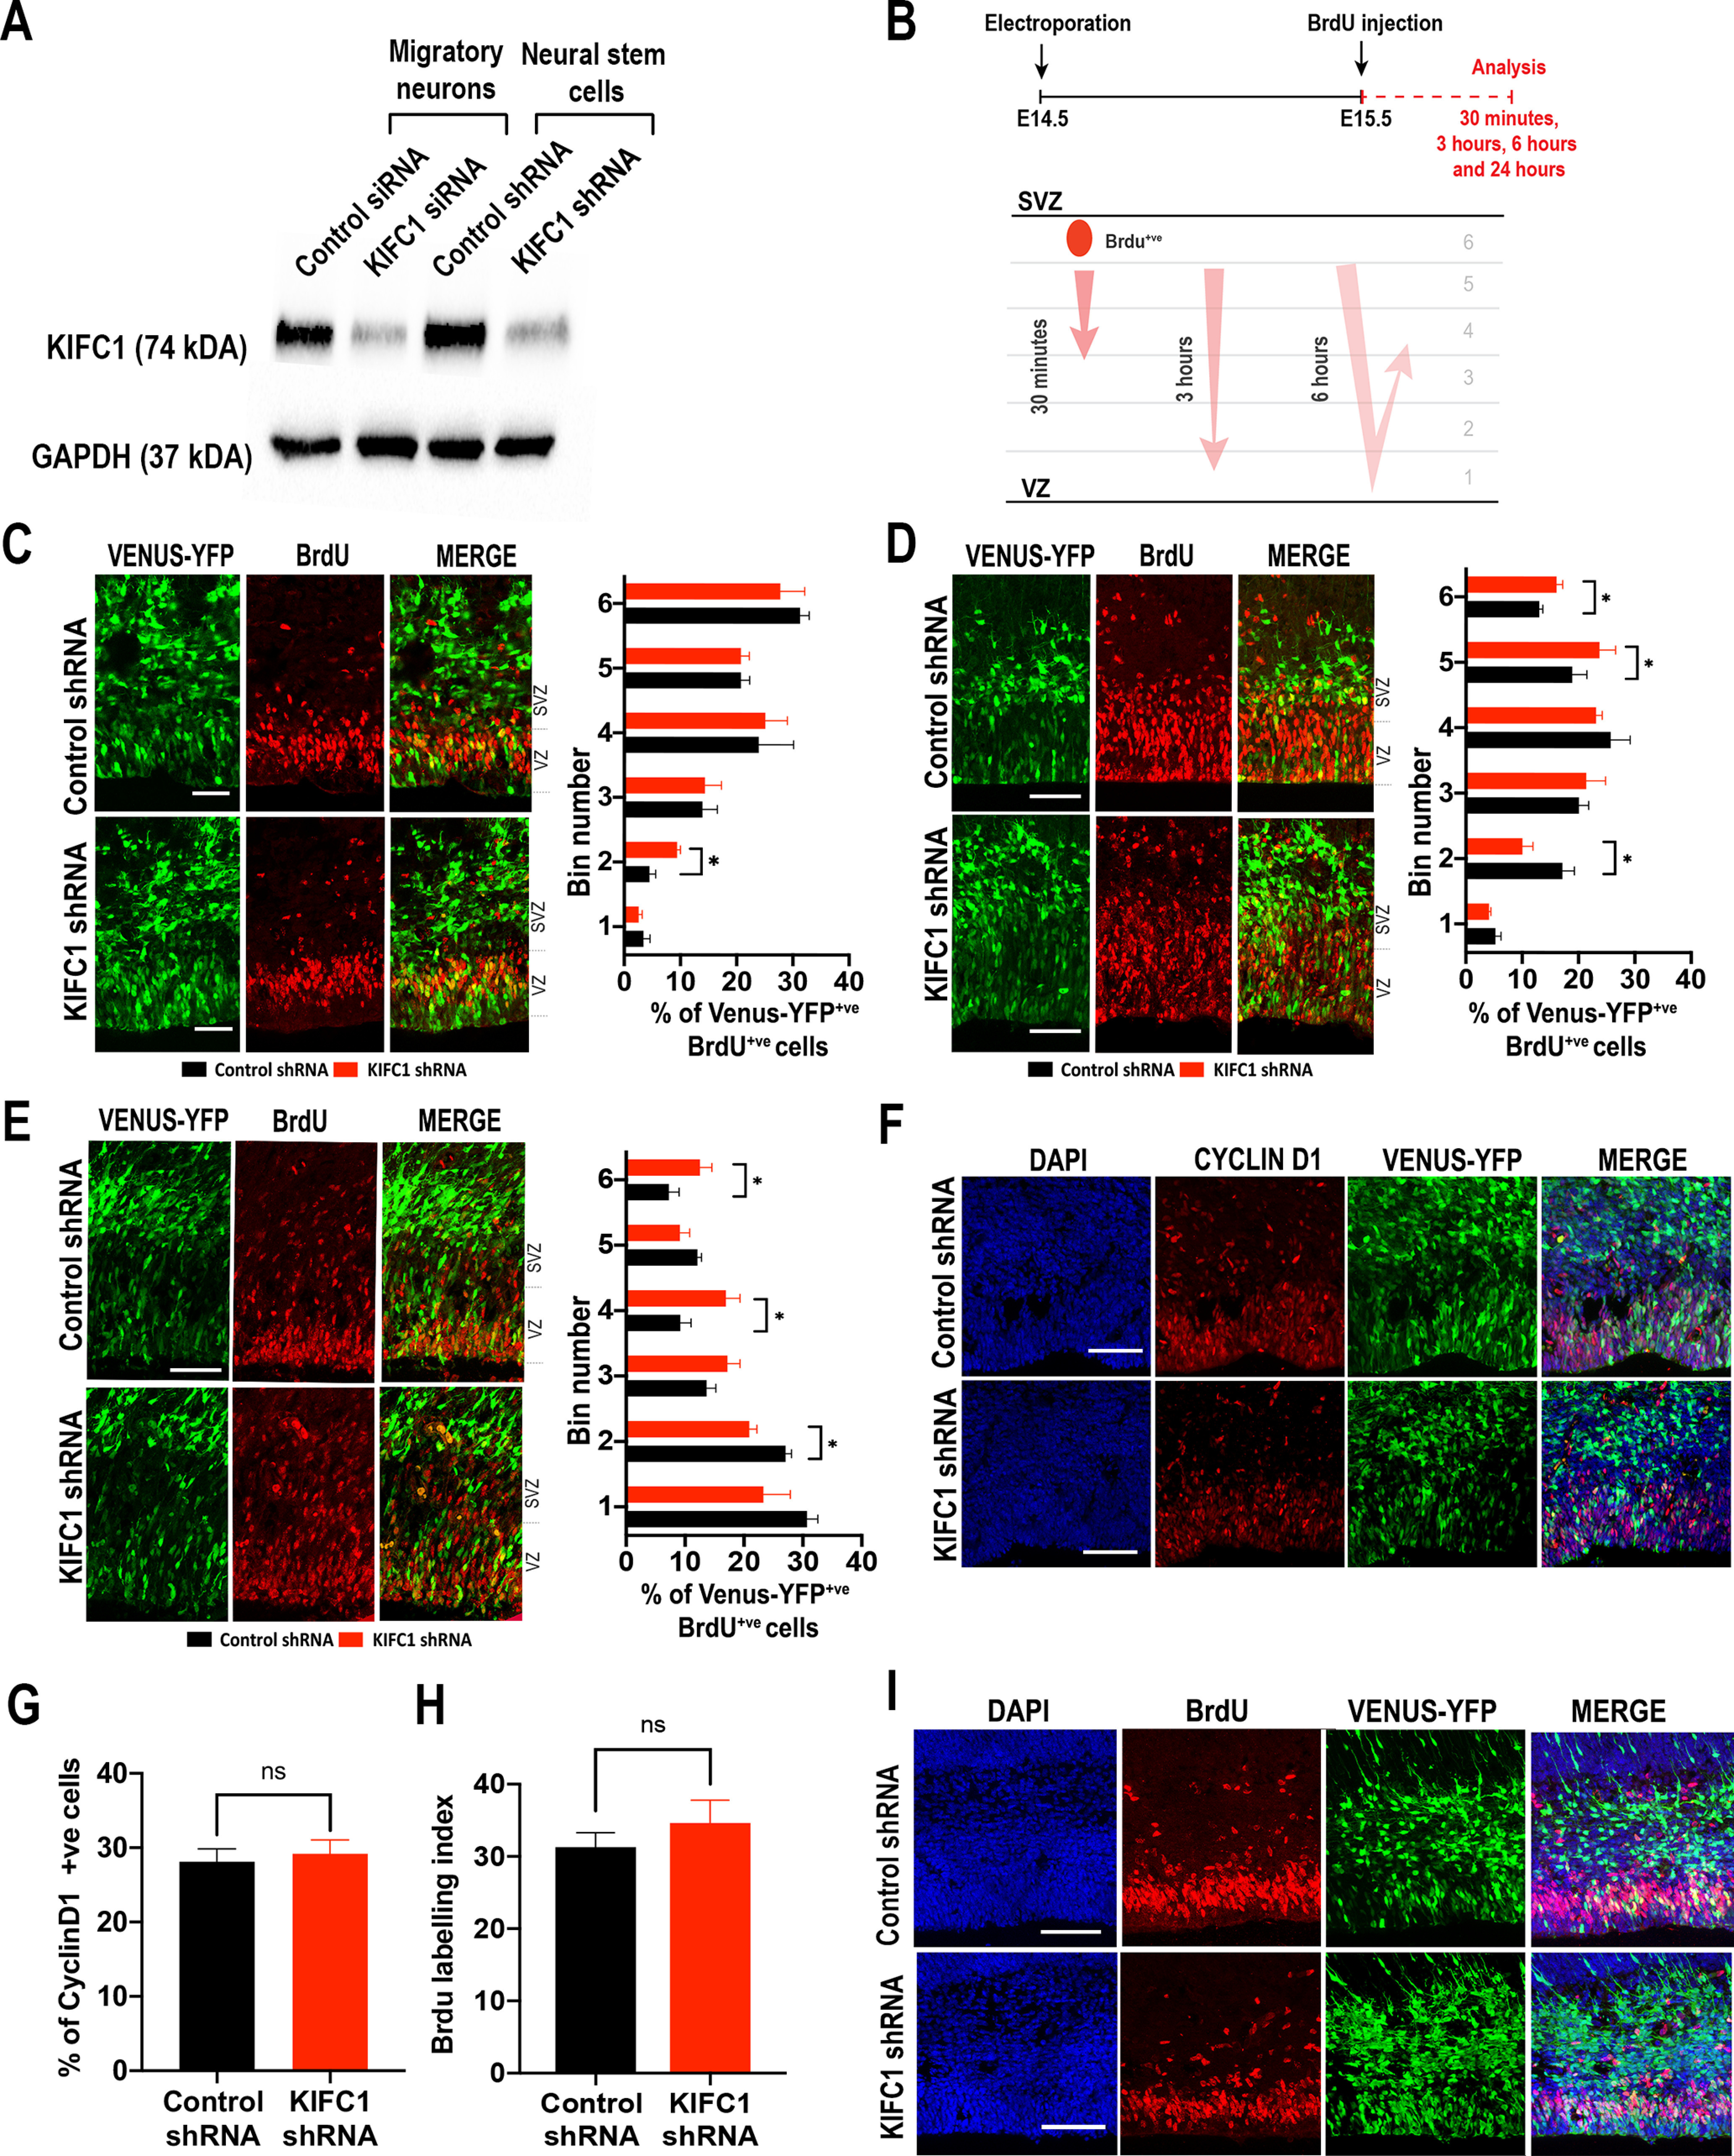
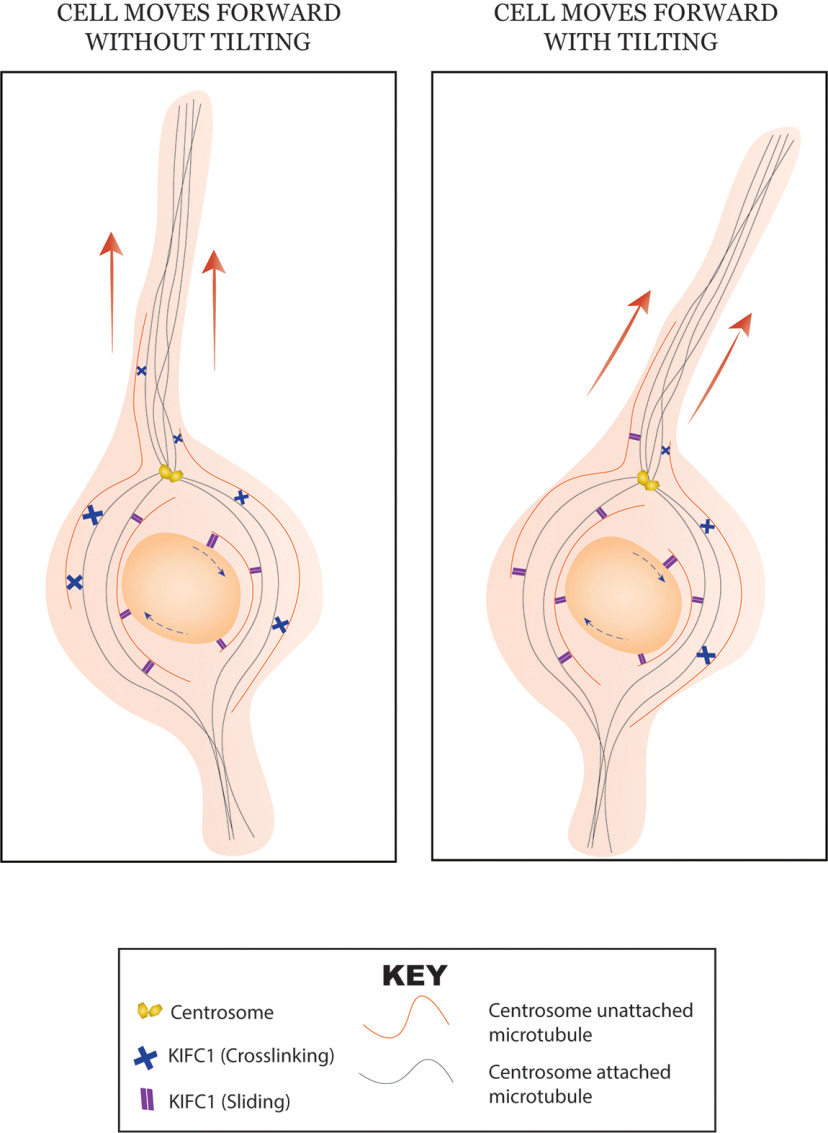
During neuronal migration, forces generated by cytoplasmic dynein yank on microtubules extending from the centrosome into the leading process and move the nucleus along microtubules that extend behind the centrosome. Scaffolds, such as radial glia, guide neuronal migration outward from the ventricles, but little is known about the internal machinery that ensures that the soma migrates along its proper path rather than moving backward or off the path. Here we report that depletion of KIFC1, a minus-end-directed kinesin called HSET in humans, causes neurons to migrate off their appropriate path, suggesting that this molecular motor is what ensures fidelity of the trajectory of migration. For these studies, we used rat migratory neurons in vitro and developing mouse brain in vivo, together with RNA interference and ectopic expression of mutant forms of KIFC1. We found that crosslinking of microtubules into a nonsliding mode by KIFC1 is necessary for dynein-driven forces to achieve sufficient traction to thrust the soma forward. Asymmetric bouts of microtubule sliding driven by KIFC1 thereby enable the soma to tilt in one direction or another, thus providing midcourse corrections that keep the neuron on its appropriate trajectory. KIFC1-driven sliding of microtubules further assists neurons in remaining on their appropriate path by allowing the nucleus to rotate directionally as it moves, which is consistent with how we found that KIFC1 contributes to interkinetic nuclear migration at an earlier stage of neuronal development.SIGNIFICANCE STATEMENT Resolving the mechanisms of neuronal migration is medically important because many developmental disorders of the brain involve flaws in neuronal migration and because deployment of newly born neurons may be important in the adult for cognition and memory. Drugs that inhibit KIFC1 are candidates for chemotherapy and therefore should be used with caution if they are allowed to enter the brain.

Keywords: HSET; KIFC1; cytoplasmic dynein; microtubule; molecular motor; neuronal migration.


Figures

Figure 1.
Figure 1.
KIFC1 is necessary for nuclear migration toward the VZ during INM. A, Representative Western blots show validation of KIFC1 depletion in migratory neurons using siRNA and depletion in neural progenitors (stem cells) using shRNA. B, Schematic of BrdU chase experiment used to study INM. Cerebral cortices from E13.5 embryos were electroporated in utero with KIFC1 or scrambled shRNA, and 24 h later subjected to 30 min, 3 h, or 6 h BrdU pulse labeling, followed by fixation and immunostaining for Venus-YFP and BrdU. Schematic also represents the destination of the BrdU chased cells at 30 min, 3 h, and 6 h. C, Representative immunofluorescence images from cerebral cortices of embryos electroporated in utero with KIFC1 or scrambled shRNA, coimmunostained for BrdU and DAPI, with bar graph representing the distribution of Venus-YFP+ BrdU+ cells after 30 min, 3 h (D) and 6 h (E) of BrdU pulse across the VZ, SVZ, and IZ, divided into 6 bins, with Bin 1 being at the ventricular surface and Bin 6 at the SVZ-IZ boundary. Venus-YFP+ BrdU+ cells are expressed as a percentage of total number of Venus-YFP+ BrdU+ cells in all bins. F, Representative immunofluorescence images from cerebral cortices of embryos coimmunostained for Cyclin-D1 and DAPI. G, Bar graph represents percentage of Cyclin-D1+ Venus-YFP+ cells. H, Bar graph represents percentage of BrdU+ Venus-YFP+ cells from both control and KIFC1 shRNA groups. I, Representative immunofluorescence images from cerebral cortices of embryos brain slices coimmunostained for BrdU and DAPI. Data are mean ± SEM from at least two sections per embryo, prepared from at least three embryos from at least three different pregnant mothers. All statistical test comparisons were performed between control shRNA/siRNA group with corresponding KIFC1 shRNA/siRNA group. Scale bars: C-E, 25 μm; F, 30 μm; I, 50 μm.
Figure 2.
Figure 2.
KIFC1 depletion disrupts INM. A, Representative immunofluorescence images from cerebral cortices of embryos coimmunostained for DAPI and KI67. B, Bar graph represents percentage of KI67+ Venus-YFP+ cells from control and KIFC1 shRNA groups and Ki67+ mScarlet+ Venus-YFP+ cells from rescue group (KIFC1 shRNA-WT HSET group). C, Representative immunofluorescence images from cerebral cortices of embryos coimmunostained for DAPI and PHH3. D, Violin graph represents the distribution of PHH3+ Venus-YFP+ cells from control and KIFC1 shRNA groups, and PHH3+ mScarlet+ Venus-YFP+ cells from rescue group over the 20 µm distance from the VZ (Control shRNA n = 37, KIFC1 siRNA = 45, KIFC1 shRNA WT-HSET = 22). E, Bar graph represents percentage of PHH3+ Venus-YFP+ cells from control and KIFC1 shRNA groups and PHH3+ mScarlet+ Venus-YFP+ cells from rescue group (KIFC1 shRNA-WT HSET group). F, Representative immunofluorescence images from cerebral cortices of embryos electroporated in utero with KIFC1 or scrambled shRNA, coimmunostained for BrdU, Ki67, and DAPI from cerebral cortices of embryos. G, Bar graph represents cell cycle exit index. The index was calculated by analyzing the number of BrdU+ Ki67 cells as a percentage of total number of BrdU+ cells. Data are mean ± SEM from at least two sections per embryo, prepared from at least three embryos from at least three different pregnant mothers. Statistical analysis was performed using Student's t test or ANOVA, and further multiple comparisons between groups were made using Bonferroni test. All statistical test comparisons were done against control shRNA group with KIFC1 shRNA group in the case of depletion experiments. In the case of rescue experiments, all comparisons were made between KIFC1 shRNA group and WT-HSET-mScarlet + KIFC1 shRNA group. Scale bars: A, C, 50 μm; F, 100 μm.
Figure 3.
Figure 3.
KIFC1 depletion results in premature mitotic exit. A, Representative immunofluorescence images from cerebral cortices of embryos electroporated in utero with KIFC1 or scrambled shRNA, coimmunostained for BrdU, Ki67, and DAPI. B, Bar graph represents the ratio of the number of transfected cells that are BrdU+ and Ki67+ to the number of transfected cells that are Ki67+ was used to estimate cell cycle duration. C, Bar graph represents percentage of PAX6+ Venus-YFP+ cells from both control and KIFC1 shRNA groups. D, Representative immunofluorescence images from cerebral cortices of embryo brain slices coimmunostained for DAPI and PAX6. E, Representative immunofluorescence images from cerebral cortices of embryos coimmunostained for DAPI and Tbr2. F, Bar graph represents percentage of Tbr2+ Venus-YFP+ cells from both control and KIFC1 shRNA groups. G, Representative immunofluorescence images from cerebral cortices of embryos coimmunostained for NeuN and DAPI. H, Bar graph represents percentage of NeuN+ Venus-YFP+ cells in the VZ+SVZ and IZ+CP regions from both control and KIFC1 shRNA groups. I, Schematic of effect of KIFC1 depletion on neural progenitor cells during INM. KIFC1 depletion inhibits the apical migration of the soma to the VZ because of cells prematurely exiting mitosis. Data are mean ± SEM from at least two sections per embryo, prepared from at least three embryos from at least three different pregnant mothers. Statistical analysis was performed using Student's t test or ANOVA, and further multiple comparisons between groups were made using Bonferroni test. All statistical test comparisons were done against control shRNA group with KIFC1 shRNA group in the case of depletion experiments. Scale bars: A, D, 50 μm; E, 100 μm; G, 200 μm.
Figure 4.
Figure 4.
KIFC1 depletion disrupts trajectory of postmitotic neuronal migrate. A, Representative immunofluorescence images from cerebral cortices of postnatal day 0 brain slices electroporated in utero with KIFC1 or scrambled shRNA, displaying the distribution of Venus-YFP+ over the developing cortex in control and KIFC1-depleted groups, mScarlet+ Venus-YFP+ cells from HSET rescue group. The rescue group included KIFC1 shRNA with mScarlet tagged WT-HSET to identify cells that are depleted of endogenous KIFC1 and expressing HSET. B, Bar graph represents distribution of Venus-YFP+ cells from control and KIFC1 shRNA-treated groups; Venus-YFP+/mScarlet+ cells from rescue group as a percentage across 5 bins. The 5 bins are divided equally along the outward length of developing cortex. Bin 1, ventral; Bin 5, dorsal. C, Representative ex vivo still images of Venus-YFP+ neurons (treated with scrambled or KIFC1 shRNA) at E17.5 for a period of 23 h, along with representative trajectory traces of control and KIFC1-depleted neurons respectively (CP, IZ, SVZ, and VZ). D, Polar histograms of average direction of control soma and KIFC1-depleted soma (E) movement throughout the period of imaging. Ninety degrees represents the CP, 0°/180 represents the IZ, and 270° represents the VZ/SVZ (Control shRNA n = 30, KIFC1 siRNA = 23). F, Scatter plot of individual points represents the average speed of Venus-YFP+ cells from both control and KIFC1 shRNA groups (Control shRNA n = 30, KIFC1 siRNA = 23). G, Bar graph represents percentage of migratory and stationary cells from both control and KIFC1 shRNA groups (Control shRNA n = 30, KIFC1 siRNA = 23). H, Representative immunofluorescence image of cultured migratory neurons as aggregates, treated with KIFC1 or scrambled siRNA, coimmunostained with βIII-tubulin and DAPI. Dashed line indicates the outer surface area occupied by the neurons of the aggregate (Control and KIFC1 siRNA n = 6 aggregates per group). I, Representative image of an aggregate of migratory neurons. Red line indicates the 20 µm bins used for analysis. J, Bar graph represents the percentage of cells moved out from the center of the aggregate. Each bar represents a group, including control, KIFC1 siRNA, crosslinking-only mutant, tail-stalk mutant, and WT-HSET (rescue) mutant groups (n = 6 aggregate per group). K, Bar graphs represent average speed of the soma from live imaging of the aggregate for a period of 30 min (net displacement: Control siRNA n = 25, KIFC1 siRNA n = 17; average speed: Control siRNA n = 18, KIFC1 siRNA n = 13). Data are mean ± SEM. For all in vivo experiments, data were collected from at least two sections per embryo, prepared from at least three embryos from at least three different pregnant mothers. All statistical test comparisons were performed between control shRNA/siRNA group with corresponding KIFC1 shRNA/siRNA group. In the case of rescue experiments, all comparisons were made between KIFC1 siRNA/shRNA group and mutant/WT-HSET + KIFC1 siRNA group. Statistical analysis was performed using ANOVA, and further multiple comparisons between groups were made using Bonferroni test. Scale bars: A, H, 50 μm; C, 25 μm; I, 100 μm.
Figure 5.
Figure 5.
KIFC1 is important for nuclear displacement during migration. A, Representative still images of control neurons (above) and KIFC1-depleted neurons (below) cotransfected with GFP (as a cell fill to demarcate morphology) and HP1β-RFP, for period 1 h. B, Line graph represents the displacement of control neurons (black) and KIFC1-depleted neurons (red) along with the rescue group (KIFC1 siRNA+ HSET-GFP) and the control (Control siRNA + GFP) over a period of 1 h. Shaded area represents the SEM of the line. Blue dashed line indicates a forward-backward displacement behavior in a subpopulation of KIFC1-depleted neurons. These subpopulations of neurons were excluded from analysis (Control siRNA n = 14, KIFC1 siRNA n = 12, KIFC1 siRNA [blue] n = 4). C, Bar graph represents outpocketing index, which represents the number of nuclei showing outpocketings for a period of at least 2 min over 100 cells in neurons treated with control siRNA, control siRNA with GFP, KIFC1 siRNA, and KIFC1 siRNA-treated neurons with HSET-GFP (n = 100). D, Box plot represents the duration of outpocketing in minutes in control siRNA, control siRNA with GFP, KIFC1 siRNA, and KIFC1 siRNA with HSET-GFP-treated groups (Control siRNA n = 20, KIFC1 siRNA n = 22, Control + GFP n = 13, KIFC1 + HSET-GFP n = 19). E, Representative still images of nuclei of control neurons and KIFC1-depleted neurons with additional rescue (KIFC1 siRNA+ HSET-GFP) and control (Control siRNA + GFP) groups over a period of 1 h, displaying outpocketings (red arrows) in KIFC1-depleted nuclei. Control siRNA-treated nuclei, with or without additional GFP, show transient forward peaking. The HSET-GFP plasmid can successfully rescue the phenotype in the KIFC1-depleted neurons. Data are mean ± SEM. In the case of rescue experiments, all comparisons were made between KIFC1 siRNA group and mutant/WT-HSET + KIFC1 siRNA group. Statistical testing was performed using Student's t test or ANOVA. Further multiple comparisons were made using post hoc analysis: Bonferroni test. Scale bar, 5 μm.
Figure 6.
Figure 6.
KIFC1 is indispensable for directional tilting of the nucleus by virtue of regulating its rotation. A, Representative still images of nucleus transfected using HP1β from both control and KIFC1 siRNA groups for a period of 1 min. Red arrow indicates movement of an HP1β spot over the period of 1 min. B, Representative scatter 3D plots of control nuclei and KIFC1-depleted nuclei (B′) HP1B trajectories. Black arrow indicates predictive average rotation axis from principal component analysis. C, Quarter polar plots represent the percentage of nuclei in control siRNA (orange), KIFC1 siRNA (blue), and the crosslinking-only (green) expressing neurons whose rotation axis is from 0° to 90°, where 0° is the leading process (Control siRNA n = 14, KIFC1 siRNA n = 16, Crosslinking-only mutant n = 14). D, Representative still image of nuclei of control neurons and KIFC1-depleted neurons transfected with HP1β-RFP, along with trajectory of three HP1β spots (blue, red, cyan) from nuclei control neurons (top), KIFC1-depleted neuron (middle and bottom). E, Stacked bar graph represents percentage of nuclei of migratory neurons which underwent 0, 1, 2, 3, or 4 rotations (n = 20 per group). F, Scatter plot of individual values represents the duration of nuclei rotation from control siRNA, control siRNA with GFP, KIFC1 siRNA, KIFC1 siRNA with HSET-GFP, and dynein siRNA-treated neurons (Control siRNA n = 24, KIFC1 siRNA n = 21, dynein siRNA n = 26, KIFC1 siRNA with HSET-GFP n = 22). G, Scatter plot of individual values represent the displacement of nuclei from control siRNA, control siRNA with GFP, KIFC1 siRNA, KIFC1 siRNA with HSET-GFP, and dynein siRNA-treated neurons (Control siRNA n = 34, KIFC1 siRNA n = 31, dynein siRNA n = 31, KIFC1 siRNA with HSET-GFP n = 22). H, Scatter plot of individual values represents the aspect ratio (length/width) of nuclei from control siRNA, KIFC1 siRNA, and dynein siRNA-treated neurons. Aspect ratio was calculated every 30 s for a period of 60 min (Control siRNA n = 12, KIFC1 siRNA n = 13, dynein siRNA n = 10). Data are mean ± SEM. In the case of rescue experiments, all comparisons were made between KIFC1 siRNA group and mutant/WT-HSET + KIFC1 siRNA group. Statistical testing was performed using Student's t test or ANOVA. Further multiple comparisons were made using post hoc analysis: Bonferroni test. Scale bar, 5 μm.
Figure 7.
Figure 7.
Loss of directional migration stresses the nucleus during migration. A, Representative immunofluorescence images of Lamin B1 and Lamin B2 (B) intensities of the soma of neurons treated with control siRNA, control siRNA with GFP, KIFC1 siRNA, and KIFC1 siRNA with HSET-GFP. KIFC1-depleted neurons are transfected with HSET-GFP to rescue the knockdown phenotype. C, Graph represents average intensity of Lamin B1 and Lamin B2 (D) from a line drawn across the nucleus toward the leading process, from control siRNA, control siRNA with GFP, KIFC1 siRNA, and KIFC1 siRNA with HSET-GFP (Lamin B1-Control siRNA n = 24, KIFC1 siRNA n = 24, Control + GFP n = 20, KIFC1 + HSET-GFP n = 17; Lamin B2-Control siRNA n = 17, KIFC1 siRNA n = 24, Control + GFP n = 17, KIFC1 + HSET-GFP n = 21). E, Bar graph represents percentage of neurons from control siRNA, KIFC1 siRNA, and dynein siRNA-treated groups with asymmetric nuclear lamina (n = 50 per group). F, Representative immunofluorescence images of the soma of neurons treated with control siRNA and KIFC1 siRNA-treated with DMSO or 50 μm Ciliobrevin D for period of 1 h, coimmunostained with βIII-tubulin, DAPI, and Lamin B1 or B2 (G). H, Graph represents average intensity of Lamin B1 and Lamin B2 (I) across the nucleus toward the leading process, from control siRNA and KIFC1 siRNA neurons treated with DMSO or 50 μm Ciliobrevin D for period of 1 h. Nuclear rims and nucleoplasm have been labeled for visualization of the line scan (Lamin B1 n = 26 per group; Lamin B2 = 27 per group). J, Bar graph represents percentage of neurons with asymmetric nuclear lamina from control siRNA and KIFC1 siRNA-treated with DMSO and Ciliobrevin D (n = 50 per group). Data are mean ± SEM. Statistical testing was performed between control siRNA group, KIFC1 siRNA, and dynein siRNA group using ANOVA. Further multiple comparisons were made using post hoc analysis: Bonferroni test. In the case of rescue experiments, all comparisons were made between KIFC1 siRNA group to mutant/WT-HSET + KIFC1 siRNA group. For drug experiments, groups subjected to drug was compared with its appropriate DMSO group. Statistical testing was done using ANOVA. Further multiple comparisons were made using post hoc analysis: Bonferroni test. Scale bar, 3 μm.
Figure 8.
Figure 8.
KIFC1 regulates directional migration by regulating bouts of microtubule sliding. A, Representative still images of the soma of neurons treated with control siRNA or KIFC1 siRNA, cotransfected with EB3-GFP and hcent2-RFP, along with representative trajectories of EB3 comets over the period 3 min. B, Bar graph represents the percentage of comets moving away from leading process (to the back of the centrosome) and toward the leading process (toward the front of the centrosome) (Control siRNA n = 30, KIFC1 siRNA n = 28). C, Schematic illustration of the microtubule sliding assay. To visualize evidence of microtubule sliding, we used the red channel and looked for the red fluorescence of the photoconverted zone to gradually spread into the flanking regions. We also merged the red channel with green channel to see emergence of yellow in the flanking regions of the bleached zone over a period of 10 min. D, Graph represents the average fluorescence intensity plot of converted tubulin along the length of the leading process from control siRNA and KIFC1-depleted neurons at 0 and 10 min (Control siRNA n = 15, KIFC1 siRNA n = 16). E, Representative fluorescence images of the leading process where photoconverted tubulin emerged after photoconversion at the soma. Images represented from 0 and 10 min displaying the spread in fluorescence signal of control and depletion groups. F, Representative fluorescence images of migratory neurons shown in green and red channel, along with the merge of these two that show the emergence of yellow in the proximal region of the leading process flanking near the photoconverted region of the soma. G, Box plot represents the percentage of fluorescence intensity signal decay at the soma and leading process (H) from control siRNA, control siRNA with Flag, KIFC1 siRNA, KIFC1 siRNA with Flag-HSET, and crosslinking-only mutant (HSET-N598K) neurons over a period of 10 min (Control siRNA n = 21, KIFC1 siRNA n = 25, crosslinking-only mutant n = 16, Control + Flag n = 12, KIFC1 + Flag-HSET n = 16). Data are mean ± SEM. In the case of rescue experiments, all comparisons were made between KIFC1 siRNA group and mutant/WT-HSET + KIFC1 siRNA group. Statistical testing was performed using Student's t test or ANOVA. Further multiple comparisons were made using post hoc analysis: Bonferroni test. Scale bar, 5 μm.
Figure 9.
Figure 9.
KIFC1's microtubule sliding, and crosslinking functions regulate the trajectory neuronal migration in two ways. Schematic illustration of the proposed role of KIFC1's sliding (=) and crosslinking (X) functions in regulating the trajectory neuronal migration. It is proposed here that crosslinking of the centrosome-attached (black) and centrosome-unattached (red) microtubules by KIFC1 provides traction for dynein-driven forces to move the soma forward, such that KIFC1 switching to its sliding mode on one side of the neuron enables it to tilt its trajectory in the opposite direction. In the meantime, KIFC1-based microtubule sliding is always active around the nucleus, to provide for fluid forward rotation of the nucleus as the neuron moves, either with or without tilting.

References

    1. Ahmad FJ, Hughey J, Wittmann T, Hyman A, Greaser M, Baas PW (2000) Motor proteins regulate force interactions between microtubules and microfilaments in the axon. Nat Cell Biol 2:276–280. 10.1038/35010544 - DOI - PubMed
    1. Arai Y, Taverna E (2017) Neural progenitor cell polarity and cortical development. Front Cell Neurosci 11:384. 10.3389/fncel.2017.00384 - DOI - PMC - PubMed
    1. Baas PW (1999) Microtubules and neuronal polarity: lessons from mitosis. Neuron 22:23–31. 10.1016/s0896-6273(00)80675-3 - DOI - PubMed
    1. Baas PW, Ahmad FJ (2001) Force generation by cytoskeletal motor proteins as a regulator of axonal elongation and retraction. Trends Cell Biol 11:244–249. 10.1016/s0962-8924(01)02005-0 - DOI - PubMed
    1. Baas PW, Vidya Nadar C, Myers KA (2006) Axonal transport of microtubules: the long and short of it. Traffic 7:490–498. 10.1111/j.1600-0854.2006.00392.x - DOI - PubMed

Publication types

LinkOut - more resources