. 2022 Jan 19;8(1):2.
doi: 10.1038/s41540-021-00211-8.

Diffusion kernel-based predictive modeling of KRAS dependency in KRAS wild type cancer cell lines

Affiliations

Diffusion kernel-based predictive modeling of KRAS dependency in KRAS wild type cancer cell lines

Bastian Ulmer et al. NPJ Syst Biol Appl. .

Abstract

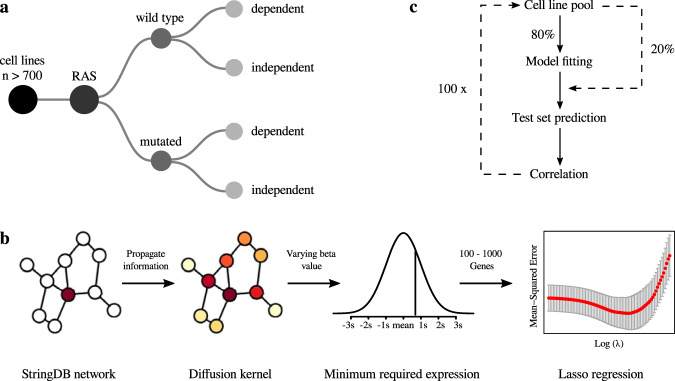
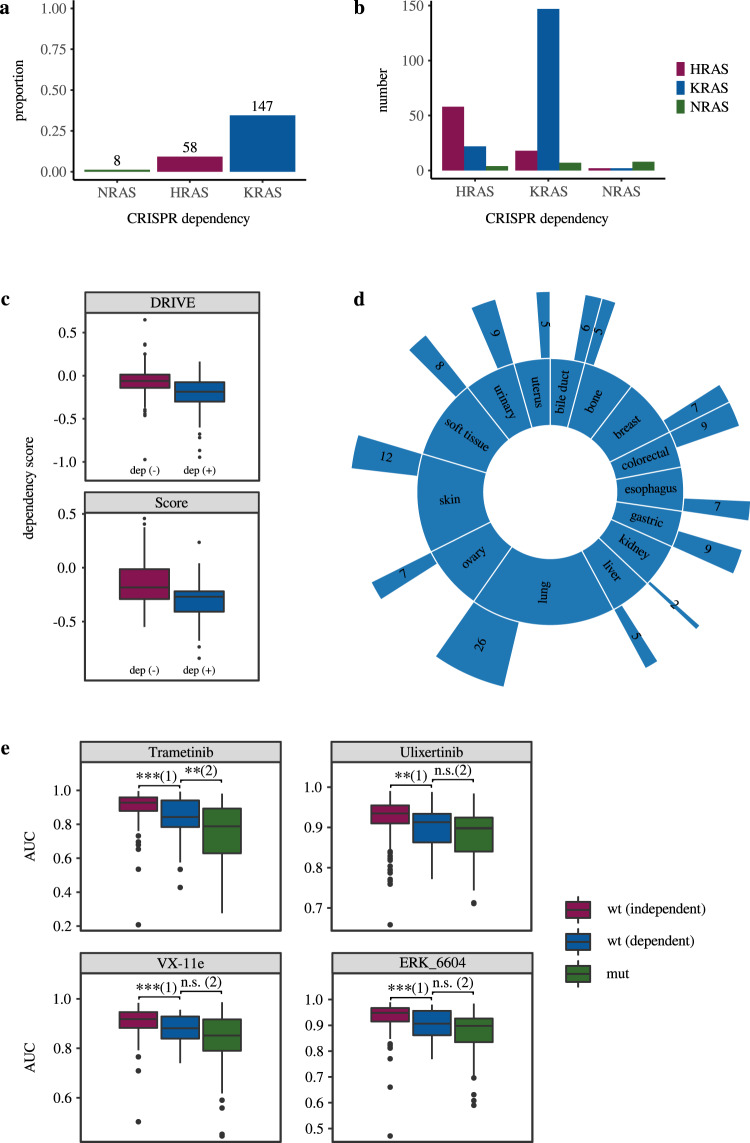
Recent progress in clinical development of KRAS inhibitors has raised interest in predicting the tumor dependency on frequently mutated RAS-pathway oncogenes. However, even without such activating mutations, RAS proteins represent core components in signal integration of several membrane-bound kinases. This raises the question of applications of specific inhibitors independent from the mutational status. Here, we examined CRISPR/RNAi data from over 700 cancer cell lines and identified a subset of cell lines without KRAS gain-of-function mutations (KRASwt) which are dependent on KRAS expression. Combining machine learning-based modeling and whole transcriptome data with prior variable selection through protein-protein interaction network analysis by a diffusion kernel successfully predicted KRAS dependency in the KRASwt subgroup and in all investigated cancer cell lines. In contrast, modeling by RAS activating events (RAE) or previously published RAS RNA-signatures did not provide reliable results, highlighting the heterogeneous distribution of RAE in KRASwt cell lines and the importance of methodological references for expression signature modeling. Furthermore, we show that predictors of KRASwt models contain non-substitutable information signals, indicating a KRAS dependency phenotype in the KRASwt subgroup. Our data suggest that KRAS dependent cancers harboring KRAS wild type status could be targeted by directed therapeutic approaches. RNA-based machine learning models could help in identifying responsive and non-responsive tumors.


Conflict of interest statement

The authors declare no competing interests.

Figures

Fig. 1
Fig. 1. Cancer cell line classification algorithm and gene dependency modeling strategies.
a Strategy of cell line subgrouping leading to the investigated subgroups (HRASwt/HRASmut, KRASwt/KRASmut, NRASwt/NRASmut). b Variable selection workflow for whole transcriptome RNA-expression data consisting of the construction of a literature-based gene network followed by further selections steps with centrality quantification through a diffusion kernel and a minimum required expression level. Several different constellations of the hyperparameters were tested. Final modeling was performed using a Lasso, Elastic Net or Random Forest regression. c Workflow of iterative model fitting and performance evaluation for each gene dependency dataset.
Fig. 2
Fig. 2. RAS dependency characterization and associations to MEK inhibitor responsivity.
a Proportion of gene-dependent cell lines in the four subgroups of wild type cancer cell lines. The numbers above the columns indicate the absolute number of dependent cell lines. b Total number of co-dependencies for each gene. c Validation of the elaborated KRAS dependent and independent subgroups. After dividing the cell lines into KRAS dependent and independent using the Achilles Project CRISPR data, we verified the existence of the two subgroups in data of the DRIVE (RNAi) and the Score Project (CRISPR). Cell lines classified as KRAS dependent in the Achilles data exhibited a significantly higher dependency in both screens (Wilcox Test; DRIVE: p = 4,6 * 10−10, n = 342; Score: p = 2.1 * 10−4, n = 124). d Proportions of the different entities in the KRASwt group (inner circle) and the proportion of KRAS-dependent cell lines in each entity with indicated absolute numbers (outer circle). Only entities with at least ten cell lines were included in the figure. In absolute numbers, lung tumors were the most represented entity among KRAS dependent cell lines, followed by skin tumors. Overall, the group is very heterogeneous without one entity clearly dominating. e Characterization of MEK-inhibitors sensitivity in KRASwt cancer cell lines with dependent (blue, wt (dependent)) independent (purple, wt (independent)) status and as a reference KRASmut cases (green, mut). The symbols above the brackets refer to the following significance codes: *** < 0.001; ** < 0.01; * < 0.05]; ‘n.s.’ > 0.05. In the overall comparison between the three groups, KRASwt cell lines with KRAS dependency are significantly more responsive to MEK inhibitors (lower AUC) than KRASwt independent group, but for some inhibitors less responsive than the KRASmut cell lines (Wilcox Test: Trametinib: (1) p = 4.6 * 10−4 (n = 183), (2) p = 7.4 * 10−3 (n = 113); Ulixertinib: (1) p = 4.1 * 10−3 (n = 183), (2) p = 9.5 * 10−2 (n = 112); VX-11e: (1) p = 4.9 * 10−4 (n = 178), (2) p = 9.7 * 10−2 (n = 111); ERK_6604: (1) p = 1.8 * 10−4 (n = 179), (2) p = 1.3 * 10−1 (n = 111)). For further compounds of CCLE, GDSC1, and GDSC2 see also Supplementary Fig. 1. Box plot annotation (c, e): 25th percentile (box bottom), 75th percentile (box top), median (box center), whiskers top/bottom ±1.5 × interquartile range, outliers are shown as dots.
Fig. 3
Fig. 3. Transcriptional characterization and dependency analysis of KRAS dependent KRASwt cell lines.
a Differentially expressed genes in KRASwt dependent vs independent cell lines (n = 567). Positive values on the x-axis reflect higher expression in the dependent subgroup, correspondingly negative values reflect higher expression in the independent subgroup. b Overrepresentation analysis (Reactome) of genome wide CRISPR screen genes exhibiting a higher dependency in the KRASwt dependent subgroup (Wilcoxon–Mann–Whitney Test; ngenes = 1038). c Percentage of cell lines harboring at least one RAE (blue) or no RAE (purple) in KRASwt subgroup for KRAS dependent (left) and independent (right) cell lines. Absolute values are shown above each column. d, e Binary co-dependency network of RAE in KRASwt highlighting the heterogeneous distribution of RAE (Dependent cell lines (d), independent (e)). Number of co-dependencies shared between two genes is shown if there were more than two co-dependencies. Node size refers to the number of cell lines classified as dependent on the respective gene. Cell lines without RAE were not included in the figures.
Fig. 4
Fig. 4. Performance of different KRAS dependency modeling strategies and predictor analysis in KRASwt cell lines.
a Correlation analysis (Pearson’s r) in independent test sets between the experimentally determined KRAS cancer cell line dependency and our machine learning-based predictions for varying sets of predictors (see methods). Results are shown for models using all available predictors of the RNA sequencing data (total), all available predictors of the protein interaction network (net) and predictors selected by the diffusion kernel with hyperparameter optimization (kernel). Models were based on KRASwt cell lines of the different datasets (crispr - Achilles CRISPR effect data (n = 567), rnai - DRIVE RNAi (DEMETER2) data (n = 487)). In case of the diffusion kernel variable selection workflow maximum correlation was reached with a hyperparameter constellation using 500 predictors. For complete results of hyperparameter tuning see Supplementary Data 4. b Performance (Pearson’s r) of KRAS dependency models in KRASwt group compared between the different approaches (RAE – RAE-based models (CRISPR data), Loboda – Models using RNA expression of the gene selection by Loboda et al. (CRISPR data), Singh – Models using RNA expression of the gene selection genes by Singh et al. (CRISPR data), CRISPR – Best performing models using RNA expression of the gene selection by the diffusion kernel with optimized hyperparameters (CRISPR data), RNAi – Best performing models using RNA expression of the gene selection by the diffusion kernel with optimized hyperparameters (RNAi data)). For CRISPR/RNAi correlation analysis was performed similarly to (a). Correlation coefficients for RAE, Loboda and Singh were determined as described above. c Absolute error of CRISPR/RNAi models for each cell line using mutation- and best performing RNA-predictor set. Summarized results of 400 unique models are shown in the two waterfall plots. Cell lines were ordered by ascending observed KRAS dependency from left to right. The absolute error was estimated by summing the individual absolute differences of the predicted values from the observed values. d Correlation analysis (Pearson’s r, nCRISPR = 567, nRNAi = 487) performed similarly to (a) this time comparing models using different algorithms (Elastic Net regression - enet, Random Forest regression – forest, Lasso regression - lasso). Neither Elastic net nor Random Forest Regression could improve the Lasso predictions of KRAS dependency. e Occurrence frequency of RNA-predictors in 12000 unique models of KRAS dependency (CRISPR/RNAi) in KRASwt cancer cell lines. Only models using the variable selection by the diffusion kernel were included. Negative values indicate the frequency of how often the predictor had a negative coefficient in the models (associated with higher KRAS dependency), positive values the frequency of how often the predictor had a positive coefficient (associated with lower KRAS dependency). The 25 most redundant genes are shown here.
Fig. 5
Fig. 5. Performance of mutation status-/RNA expression-based KRAS dependency models and analysis of error distributions in the complete cell line dataset.
a Correlation analysis (Pearson’s r) in independent test sets between the experimentally determined KRAS cancer cell line dependency and our machine learning-based predictions for varying sets of predictors (see methods). Results are shown for models using all available predictors of the RNA sequencing data (total), all available predictors of the protein interaction network (net) and predictors selected by the diffusion kernel with hyperparameter optimization (kernel). For both dependency datasets models were based on the entire cell line set (crispr - Achilles CRISPR effect data (n = 698), rnai - DRIVE RNAi (DEMETER2) data (n = 601). In case of diffusion kernel variable selection workflow maximum correlation was reached with a hyperparameter constellation using 1000 predictors. For complete results of hyperparameter tuning see Supplementary Data 4. b Correlation analysis (Pearson’s r) performed similarly to (a) this time comparing models either using KRAS mutation status (mut) or best performing predictors of the RNA sequencing data (rna) in the respective datasets (crispr - Achilles CRISPR effect data (nrna = 698, nmut = 704), rnai - DRIVE RNAi (DEMETER2) data (nrna = 601, nmut = 613). Using RNA sequencing data as predictors, the best performance was achieved either with the complete protein interaction network (CRISPR) or a subset of the network consisting of 1000 genes selected by the diffusion kernel (RNAi). c Absolute error of CRISPR/RNAi models for each cell line using mutation- and best performing RNA-predictor set (CRISPR: complete protein interaction network; RNAi: diffusion kernel selection with 1000 genes). Summarized results of 400 unique models are shown in the two waterfall plots. Cell lines were ordered by ascending observed KRAS dependency from left to right. The absolute error was estimated by summing the individual absolute differences of the predicted values from the observed values (RNA expression-based (rna): purple bars; Mutation status-based (mut): blue bars). Predictions of models using mutation status show two local minima in the absolute error distributions indicating the binary prediction results. For both types of predictors residuals tend to increase at both sides of the distribution.

References

    1. Winters IP, et al. Multiplexed in vivo homology-directed repair and tumor barcoding enables parallel quantification of Kras variant oncogenicity. Nat. Commun. 2017;8:2053. - PMC - PubMed
    1. Kandoth C, et al. Mutational landscape and significance across 12 major cancer types. Nature. 2013;502:333–339. - PMC - PubMed
    1. Zehir A, et al. Mutational landscape of metastatic cancer revealed from prospective clinical sequencing of 10,000 patients. Nat. Med. 2017;23:703–713. - PMC - PubMed
    1. Prior IA, Hood FE, Hartley JL. The Frequency of Ras Mutations in Cancer. Cancer Res. 2020;80:2969–2974. - PMC - PubMed
    1. Santarpia L, Lippman SM, El-Naggar AK. Targeting the MAPK-RAS-RAF signaling pathway in cancer therapy. Expert Opin. Ther. Targets. 2012;16:103–119. - PMC - PubMed

Publication types