. 2022 Jan 19;13(1):393.
doi: 10.1038/s41467-022-27973-x.

Quantification of bone marrow interstitial pH and calcium concentration by intravital ratiometric imaging

Affiliations

Quantification of bone marrow interstitial pH and calcium concentration by intravital ratiometric imaging

S-C A Yeh et al. Nat Commun. .

Erratum in

Abstract

The fate of hematopoietic stem cells (HSCs) can be directed by microenvironmental factors including extracellular calcium ion concentration ([Ca2+]e), but the local [Ca2+]e around individual HSCs in vivo remains unknown. Here we develop intravital ratiometric analyses to quantify the absolute pH and [Ca2+]e in the mouse calvarial bone marrow, taking into account the pH sensitivity of the calcium probe and the wavelength-dependent optical loss through bone. Unexpectedly, the mean [Ca2+]e in the bone marrow (1.0 ± 0.54 mM) is not significantly different from the blood serum, but the HSCs are found in locations with elevated local [Ca2+]e (1.5 ± 0.57 mM). With aging, a significant increase in [Ca2+]e is found in M-type cavities that exclusively support clonal expansion of activated HSCs. This work thus establishes a tool to investigate [Ca2+]e and pH in the HSC niche with high spatial resolution and can be broadly applied to other tissue types.


Conflict of interest statement

The authors declare no competing interests.

Figures
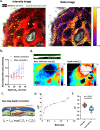
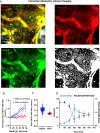
Fig. 1
Fig. 1. Ratiometric imaging of bone marrow pH in vivo.
a SNARF-1 fluorescence intensity and ratio images of a single optical section from a z-stack (shown in Supplementary. Video 1). The cell-impermeable SNARF-1 dextran labeled the vasculature and the interstitial space. The BM cells thus appeared as dark objects. b The mean of SNARF-1 (R/G) ratios obtained from vessels located at various distances to endosteum (depths). Without correction, the R/G ratio increased with increasing image depth. After correction for the wavelength-dependent light attenuation, the intravascular R/G ratio became independent of depth (n = 6 BM cavities, mean ± s.d.). c Schematic illustration of the two-step depth correction. Fluorescence signals originated in the BM travel through BM and bone with distinct attenuation coefficients (C1,2) before being collected by the objective lens. d Bone thickness shows varying thickness across the field of view. The corresponding depth map shows varying distances to endosteum from a single z plane. The cross-section view corresponds to an x–z section from the green dashed line. e A pH calibration curve obtained in vitro to convert measured ratios to absolute pH (N = 3 independent experiments). f Ratiometric quantification of intravascular and interstitial pH after the two-step depth correction. Interstitial pH was found to be significantly lower than intravascular pH (p < 0.0001), with 10–90% data points distributed between 7.0 and 7.3. Each data point represents a subregion from a BM cavity (n = 10 BM cavities, N = 2 mice). two-sided Mann–Whitney test. Box and whiskers represent the median, 25 and 75 percentiles, and the 10–90% data range. Source data are provided as a Source Data file.
Fig. 2
Fig. 2. Ratiometric calcium imaging of bone marrow.
a Intravital two-photon fluorescence imaging of BM cavities labeled with Rhod-5N (red) and AF488 (green). The SHG signal from bone is shown in gray. The mask for interstitium and vessels were generated from Rhod-5N images to delineate the vasculature and the interstitial space while excluding areas with low fluorescence signals (i.e., intracellular space that is not labeled by the cell-impermeable dye). Autofluorescent cells are also excluded. V vessels, IS interstitium, O Osteoids. b The mean of Rhod-5N/AF488 ratios obtained from vessels located at various distances to endosteum (depths), showing a consistent increase in the Rhod5-N/AF488 ratios with increasing image depth. Correction for depth attenuation of Rhod-5N and AF488 signals independently yielded intravascular ratios independent of depth (n = 6 BM cavities). c Ratiometric analyses without the two-step depth correction yielded divergent intravascular Rhod-5N/AF488 ratios, while depth corrections minimized variation of intravascular ratios. d Real-time response of the Rhod-5N/AF488 ratio (black circles) during the injection of a calcium chelator, Calcein Blue (blue squares). Each data point represents the mean of 5 subregions from the blood vessels. Mean ± s.d. (s.d. were calculated from all the pixels within the ROI). Source data are provided as a Source Data file.
Fig. 3
Fig. 3. Quantification of intravascular and interstitial calcium concentration in the bone marrow.
a Merged Rhod-5N, AF488 and SHG signals and ratiometric imaging in the BM, demonstrated by a single image plane from a z-stack. Rhod-5N and AF488 as cell-impermeable dyes labeled vasculature and were sequestered in the interstitial space. The BM cells thus appeared as dark objects. b Calcium concentration calibration curves at pH = 7.0 and pH = 7.4 were obtained in vitro to convert the measured ratios to absolute calcium concentration (N = 3 independent experiments). The dashed black line is a fitting curve for the two data sets together. c Quantifications of intravascular and interstitial Rhod-5N/AF488 ratios in vivo as well as serum Rhod-5N/AF488 ratios measured in vitro (n = 25 BM cavities, N = 10 mice, N = 8 in vitro samples). d Corresponding [Ca2+] converted from Rhod-5N/AF488 rations in c using the calcium calibration curve (p = 0.001 between vessels and interstitium). e [Ca2+]e near arterioles/sinusoids (n = 8 BM cavities) and near endosteum (n = 25 BM cavities). c–e Two-sided Mann–Whitney test. Each data point represents a subregion from a BM cavity. Box and whiskers represent the median, 25 and 75 percentiles, and the 10–90% data range. Source data are provided as a Source Data file.
Fig. 4
Fig. 4. Quantitative calcium measurements in different cavity types and HSC microenvironment.
a Ratiometric imaging of Rhod-5N/AF488 from BM cavities dominated by bone deposition (D-type), resorption (R-type), or mixed activities (M-type). Bone remodeling is defined by the double bone front staining strategy based on the Dye 1/Dye 2 ratio, where Dye 1 labels the old bone fronts that has been eroded to various extents. The cross-section view of bone remodeling from a BM cavity is obtained from the x–z or y–z sections of the blue dashed zone, displayed by maximum intensity projection. b, c Quantifications of intravascular and interstitial Rhod-5N/AF488 ratios in D-, M-, R-type cavities and near LT-HSCs, together with the corresponding calcium concentrations converted from ratiometric analyses (n = 25 BM cavities, N = 10 mice, n = 15 LT-HSCs, n = 30 HSPCs). Significant difference in [Ca2+]e was found between M-type vs. D-type cavities (p < 0.0001), HSCs (p = 0.0004), and HSPCs (p < 0.0001); between D-type cavities vs. HSCs and HSPCs (p < 0.0001). d Calcium distribution in the M-type cavities from young (mean = 1.0 mM) and aged (mean = 1.3 mM) animals (N = 4 mice, n = 10 M-type cavities, p < 0.0001). Each data point represents a subregion from a BM cavity. bd Two-sided Mann–Whitney test. Box and whiskers represent the median, 25 and 75 percentiles, and the 10–90% data range. e A representative image of Rhod-5N/AF488 labeled BM in MDS1GFP/+;FLT3Cre mice used to measure interstitial calcium adjacent to GFP+ LT-HSCs. Source data are provided as a Source Data file.

References

    1. Adams GB, et al. Stem cell engraftment at the endosteal niche is specified by the calcium-sensing receptor. Nature. 2006;439:599–603. - PubMed
    1. Peacock M. Calcium metabolism in health and disease. Clin. J. Am. Soc. Nephrol. 2010;5:23–30. - PubMed
    1. Luchsinger LL, et al. Harnessing hematopoietic stem cell low intracellular calcium improves their maintenance in vitro. Cell Stem Cell. 2019;25:225–240. - PMC - PubMed
    1. Tordoff MG, Bachmanov AA, Reed DR. Forty mouse strain survey of voluntary calcium intake, blood calcium, and bone mineral content. Physiol. Behav. 2007;91:632–643. - PMC - PubMed
    1. Jafri L, Habib A, Saba K. Ionized calcium measurement in serum and plasma by ion selective electrodes: comparison of measured and calculated parameters. Ind. J. Clin. Biochem. 2014;29:327–332. - PMC - PubMed

Publication types