

Surface temperature controls the pattern of post-earthquake landslide activity
- PMID: 35046453
- PMCID: PMC8770705
- DOI: 10.1038/s41598-022-04992-8
Surface temperature controls the pattern of post-earthquake landslide activity
Abstract
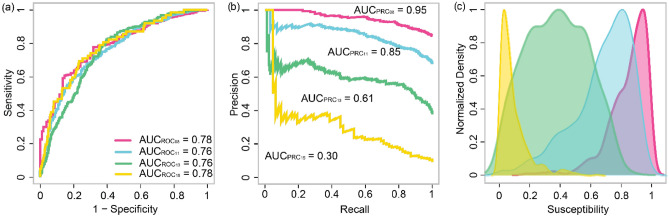
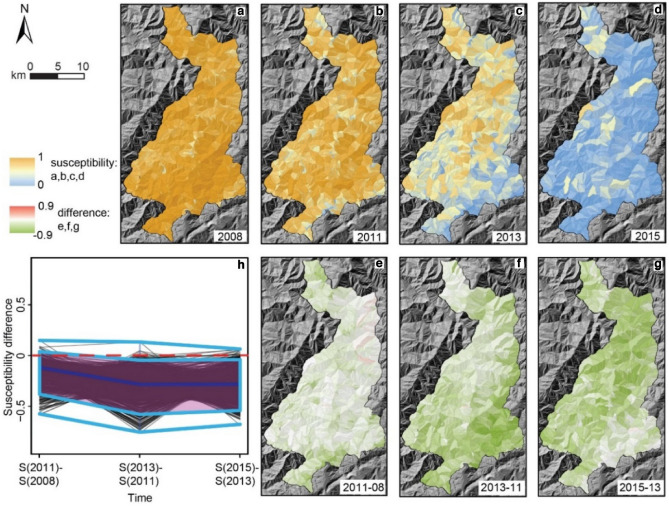
The patterns and controls of the transient enhanced landsliding that follows strong earthquakes remain elusive. Geostatistical models can provide clues on the underlying processes by identifying relationships with a number of physical variables. These models do not typically consider thermal information, even though temperature is known to affect the hydro-mechanical behavior of geomaterials, which, in turn, controls slope stability. Here, we develop a slope unit-based multitemporal susceptibility model for the epicentral region of the 2008 Wenchuan earthquake to explore how land surface temperature (LST) relates to landslide patterns over time. We find that LST can explain post-earthquake landsliding while it has no visible effect on the coseismic scene, which is dominated by the strong shaking. Specifically, as the landscape progressively recovers and landslide rates decay to pre-earthquake levels, a positive relationship between LST and landslide persistence emerges. This seems consistent with the action of healing processes, capable of restoring the thermal sensitivity of the slope material after the seismic disturbance. Although analyses in other contexts (not necessarily seismic) are warranted, we advocate for the inclusion of thermal information in geostatistical modeling as it can help form a more physically consistent picture of slope stability controls.
© 2022. The Author(s).
Conflict of interest statement
The authors declare no competing interests.
Figures


References
-
- Fan X, et al. Earthquake-induced chains of geologic hazards: Patterns, mechanisms, and impacts. Rev. Geophys. 2019;57:421–503.
-
- Keefer, D. K. The importance of earthquake-induced landslides to long-term slope erosion and slope-failure hazards in seismically active regions. In Geomorphology and Natural Hazards 265–284 (Elsevier, 1994). 10.1016/B978-0-444-82012-9.50022-0.
-
- Hovius N, et al. Prolonged seismically induced erosion and the mass balance of a large earthquake. Earth Planet. Sci. Lett. 2011;304:347–355.
-
- Francis OR, et al. The impact of earthquakes on orogen-scale exhumation. Earth Surf. Dyn. 2020;8:579–593.
-
- Fan X, et al. Spatio-temporal evolution of mass wasting after the 2008 Mw 7.9 Wenchuan earthquake revealed by a detailed multi-temporal inventory. Landslides. 2018;15:23–41.
Grants and funding
LinkOut - more resources
Full Text Sources
