. 2022 Jan 19;12(1):964.
doi: 10.1038/s41598-022-05130-0.

Changes in land use enhance the sensitivity of tropical ecosystems to fire-climate extremes

Affiliations

Changes in land use enhance the sensitivity of tropical ecosystems to fire-climate extremes

Sujay Kumar et al. Sci Rep. .

Abstract

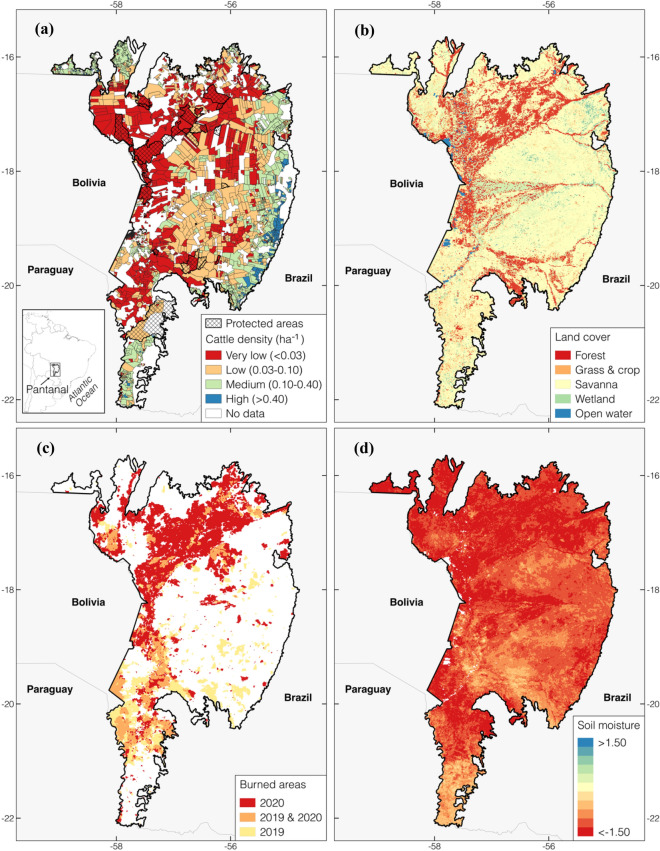
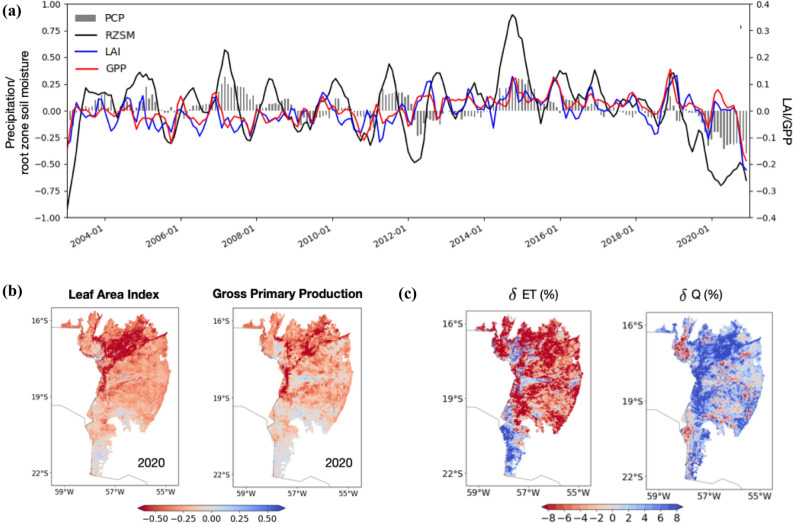
The Pantanal, the largest contiguous wetland in the world with a high diversity of ecosystems and habitat for several endangered species, was impacted by record-breaking wildfires in 2020. In this study, we integrate satellite and modeling data that enable exploration of natural and human contributing factors to the unprecedented 2020 fires. We demonstrate that the fires were fueled by an exceptional multi-year drought, but dry conditions solely could not explain the spatial patterns of burning. Our analysis reveals how human-caused fires exacerbated drought effects on natural ecosystem within the Pantanal, with large burned fractions primarily over natural (52%), and low cattle density areas (44%) in 2020. The post-fire ecosystem and hydrology changes also had strong ecological effects, with vegetation productivity less than - 1.5 σ over more than 30% of the natural and conservation areas. In contrast to more managed areas, there was a clear decrease in evaporation (by ~ 9%) and an increase in runoff (by ~ 5%) over the natural areas, with long-term impacts on ecosystem recovery and fire risk. This study provides the first tropical evidence outside rainforests of the synergy between climate, land management and fires, and the associated impacts on the ecosystem and hydrology over the largest contiguous wetlands in the world.


Conflict of interest statement

The authors declare no competing interests.

Figures

Figure 1
Figure 1
Map of the study domain over the Pantanal: (a) shows four categories of pasture based on cattle head density per cattle ranch (estimated from the Mapbiomas project), with the conservation areas (shown in the hatched patterns) with the indigenous and environmental reserves (http://www.funai.gov.br/index.php/shape; https://antigo.mma.gov.br/areas-protegidas/cadastro-nacional-de-ucs/dados-georreferenciados.html), (b) shows the four dominant land cover types from the MODIS land cover data, (c) shows the locations of the burned areas in 2019 and 2020, based on the MCD64A1 burned area product, and (d) shows a map of the standardized 6-month root zone soil moisture anomaly averaged across the Aug-Nov of 2020. The spatial maps are created using QGIS (https://qgis.org/en/site/).
Figure 2
Figure 2
Time series of the standardized anomalies of antecedent 6-month root zone soil moisture (black lines) and fraction of burned areas per month (red bars) over areas with different pasture density (panels a, b, c, d). The dashed blue and gray lines show the linear trend of the monthly fraction of burned area (Table 1) over the 2003–2020 and 2003–2019 time periods, respectively. Panel e shows the distribution of annual fraction of burned area across 2003–2019 and from 2020 and Panel f shows the Spearman correlation between the standardized anomalies in variables relevant for fuel moisture (i.e., 12-month precipitation, 6-month root zone soil moisture) and percent of burn area, stratified for areas with four different levels of pasture density.
Figure 3
Figure 3
Time series (Panel a) of domain averaged standardized anomalies of 12-month precipitation, 6-month root zone soil moisture (RZSM), 2-month Leaf Area Index (LAI), and 2-month Gross Primary Production (GPP). The bottom panel b shows the ecosystem impacts of the 2020 fire events, with spatial maps of standardized anomalies in 2-month LAI, and 2-month GPP, averaged during Sep-Nov for 2020. Panel c shows impacts of fires on the local hydrology over the Pantanal. The percentage change in evapotranspiration (ET) and runoff (Q) during the post-fire time period, relative to a scenario where climatological average vegetation conditions are present. The spatial maps in Panels b and c are created using matplotlib (https://matplotlib.org/).

References

    1. Hardesty J, Myers R, Fulks W. Fire, ecosystems, and people: a preliminary assessment of fire as a global conservation issue. George Wright Forum. 2005;22:78–87.
    1. Bodí MB, et al. Wildland fire ash: production, composition and eco-hydro-geomorphic effects. Earth-Sci. Rev. 2014;130:103–127. doi: 10.1016/j.earscirev.2013.12.007. - DOI
    1. Knicker H. How does fire affect the nature and stability of soil organic nitrogen and carbon? a review. Biogeochemistry. 2007;85:91–118. doi: 10.1007/s10533-007-9104-4. - DOI
    1. Bowman DMJS, et al. The human dimension of fire regimes on Earth. J. Biogeogr. 2011;38:2223–2236. doi: 10.1111/j.1365-2699.2011.02595.x. - DOI - PMC - PubMed
    1. Archibald S. Managing the human component of fire regimes: lessons from Africa. Philos. Trans. R. Soc. B Biol. Sci. 2016;371:20150346. doi: 10.1098/rstb.2015.0346. - DOI - PMC - PubMed

Publication types