. 2022 Mar;27(3):1792-1804.
doi: 10.1038/s41380-021-01421-6. Epub 2022 Jan 19.

Functional brain rewiring and altered cortical stability in ulcerative colitis

Affiliations

Functional brain rewiring and altered cortical stability in ulcerative colitis

Hao Wang et al. Mol Psychiatry. 2022 Mar.

Abstract

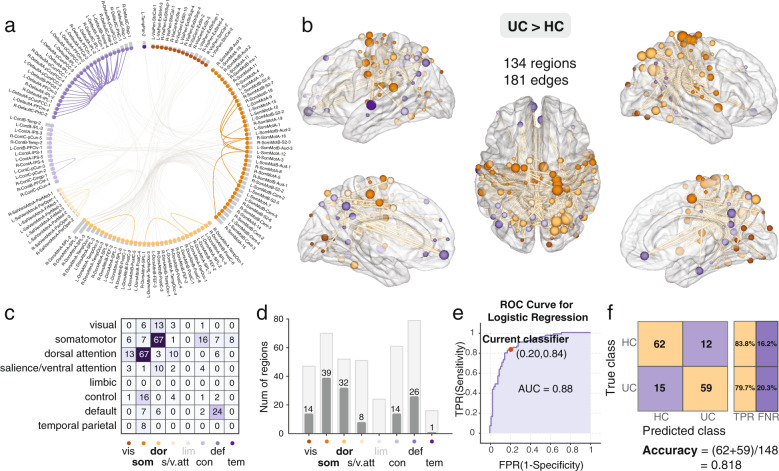
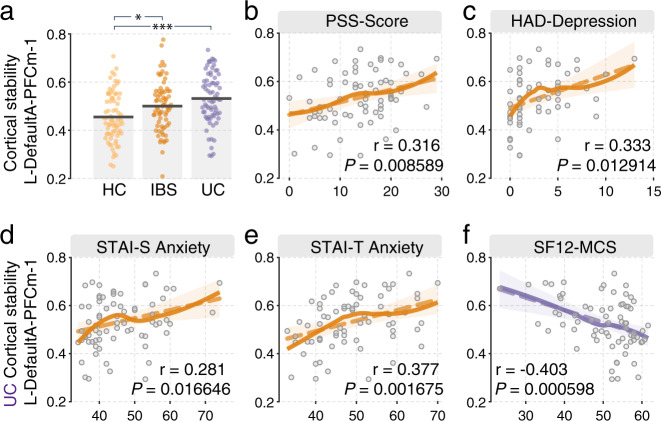
Despite recent advances, there is still a major need to better understand the interactions between brain function and chronic gut inflammation and its clinical implications. Alterations in executive function have previously been identified in several chronic inflammatory conditions, including inflammatory bowel diseases. Inflammation-associated brain alterations can be captured by connectome analysis. Here, we used the resting-state fMRI data from 222 participants comprising three groups (ulcerative colitis (UC), irritable bowel syndrome (IBS), and healthy controls (HC), N = 74 each) to investigate the alterations in functional brain wiring and cortical stability in UC compared to the two control groups and identify possible correlations of these alterations with clinical parameters. Globally, UC participants showed increased functional connectivity and decreased modularity compared to IBS and HC groups. Regionally, UC showed decreased eigenvector centrality in the executive control network (UC < IBS < HC) and increased eigenvector centrality in the visual network (UC > IBS > HC). UC also showed increased connectivity in dorsal attention, somatomotor network, and visual networks, and these enhanced subnetwork connectivities were able to distinguish UC participants from HCs and IBS with high accuracy. Dynamic functional connectome analysis revealed that UC showed enhanced cortical stability in the medial prefrontal cortex (mPFC), which correlated with severe depression and anxiety-related measures. None of the observed brain changes were correlated with disease duration. Together, these findings are consistent with compromised functioning of networks involved in executive function and sensory integration in UC.


Conflict of interest statement

EAM is a scientific advisory board member of Danone, Axial Biotherapeutics, Viome, Amare, Mahana Therapeutics, Pendulum, Bloom Biosciences, APC Microbiome Ireland. CNB is on the advisory boards for Abbvie Canada, Amgen Canada, Bristol Myers Squibb Canada, Janssen Canada, Roche Canada, Sandoz Canada, Takeda Canada, and Pfizer Canada. CNB is also a consultant for Mylan Pharmaceuticals. CNB has received educational grants from Abbvie Canada, Janssen Canada, Takeda Canada, and Pfizer Canada. CNB has received research funding from Abbvie Canada. CNB is on the speaker’s bureau for Abbvie Canada, Janssen Canada, Takeda Canada, and Medtronic Canada. No other authors have anything to disclose.

Figures

Fig. 1
Fig. 1. Workflow and overview of analysis in current study.
Graph theory was applied to construct and compare functional brain networks. a Three age- and sex-matched groups (74 HC, 74 IBS, and 74 UC). b Demographic, clinical, and psychosocial assessments were obtained, and statistical analysis was applied to detect the differences among three groups in the measures. c Static functional brain network was constructed for each participant, and analysis of covariance (ANCOVA) was applied to examine group differences in the global and regional network topology. Correlation analysis to link the abnormal topological features with each other and clinical scores in UC. The network-based statistic was applied to identify subnetworks within the larger network that show group differences. d Dynamic functional analysis was computed using the intraclass correlation coefficient using 120 sliding windows (sliding-window length of 62 repetition times (TR) and 2 TR steps) to assess group differences in cortical stability and investigate the correlation between altered cortical stability and clinical scores in UC.
Fig. 2
Fig. 2. Mean connected matrix, global metrics, and three-type connected distance.
a Mean connected matrix for HC, IBS, and UC group, separately. b Mean functional connectivity for each participant in each group, and the UC group exhibit higher mean FC compared with the HC and IBS group. c There is no significant difference among the three groups in global efficiency. d The UC groups exhibit decreased modularity compared with the HC and IBS groups. e Short-range distance (anatomical distance ≤ 45 mm), f Middle-range distance (45 mm < anatomical distance < 75 mm), and g Long-range distance (anatomical distance ≥ 75 mm) connections. We observed a lower proportion of short-distance and a higher proportion of middle-distance in UC, compared with the IBS group. ANCOVA and post-hoc tests were performed. *P < 0.05; **P < 0.01; ***P < 0.005. h The correlation between the proportion of short-range distance and the proportion of middle-range distance across all participants; i The correlation between the proportion of short-range distance and proportion of long-range distance across all participants; j The correlation between the proportion of middle-range distance and the proportion of long-range distance across all participants.
Fig. 3
Fig. 3. Significant difference in nodal eigenvector centrality among three groups.
The UC group shows decreased nodal centrality in the executive network (control and attention) and increased nodal centrality in the visual network. ANCOVA controlling for age and sex and post-hoc test was performed. The horizontal bars indicate mean values. *P < 0.05; **P < 0.01; ***P < 0.005. Cont Control network; VisPeri Visual peripheral; SalVentAttn Salience/ventral attention.
Fig. 4
Fig. 4. Significant decreased default mode subnetwork in UC group compared with HC group.
a The circular plot showing the connected brain regions by the network, different networks were colored by different colors and b Surface plot showing the spatial location of the brain regions in the decreased connected component revealed by NBS analysis. c Number of network-to-network connections of the decreased connected component, there are 10 edges (dorsal attention), 13 edges (salience/ventral attention), and 14 edges (control) with DMN regions. d Decreased connected component includes 15 DMN regions, six salience/ventral attention regions, five dorsal attention regions, and five control regions. Vis: visual; som: somatomotor; dor: dorsal attention; s/v.att: salience/ventral attention; lim: limbic; con: control; def: default; tem: temporal parietal. e The logistic regression reveals good discrimination in distinguishing the UC group from HC group using the decreased connected component, ROC curve (AUC = 0.83), TPR True-positive rate; FPR False-positive rate. f The confusion matrix and classification accuracy: 0.77, TPR True-positive rate; FNR False-negative rate. HC Healthy control; UC Ulcerative colitis.
Fig. 5
Fig. 5. Significant increased connected component in UC group compared with HC group.
a The circular plot showing the connected brain regions by the network, different networks were colored by different colors and b Surface plot of the increased connected component in UC compared to HC, revealed by NBS analysis. c Number of network-to-network connections of the increased connected component, there are 67 edges between the somatomotor and dorsal attention regions, there are 24 edges within the DMN regions. d Increased connected component mainly includes 39 somatomotor regions and 32 dorsal attention regions. Vis: visual; som: somatomotor; dor: dorsal attention; s/v.att: salience/ventral attention; lim: limbic; con: control; def: default; tem: temporal parietal. e The logistic regression reveals good performance in distinguishing the UC group from the HC group using the increased connected component, ROC curve (AUC = 0.88), TPR True-positive rate; FPR False-positive rate. f The confusion matrix and classification accuracy: 0.818, TPR True-positive rate; FNR False-negative rate. HC Healthy control; UC Ulcerative colitis.
Fig. 6
Fig. 6. Significant increased connected component in UC group compared with IBS group.
a The circular plot showing the connected brain regions by network, different networks were colored by different colors and b Surface plot of the increased connected component in UC compared to IBS, revealed by NBS analysis. c Number of network-to-network connections of the increased connected component, there are 24 edges between the dorsal attention regions and visual regions, there are 31 edges between the dorsal attention regions and somatomotor regions, and there are 16 edges between the somatomotor regions and the control regions. d Increased connected component mainly including 29 somatomotor, 29 dorsal attention, and 21 visual regions. Vis: visual; som: somatomotor; dor: dorsal attention; s/v.att: salience/ventral attention; lim: limbic; con: control; def: default; tem: temporal parietal. e The logistic regression reveals outstanding performance in distinguishing the UC group from IBS group using the increased connected component, ROC curve (AUC = 0.92), TPR True-positive rate; FPR False-positive rate. f The confusion matrix and classification accuracy: 0.858, TPR True-positive rate; FNR False-negative rate. IBS Irritable bowel syndrome; UC Ulcerative colitis.
Fig. 7
Fig. 7. Significant altered cortical stability and correlation with clinical scores.
a The UC group shows increased cortical stability in left DefaultA-PFCm-1 (mPFC) compared to HC and IBS group. b These changes in UC are correlated with PSS-Score (r = 0.316), c with HAD-Depression (r = 0.333), d with SATI-S Anxiety (r = 0.281), e with SATI-T Anxiety (r = 0.377), f with SF12-MCS (r = −0.403). Dashed lines are linear fits, solid lines are local polynomial regression fits (LOESS fits), yellow color indicates positive correlation; purple color indicates negative correlation. PSS Perceived Stress Scale; HAD Hospital Anxiety and Depression Scale; STAI State-Trait Anxiety Inventory; SF12 12-item Short-Form Health Survey; *P < 0.05; **P < 0.01; ***P < 0.005.

References

    1. Sairenji T, Collins KL, Evans DV. An update on inflammatory bowel disease. Prim Care. 2017;44:673–92. doi: 10.1016/j.pop.2017.07.010. - DOI - PubMed
    1. Fan W, Zhang S, Hu J, Liu B, Wen L, Gong M, et al. Aberrant brain function in active-stage ulcerative colitis patients: a resting-state functional mri study. Front Hum Neurosci. 2019;13:107. doi: 10.3389/fnhum.2019.00107. - DOI - PMC - PubMed
    1. Drossman DA, Hasler WL. Rome IV-functional GI disorders: disorders of gut-brain interaction. Gastroenterology. 2016;150:1257–61. doi: 10.1053/j.gastro.2016.03.035. - DOI - PubMed
    1. Mayer EA. Gut feelings: the emerging biology of gut-brain communication. Nat Rev Neurosci. 2011;12:453–66. doi: 10.1038/nrn3071. - DOI - PMC - PubMed
    1. Mayer EA, Labus JS, Tillisch K, Cole SW, Baldi P. Towards a systems view of IBS. Nat Rev Gastroenterol Hepatol. 2015;12:592–605. doi: 10.1038/nrgastro.2015.121. - DOI - PMC - PubMed

Publication types