. 2022 Feb;602(7895):112-116.
doi: 10.1038/s41586-021-04330-4. Epub 2022 Jan 19.

Androgens increase excitatory neurogenic potential in human brain organoids

Affiliations

Androgens increase excitatory neurogenic potential in human brain organoids

Iva Kelava et al. Nature. 2022 Feb.

Abstract

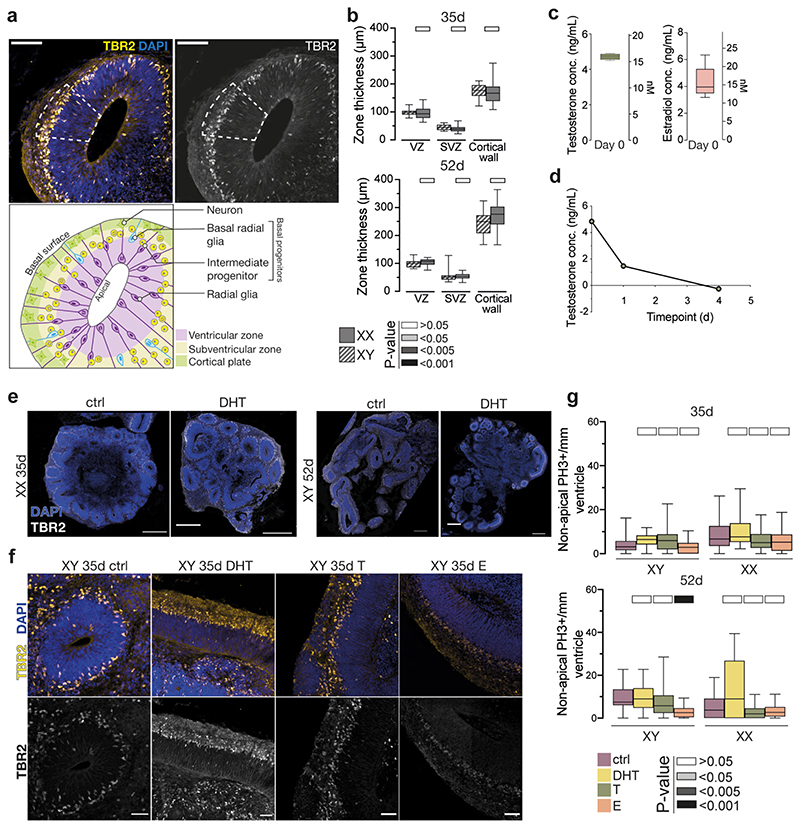
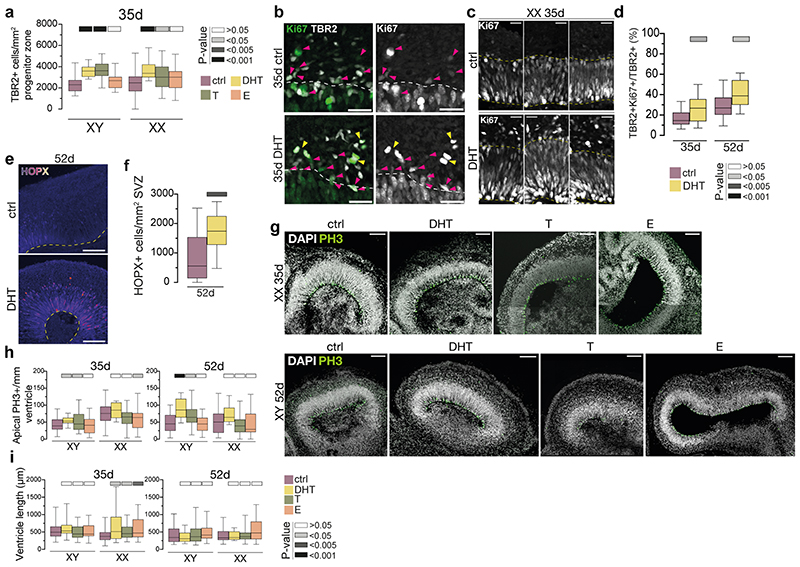
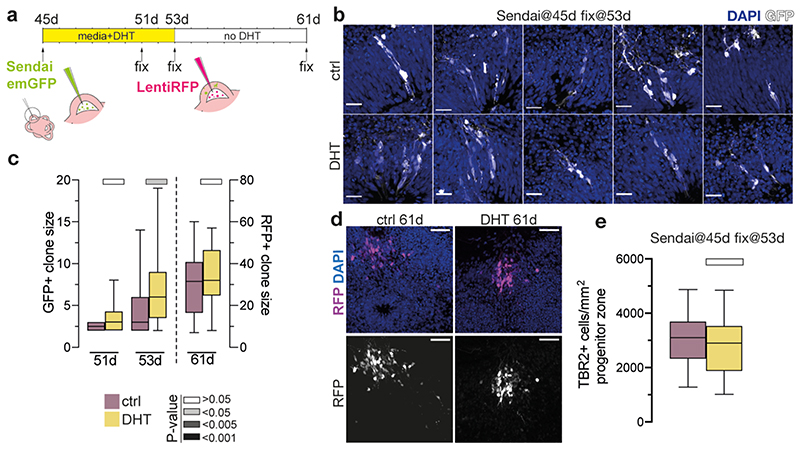
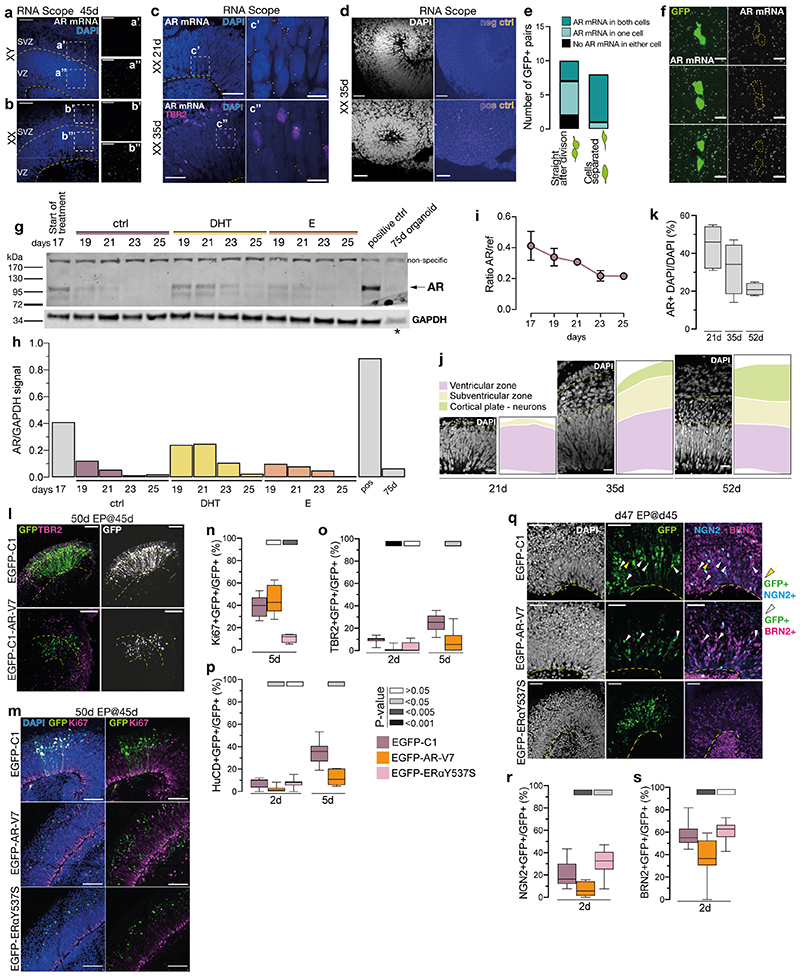
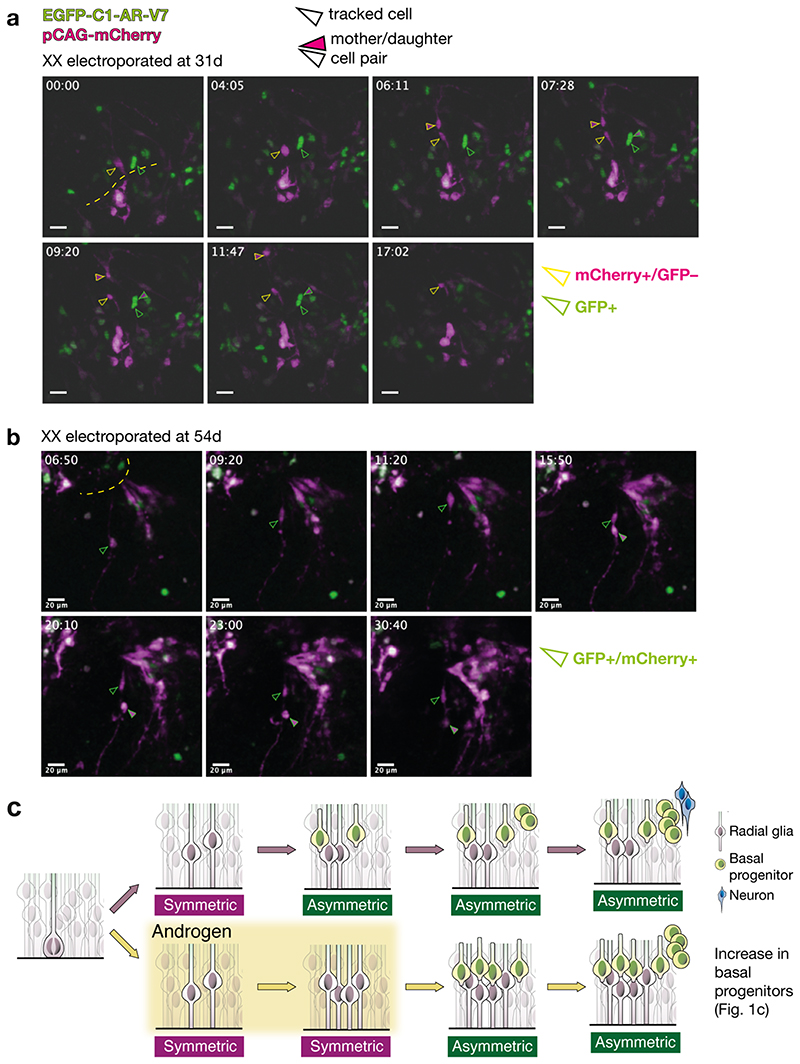
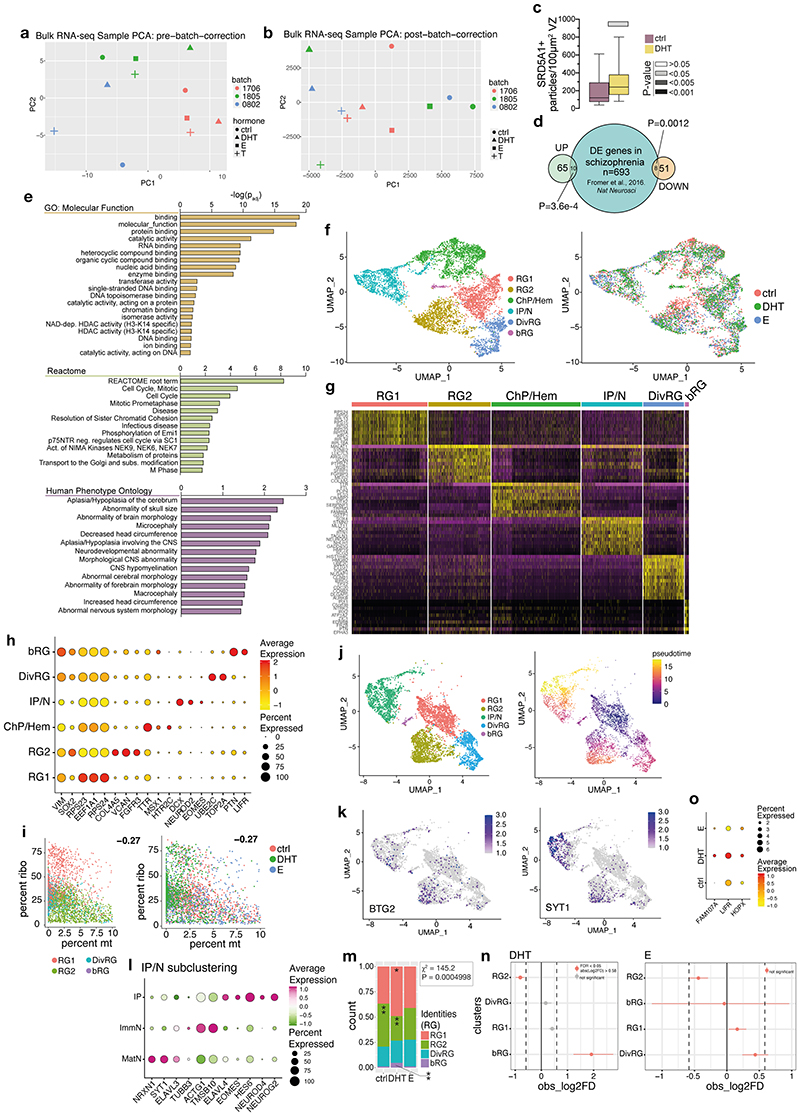
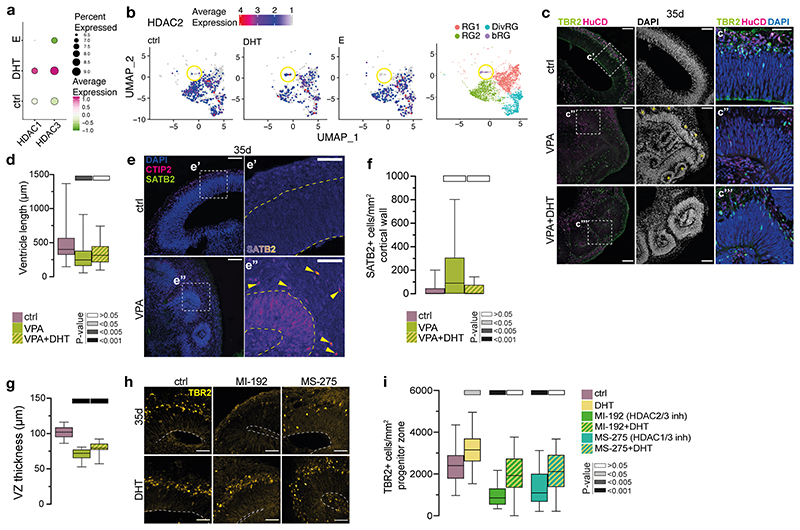
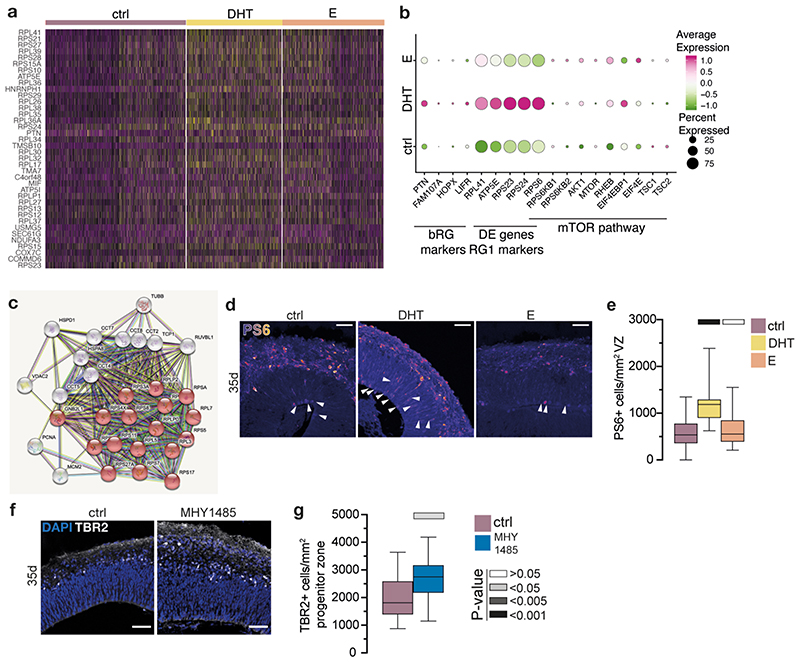
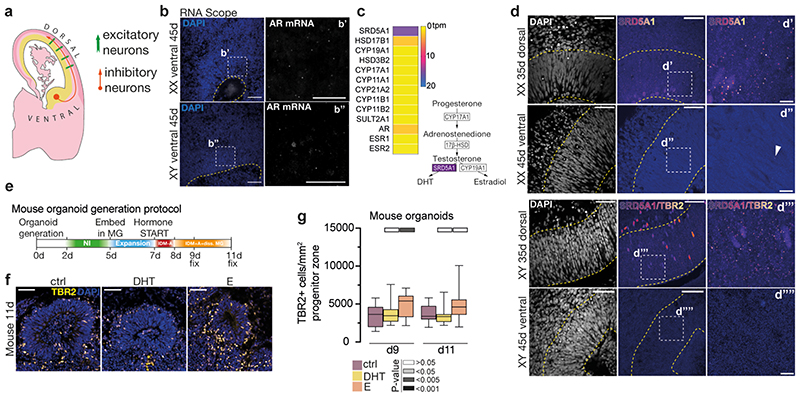
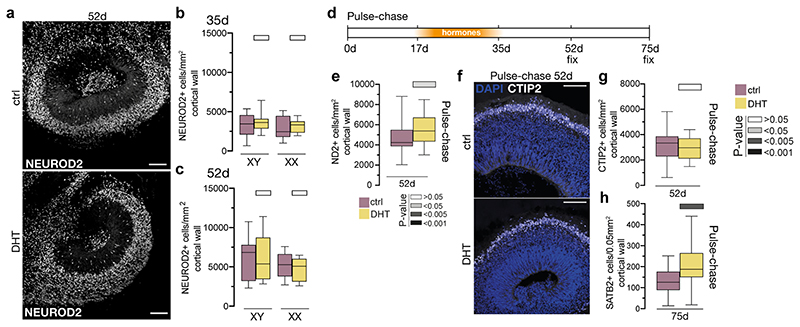
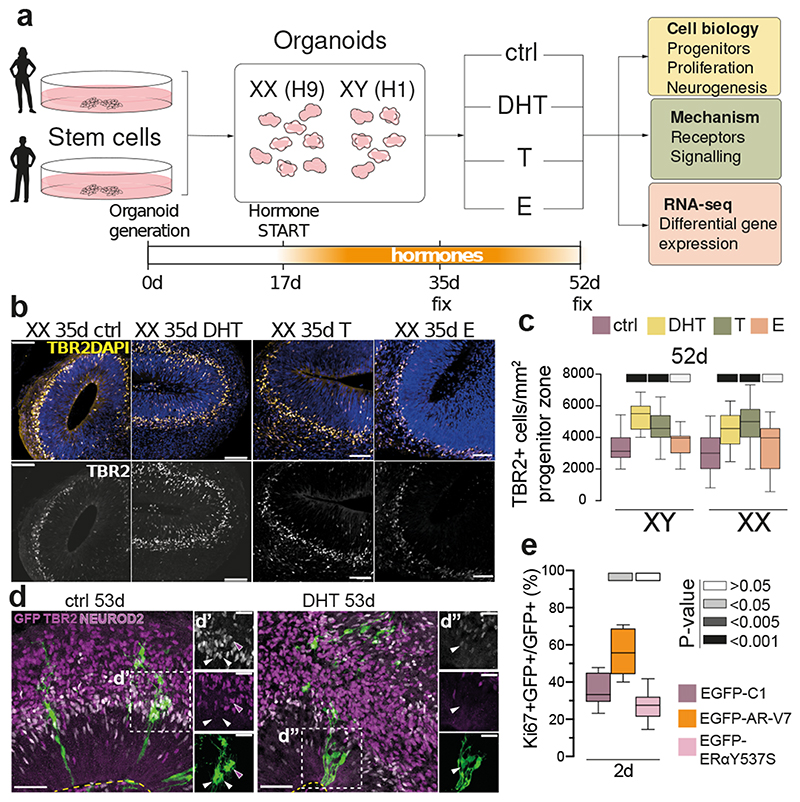
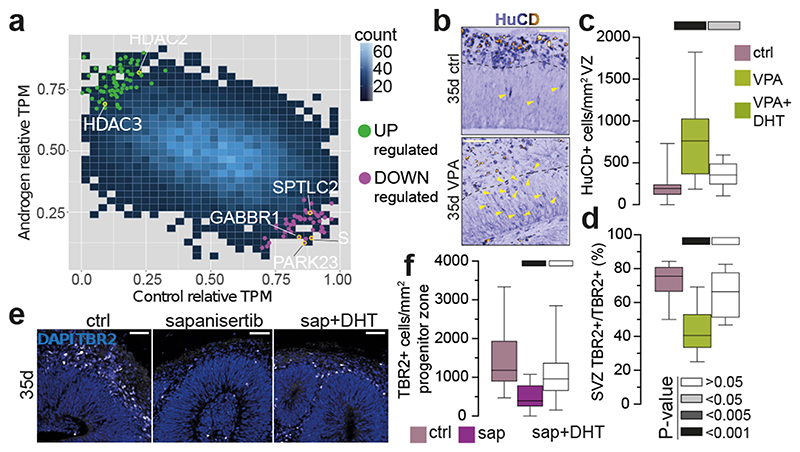
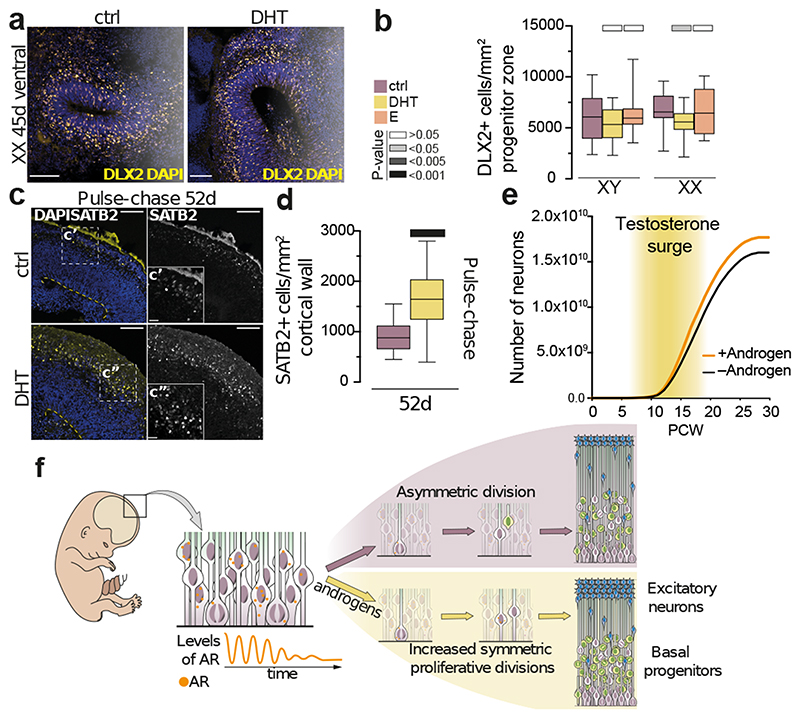
The biological basis of male-female brain differences has been difficult to elucidate in humans. The most notable morphological difference is size, with male individuals having on average a larger brain than female individuals1,2, but a mechanistic understanding of how this difference arises remains unknown. Here we use brain organoids3 to show that although sex chromosomal complement has no observable effect on neurogenesis, sex steroids-namely androgens-lead to increased proliferation of cortical progenitors and an increased neurogenic pool. Transcriptomic analysis and functional studies demonstrate downstream effects on histone deacetylase activity and the mTOR pathway. Finally, we show that androgens specifically increase the neurogenic output of excitatory neuronal progenitors, whereas inhibitory neuronal progenitors are not increased. These findings reveal a role for androgens in regulating the number of excitatory neurons and represent a step towards understanding the origin of sex-related brain differences in humans.


Conflict of interest statement

Conflict of interest

M.A.L. is an inventor on several patents related to cerebral organoids, is co-founder and scientific advisory board member of a:head bio, and scientific advisory board member of the Roche Institute for Translational Bioengineering.

Figures

Extended Data Figure 1
Extended Data Figure 1. Treatment and phenotypic characterization of cerebral organoids
a) Illustration of the determination of the progenitor zone for quantifications. The progenitor zone (VZ+SVZ) was determined based on immunostaining and histological landmarks (see Methods). Immunostaining of XX 35d organoids stained for TBR2 (yellow, white), co-stained with DAPI (blue). Dashed line indicates the progenitor zone. Schematic of an organoid ventricle with different progenitor populations of interest. b) Quantification of thicknesses of different morphological zones between male (XY) and female (XX) brain organoids at 35d (above) and 52d (below). Significance values (Mann-Whitney, two tailed) of the measurements from XX organoids, as compared to XY organoids, are indicated by different shades of grey. VZ-ventricular zone, SVZ-subventricular zone. c) Actual measured concentration of testosterone (left) and estradiol (right) in the media after the addition of 100nM (calculated) on day 0, as measured by ELISA assay. d) Actual measured concentration of testosterone over 4 days of organoid culture after addition of 100nM (calculated) on day 0, as measured by ELISA. e) Sections of whole XX organoids at 35d (left), and XY organoids at 52d (right), stained for TBR2 (white). Co-stained with DAPI (blue). f) XY 35d organoids stained for TBR2 (yellow, white), co-stained with DAPI (blue), treated with DHT, T or E. g) Quantification of non-apical mitotic, PH3+ cells in XY and XX, 35d and 52d organoids, treated with DHT, T and E. Scale bars: e) 500μm, a), f) 100 μm. See Methods for details of statistics and Supplementary Table 5 for details of n numbers.
Extended Data Figure 2
Extended Data Figure 2. Basal progenitors are increased upon androgen treatment
a) Quantification of TBR2+ cells per mm2 progenitor zone (see Extended Data Fig. 1a) at 35d. b) Image of the ventricular zone/subventricular zone (VZ/SVZ) border in XX 35d organoids stained for Ki67 (green, white) and TBR2 (white). Cells positive for both Ki67 and TBR2 are indicated with magenta arrowheads. Double positive mitotic cells are indicated with yellow arrowheads. A white dashed line delineates VZ/SVZ border with the ventricular zone below. c) Immunostaining for proliferation marker Ki67 (white) on XX 35d control (left) and DHT treated (right) organoids. Dashed yellow lines represent the apical surface (bottom line) and the VZ/SVZ boundary. Note the difference in Ki67+ cells in the SVZ of DHT-treated organoids. d) Quantification of Ki67/TBR2 double positive cells, out of all TBR2+ cells, in XX 35d and 52d organoids. e) Immunostaining for HOPX (fire LUT) of XX 52d organoids. Yellow dashed line indicates the ventricular surface. Note the HOPX signal in radial glia. Images are single, 1.2 μm optical planes. f) Quantification of HOPX+ basal radial glia per mm2 SVZ of XX 52d organoids. g) Immunostaining for phosphorylated histone H3 (PH3) (green) on XX 35d and XY 52d old organoids. Co-stained with DAPI (white). h) Quantification of apical mitotic cells (PH3+), normalized per mm length of ventricle in male (XY) and female (XX) organoids, at 35d and 52d, treated with DHT, T and E. i) Quantification of ventricular length in male (XY) and female (XX) organoids, at 35d and 52d, treated with DHT, T and E. Scale bars: g) 100 μm, e) 50μm, b), c) 25μm. See Methods for details of statistics and Supplementary Table 5 for details of n numbers.
Extended Data Figure 3
Extended Data Figure 3. Clonal labelling reveals increased radial glial proliferation upon androgen treatment
a) Timeline and schematic of the Sendai/Lenti virus lineage tracing and analysis, with virus encoding emGFP injected at day 45 and virus encoding RFP injected at day 53. b) Representative images of GFP-labelled clones (white) 8 days post Sendai emGFP labelling in control (above) and DHT-treated (below) XX organoids. DAPI is in blue. c) Quantification of GFP+ clone size (left side) at 51d and 53d and RFP+ clone size at 61d. d) XX control and DHT organoids injected with Lenti-RFP at 53d, and fixed at 61d. RFP (magenta). Co-stained with DAPI (blue). e) Quantification of TBR2+ cells per mm2 of progenitor layer in control and DHT-treated XX organoids, at 8 days post-labelling with Sendai emGFP. Note that TBR2+ intermediate progenitors were not yet increased at this time point, as the radial glia which produce them were still in the VZ. Scale bars: c) 50μm, a) 25μm. See Methods for details of statistics and Supplementary Table 5 for details of n numbers.
Extended Data Figure 4
Extended Data Figure 4. Androgen receptor activity in radial glia promotes their proliferation rather than differentiation
a) RNA Scope (fluorescent in situ) for AR of XY organoids at 45d. Single AR mRNA puncta (white). Co-stained with DAPI (blue). Yellow dashed lines demarcate ventricular zone (VZ) and the subventricular zone (SVZ). a’) Portion of the VZ from a. a”) Portion of the SVZ from a. b) RNA Scope for AR of XX organoids at 45d. Single AR mRNA puncta (white). Co-stained with DAPI (blue). b’) Portion of the VZ from b. b”) Portion of the SVZ from b. Note the difference in the amount of AR mRNA in the VZ and SVZ in both cell lines. c) RNA Scope for AR of XX 21d (top) and 35d (bottom) organoids. Single AR mRNA puncta (white). Immunostaining for TBR2 (magenta). Co-stained with DAPI (blue). Yellow dashed line demarcates the apical surface c’) Portion of the ventricular zone (VZ) from XX 21d organoid. c”) Portion of the VZ from XX 35d organoid. d) RNA Scope negative (above) and positive (below) control (fire look up table) in female (XX) 35d organoids. DAPI is in white. e) Quantification of AR mRNA distribution in GFP+ pairs of cells, depending on the stage of cell division. f) RNA Scope of androgen receptor (AR) mRNA (white puncta), together with GFP signal (green) from EmGFP Sendai Fluorescence Reporter showing examples of three daughter cell pairs. Yellow dashed lines indicate GFP+ cell body. g) Western blot for AR on control, DHT and E treated organoids at 17-25 days. AR specific band is predicted to be ~110kDa. Note the increased AR signal in DHT-treated organoids. Asterisk indicates a lower amount of protein loaded for the 75d organoid lane (see Methods). For gel source data, see Supplementary Figure 1. h) Quantification of levels of AR protein from g), normalised by GAPDH expression. i) ddPCR results showing the decrease in AR transcription between days 17 and 25. ref = housekeeping gene EIF2B2. j) Representative images of the cortical wall at 21, 35 and 52d, with DAPI-labelled nuclei visible, showing the relative reduction in the radial glial progenitor layer (ventricular zone - VZ) and an increase in the thickness of the neuronal layer over time. k) Quantification of the percentage (%) of cells (AR+ DAPI), containing AR mRNA puncta (as detected by RNA Scope), out of all cells (DAPI) at 21, 35 and 52d. Cells counted: 21d – 1222, 35d – 1067, 52d – 1201. Co-stained with DAPI (white). l) XX organoids electroporated (EP) at 45d and fixed at 50d. EGFP-C1: control; EGFP-C1-AR-V7: constitutively active AR. Immunostaining for GFP and TBR2. Yellow dashed lines demarcate the apical and basal boundaries of the VZ. Note increased GFP+ nuclei in the VZ in EGFP-C1-AR-V7. m) Immunostaining for GFP (green) and Ki67 (magenta) on XX 50d organoids, electroporated at 45d. Co-stained with DAPI (blue). EGFP-C1: control plasmid; EGFP-C1-AR-V7: plasmid expressing constitutively active AR; EGFP-C1-ERaY537S: plasmid expressing constitutively active ERa. n) Quantification of the proportion of GFP+ cells co-staining for the proliferation marker Ki67 at 5 days post electroporation in XX organoids electroporated with the indicated plasmid at 45d. o) Quantification of the proportion of GFP+ cells co-staining for the intermediate progenitor marker TBR2 at 2- and 5 days post electroporation in XX organoids electroporated at 45d. At 5 days post electroporation, most cells electroporated with EGFP-C1-ERaY537S died indicating a later effect on cell survival. p) Quantification of the proportion of GFP+ cells co-staining for the neuronal marker HuC/D 2- and 5 days post electroporation in XX organoids electroporated at 45d. At 5 days post electroporation, most cells electroporated with EGFP-C1-ERaY537S died. q) XX 47d organoids, electroporated at 45d. Immunostaining for GFP (green), NGN2 (cyan) and BRN2 (magenta). Co-stained with DAPI (white). Yellow arrowheads: GFP+/NGN2+ cells. White arrowheads: GFP+/BRN2+ cells. Yellow dashed line demarcates the apical surface. Note the increased expression of differentiation markers upon expression of ERaY537S perhaps indicating a premature cell cycle exit and relating to the cell death observed. r) Quantification of the proportion of GFP+ cells co-staining for the neurogenic marker NGN2 2 days post electroporation in XX organoids electroporated at 45d. s) Quantification of the proportion of GFP+ cells co-staining for the upper layer neurogenesis marker BRN2 2 days post electroporation in XX organoids electroporated at 45d. Scale bars: a), b), l), m) 50μm, c), d), q) 25μm, a’), a”), b’), b”), j) 20μm, c’), c”), f) 5μm. See Methods for details of statistics and Supplementary Table 5 for details of n numbers.
Extended Data Figure 5
Extended Data Figure 5. Live imaging of radial glial division modes upon activation and androgen signaling
a) Still images from live imaging of organoids electroporated at 31d and imaged beginning at 2 days post-electroporation (see Methods for details of image acquisition). pCAG-mCherry+ cells are shown in magenta, and EGFP-C1-AR-V7+ are shown in green. Green arrowheads: GFP+ cells. Yellow arrowheads: mCherry+/GFP– cells. Filled in arrowheads: one of the tracked daughter cells. a) Comparison of the behaviour of mCherry+ and GFP+ only cells at 33d. Basal surface is up. mCherry+ only cell, upon division (06:11) produces two daughter cells, one of which migrates basally, indicating a more differentiated identity, while the other stays in the ventricular zone (VZ), representing an example of asymmetric division. GFP+ cell divides (07:28), but both of the daughter cells continue to reside in the VZ. b) Still images from live imaging of organoids electroporated at 54d and imaged at 56d. Basal surface is down. After division (15:50), both of the daughter cells remain in the VZ. Yellow dashed lines demarcate the apical surfaces. Time scale: hours:minutes. c) Schematic of the proposed mechanism leading to increased basal progenitors. Radial glia can divide symmetrically, increasing their numbers, or asymmetrically, generating one radial glia and one basal progenitor. Application of androgen supports symmetric, proliferative divisions, thus increasing the size of radial glial clones. After androgen is withdrawn, these radial glia can start producing basal progenitors in increased numbers, as shown in Fig. 1b, c. Basal progenitors represented as a single population (yellow cells), for clarity. Scale bars: a), b) 20μm. See Methods for details of statistics and Supplementary Table 5 for details of n numbers.
Extended Data Figure 6
Extended Data Figure 6. Transcriptomics reveals key signaling pathways and cell types
a) Principle component analysis (PCA) plots of XX 35d bulk RNA-seq, uncorrected for batch effects. b) Principle component analysis (PCA) plots of XX 35d bulk RNA-seq, corrected for batch effects using the R package ComBat. Filtering of lowly expressed genes was performed prior to batch correction, resulting in different PC value scales between a and b. See Methods. c) Quantification of SRD5A1, an upregulated DEG under androgen treatment. SRD5A1 was quantified as the number of SRD5A1+ puncta per 10μm2 of the ventricular zone (VZ) in XX 35d control and DHT-treated organoids. d) Venn diagram representing the overlap of up- and downregulated DEGs in androgen treated XX 35d organoids with genes differentially expressed in schizophrenia patients. P values represent significance of a hypergeometric test of the intersection with up- and downregulated genes (P=3.6E-4 and P=0.0012, respectively). DE: differentially expressed. e) Top significant GO term enrichments in XX 35d androgen upregulated genes. f) Left, UMAP plot showing different clusters identified by scRNA-seq in 35d old treated and control XX organoids. Right, UMAP plot showing the distribution of cells belonging to control, DHT and E treatments. Note the high degree of overlap indicating reproducibility. g) Heatmap showing scaled expression levels of cluster specific genes identified through differential gene expression analysis across clusters. The top 10 genes ordered by average log fold change are shown for each cluster. h) Dot plot showing the relative expression of cell type-specific markers. i) Feature scatter plot for percent ribosome (percent.ribo) by percent mitochondrial (percent.mt) reads. Left, plotted data points grouped by RG subcluster. Right, plotted data points grouped by treatment status. -0.27 refers to the correlation coefficient. j) Pseudotime analysis using Monocle3 mapped onto the reclustered seurat neural clusters (all clusters except ChP/Hem) UMAP. k) Feature plot of the neurogenic marker BTG2 (Tis21) and more mature marker synaptotagmin (SYT1) which was also identified as upregulated in RG2 cluster. l) Dot plot of the subclustering of the IP/N cell population showing the relative expression of cell type-specific markers and clear separation of different cell subpopulations. ImmN = immature neurons, MatN = maturing neurons. m) Stacked bar plot of radial glial (RG) cluster proportions detected by scRNA-seq at 35d. Upper right: chi-square with Monte Carlo simulation for overall distribution (Supplementary Table 4). Note increased RG1 and bRG, but decrease in more committed RG2, with no significant difference compared with expected counts in total RG (combined four RG clusters) and non-RG clusters (IP/N and ChP/Hem) in DHT treatment as determined by chi-square test (not shown) indicating specificity for RG subclusters. *P<0.05 and **P<0.00005 n) Point range plot of Monte Carlo permutation test of statistical significance between cell cluster proportions in DHT compared with control (left) and E compared with control (right) displaying bootstrapped confidence intervals for the difference in cluster proportion (reported as observed log2 fold-change) (see Methods). o) Dot plot showing the relative expression of bRG markers in different treatments, detected by scRNA-seq, in 35d old organoids. See Methods for details of statistics and Supplementary Table 5 for details of n numbers.
Extended data Figure 7
Extended data Figure 7. HDAC activity interacts with androgen signalling to influence progenitor behaviour
a) Dot plot showing the relative expression of HDACs in different treatments, detected by scRNA-seq, in 35d old organoids. b) UMAP plots showing the relative expression of HDAC2 in cells from control, DHT and E treated organoids. Right - UMAP plot showing the radial glia clusters identified by scRNA-seq. Yellow circle demarcates the bRG subpopulation. Note the increased expression of HDAC2 in DHT bRG cluster. c) Immunostaining for TBR2 (green) and HuC/D (magenta) in XX 35d organoids, treated with VPA from 17d. Co-stained with DAPI (white, blue). c’) c”) c”’) insets from c), as indicated. Yellow asterisks indicate neural rosettes forming above the VZ in some VPA-treated organoids. d) Quantification of ventricular length for XX 35d old organoids treated with VPA and VPA+DHT. e) Immunostaining for CTIP2 (magenta), and SATB2 (green, white) on XX 35d control and VPA-treated organoids. Co-stained with DAPI (blue). e’), e”) insets from e) showing just SATB2 in fire look-up table. e”) Note the SATB2+ cells (yellow arrowheads) and SATB2+ staining present in the VZ in VPA-treated organoids. Yellow dashed lines demarcate the apical and basal boundaries of the VZ. f) Quantification of SATB2+ cells in the cortical wall of control, VPA- and VPA+DHT-treated organoids in XX organoids at 35d. g) Quantification of the thickness of VZ for XX 35d organoids treated with VPA and VPA+DHT. h) Immunostaining for TBR2 (yellow) in 35d old XX organoids with the following treatments: DHT, MI-192 (HDAC2/3 inhibitor), MI-192+DHT, MS-275 (HDAC1/3 inhibitor), MS-275+DHT. White dashed line demarcates the apical surface. i) Quantification of TBR2+ cells per mm2 of the control and the following treatments: DHT, MI-192 (HDAC2/3 inhibitor), MI-192+DHT, MS-275 (HDAC1/3 inhibitor), MS-275+DHT in 35d old XX organoids. Scale bar: c) 100 μm, c’), c”), c”’), e), h) 50μm, e’), e”) 20μm. See Methods for details of statistics and Supplementary Table 5 for details of n numbers.
Extended Data Figure 8
Extended Data Figure 8. Downstream mTOR activity influences progenitor expansion
a) Heatmap showing scaled expression of differentially expressed genes in DHT-treated compared to control organoids, detected by scRNAseq. Cell identities were assigned to their treatment group and differential expression analysis performed in Seurat as performed for comparison across clusters (see Methods). b) Dotplot showing the relative expression of bRG markers, overlapping markers of RG1 cells and DE transcripts in DHT, and genes of the mTOR pathway in cells from control, DHT and E treated organoids, detected by scRNAseq. c) Protein interaction network of upregulated DEG directly-interacting genes, obtained by bulk RNA seq. Translation/ribosome biogenesis genes are in red. d) Immunostaining for phosphorylated S6 (PS6) (fire look-up table), an indicator of mTOR activity, in 35d old XX organoids, treated with DHT and E. White arrowheads indicate PS6+ cell bodies in the ventricular zone (VZ). e) Quantification of PS6+ cells in the VZ of control, DHT- and E-treated 35d old XX organoids. f) Immunostaining for TBR2 (white) in control and MHY-1485-treated 35d XX organoids. Costained with DAPI (blue). g) Quantification of TBR2+ cells per mm2 progenitor layer in control and MHY-1485-treated 35d XX organoids. Scale bars: d), f) 50μm. See Methods for details of statistics and Supplementary Table 5 for details of n numbers.
Extended Data Figure 9
Extended Data Figure 9. Ventral progenitors and mouse organoids exhibit differential responses to those of human excitatory neurogenic progenitors
a) Schematic of neurogenesis in the human developing brain at ~12 gestation weeks. Excitatory neurons (green arrows) are born within the dorsal cortex and migrate basally to form the cortical plate. Inhibitory neurons (orange arrow) are born in the ventral telencephalon and migrate towards the dorsal side to incorporate themselves into the cortical plate. Yellow: progenitor zone, dark pink: cortical plate. b) RNA Scope (fluorescent in situ hybridization) for AR mRNA (white) in XX and XY 45d old ventral organoids. Co-stained with DAPI (blue). b’) and b”) - portions of the VZ, as indicated. Note the decreased levels compared with Extended Data Fig. 4a. c) Above: Heatmap of steroidogenic enzyme expression from XX 35d bulk RNA-seq. Values are in tpm. Below: Schematic of the steroidogenic pathway. Purple – SRD5A1. ESR1, ESR2-estrogen receptors a and b, respectively. d) Comparison of SRD5A1 (fire LUT) immunostaining on XX and XY dorsal 35d and ventral 45d organoids. Both anti-SRD5A1 and anti-TBR2 primary antibodies were used in XY samples, and the secondary antibody recognised both primary antibodies but are discernible by their different subcellular localisations. Co-stained with DAPI (white). Yellow dashed lines demarcate the apical and basal boundaries of the VZ. d’) Portion of the VZ in XX dorsal 35d organoids stained for SRD5A1. Note the SRD5A1+ puncta. d”) Portion of the VZ in XX ventral 45d organoids stained for SRD5A1. d”’) Portion of the VZ in XY dorsal 35d organoids stained for SRD5A1. Note the SRD5A1+ puncta. d””) Portion of the VZ in XY ventral 45d organoids stained for SRD5A1. White arrowhead - SRD5A1+ punctum. e) Timeline of the mouse organoid generation protocol. See Methods for details. f) Immunostaining for TBR2 (yellow) on 11d old mouse organoids in control, DHT- and E- treated organoids. Costained with DAPI (blue). g) Quantification of TBR2+ cells per mm2 of progenitor layer in mouse organoids at 9d and 11d. Scale bars: b), d), f) 50μm, b’), b”) 20μm, d’), d”), d”’), d””) 10μm. See Methods for details of statistics and Supplementary Table 5 for details of n numbers.
Extended Data Figure 10
Extended Data Figure 10. Excitatory neurons are increased upon release of androgen signaling
a) Immunostaining of XX 52d continuously treated control and DHT organoids stained for NEUROD2 (white). b) Quantification of NEUROD2+ cells per mm2 of cortical wall at 35 days, in XY and XX organoids. c) Quantification of NEUROD2+ cells per mm2 of cortical wall at 52 days, in XY and XX organoids. d) Timeline of the pulse-chase experiment. Hormones were administered between 17-35d, then removed. Organoids were fixed at 52d and 75d. e) NEUROD2+ cells per mm2 cortical wall after pulse-chase treatment. f) Immunostaining for CTIP2 (white) of XX 52d organoids after pulse-chase treatment (control and DHT). Co-stained with DAPI (blue). g) Quantification of CTIP2+ cells per mm2 cortical wall after pulse-chase treatment. h) Quantification of SATB2+ cells per 0.5mm2 cortical wall at 75d after pulse-chase treatment. Scale bars: a) 100μm, f) 50μm. See Methods for details of statistics and Supplementary Table 5 for details of n numbers.
Figure 1
Figure 1. Androgens lead to expanded basal progenitors through increased radial glial stem cell proliferation
a) Schematic of the project workflow and treatment timeline. b) Female (XX) treated organoids stained for the intermediate progenitor marker TBR2 and DAPI. c) Quantification of TBR2+ cells per mm2 progenitor zone (see Extended Data Fig. 1a). Grey bars refer to P values as in panel e. d) Treated XX organoids injected with Sendai emGFP at 45d, fixed at 53d and stained for GFP, TBR2 and NEUROD2. Yellow dashed lines indicate ventricular surface. White arrowheads: TBR2/GFP double positive cells. Magenta arrowhead: NEUROD2/GFP double positive cell. Note increased GFP+ cells in the VZ upon DHT treatment. e) Quantification of GFP+ cells co-staining for the proliferation marker Ki67 at 2 days post electroporation of indicated constructs in XX organoids. Scale bars: b), d) 50μm, d’), d”) 25μm. See Methods for details of statistics and Supplementary Table 5 for details of n numbers.
Figure 2
Figure 2. Transcriptomics reveal involvement of HDACs and mTOR in androgen-mediated phenotype
a) Normalised TPM values from bulk RNA-seq plotted for control and androgen treatment. DEGs detected using Delboy. Green: upregulated DEGs, magenta: downregulated DEGs. Blue shade indicates data density (count). b) HuC/D immunostaining in treated XX 35d organoids. Yellow arrowheads: HuC/D+ cells in the VZ. c) Quantification of HuC/D+ cells per mm2 VZ in treated XX 35d organoids. d) Percentage of TBR2+ cells in the SVZ, out of all TBR2+ cells, for XX 35d treated organoids. e) Immunostaining for TBR2 and DAPI in control, sapanisertib and sapanisertib+DHT treated 35d XX organoids. f) Quantification of TBR2+ cells per mm2 progenitor layer in control, sapanisertib and sapanisertib+DHT treated 35d XX organoids. Scale bars: b), e) 50μm. See Methods for details of statistics and Supplementary Table 5 for details of n numbers.
Figure 3
Figure 3. Specific increase in excitatory neurogenesis upon androgen surge
a) Immunostaining for ventral intermediate progenitor marker DLX2 and DAPI on XX 45d ventralised organoids. b) DLX2+ cells per mm2 progenitor layer for treated XX and XY organoids. c) SATB2 immunostaining and DAPI after pulse-chase treatment. Yellow dashed line indicates the ventricular surface. d) SATB2+ cells per mm2 cortical wall after pulse-chase treatment. e) Growth curve of the predicted effect of androgens on neuron number (9.4% increase). f) Proposed model: Radial glia express androgen receptor intermittently and decreasing over time. Androgens act on radial glia to increase proliferation, increasing the stem cell pool. As AR and the fetal surge drop over time, these effects weaken and the increased radial glia give rise to increased basal progenitors and finally to increased excitatory neurons. Scale bars: a) 50μm, c) 100μm, c’) c”) 25μm. See Methods for details of statistics and Supplementary Table 5 for details of n numbers.

Comment in

References

    1. Ritchie SJ, et al. Sex Differences in the Adult Human Brain: Evidence from 5216 UK Biobank Participants. Cereb Cortex. 2018;28:2959–2975. - PMC - PubMed
    1. Ruigrok ANV, et al. A meta-analysis of sex differences in human brain structure. Neurosci Biobehav Rev. 2014;39:34–50. - PMC - PubMed
    1. Lancaster MA, et al. Cerebral organoids model human brain development and microcephaly. Nature. 2013;501:373. - PMC - PubMed
    1. Green T, Flash S, Reiss AL. Sex differences in psychiatric disorders: what we can learn from sex chromosome aneuploidies. Neuropsychopharmacol. 2018;44:9–21. - PMC - PubMed
    1. McCarthy MM. Multifaceted origins of sex differences in the brain. Philosophical Transactions Royal Soc B Biological Sci. 2016;371:20150106 - PMC - PubMed

Publication types

MeSH terms