. 2022 Jan 3:12:799711.
doi: 10.3389/fendo.2021.799711. eCollection 2021.

A Novel Tree Shrew Model of Diabetic Retinopathy

Affiliations

A Novel Tree Shrew Model of Diabetic Retinopathy

Oleg S Gorbatyuk et al. Front Endocrinol (Lausanne). .

Abstract

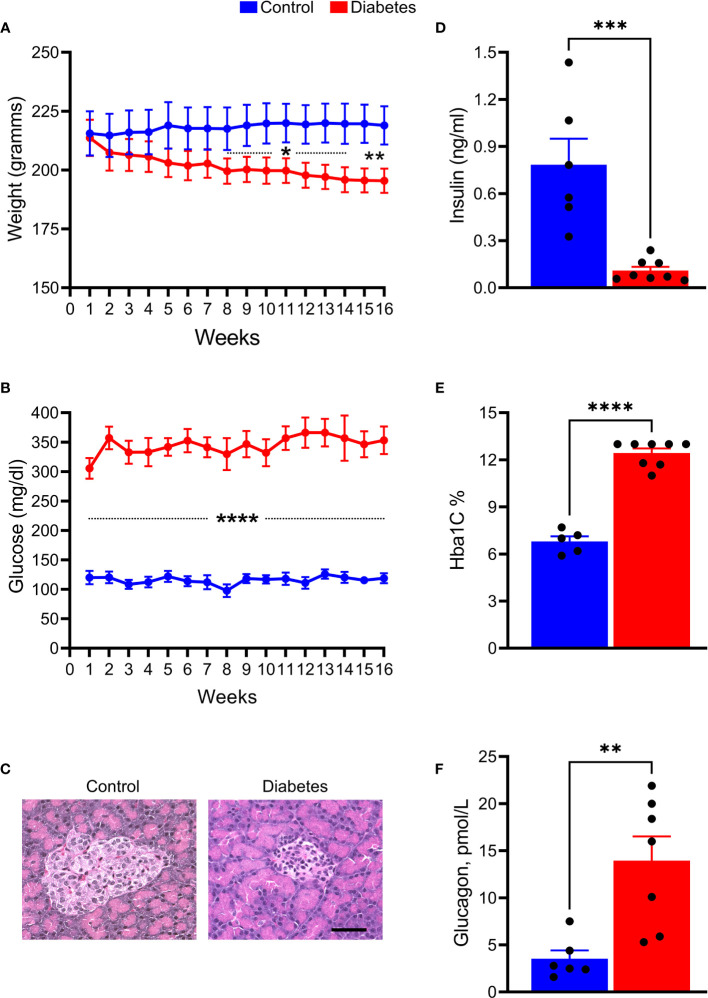
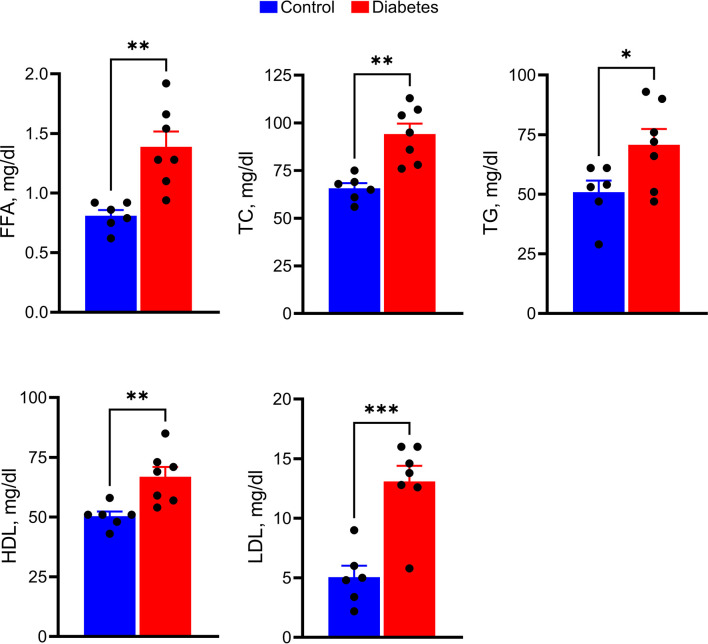
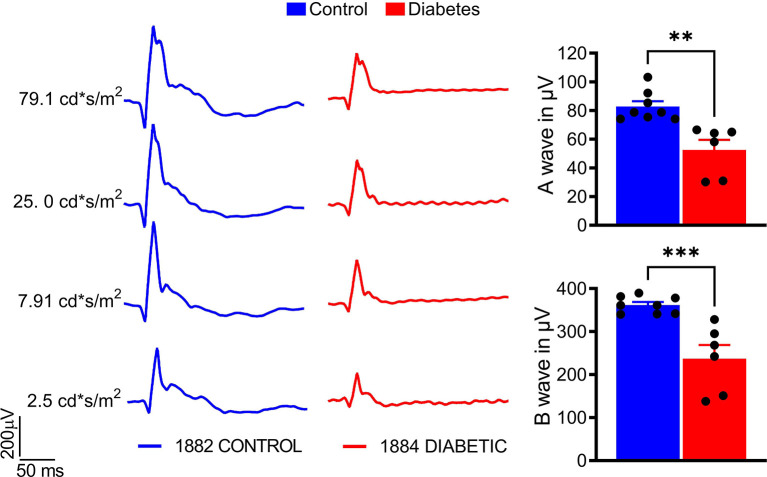
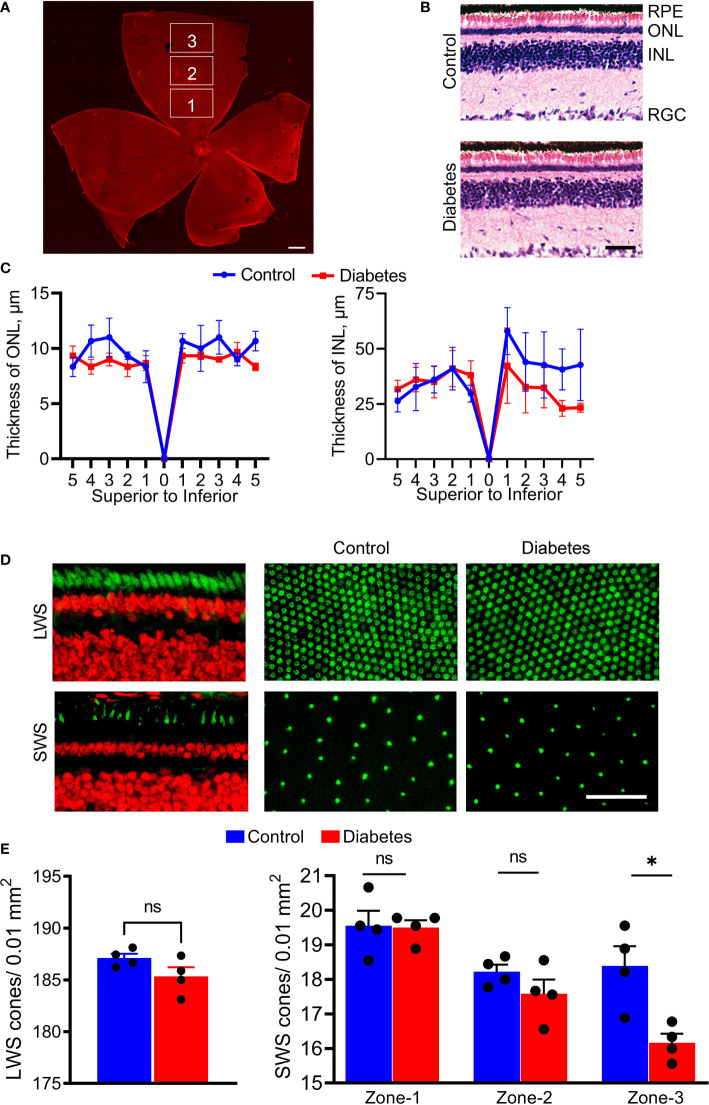
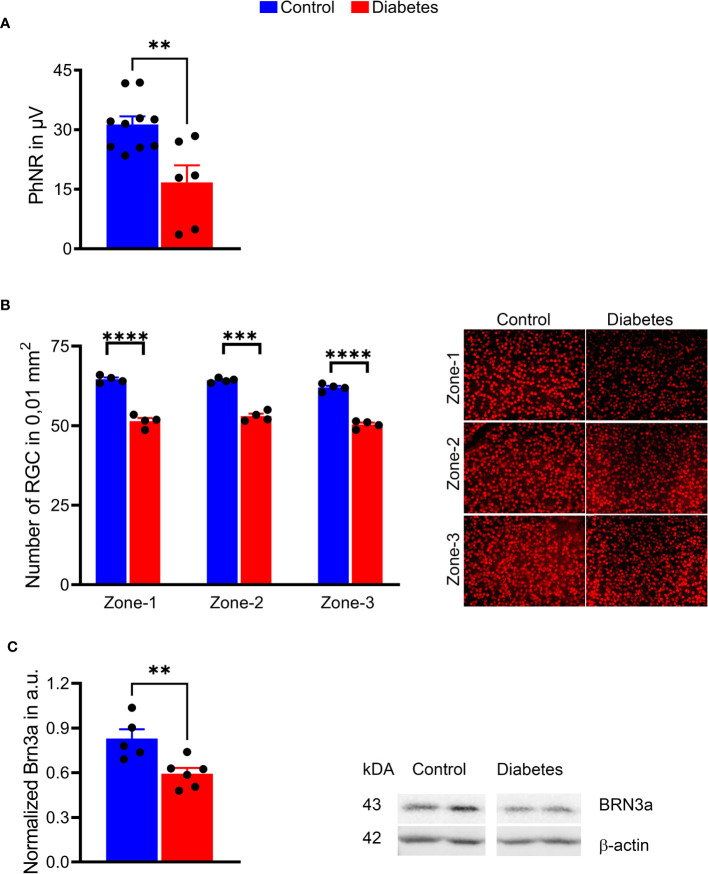
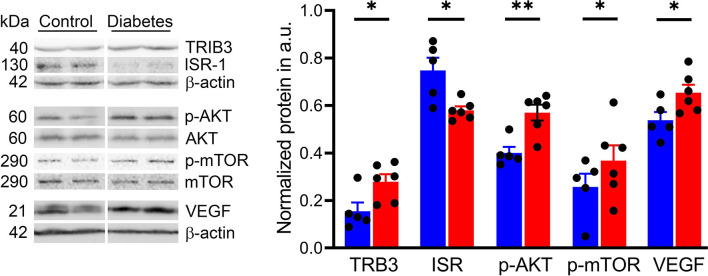
Existing animal models with rod-dominant retinas have shown that hyperglycemia injures neurons, but it is not yet clearly understood how blue cone photoreceptors and retinal ganglion cells (RGCs) deteriorate in patients because of compromised insulin tolerance. In contrast, northern tree shrews (Tupaia Belangeri), one of the closest living relatives of primates, have a cone-dominant retina with short wave sensitivity (SWS) and long wave sensitivity (LWS) cones. Therefore, we injected animals with a single streptozotocin dose (175 mg/kg i.p.) to investigate whether sustained hyperglycemia models the features of human diabetic retinopathy (DR). We used the photopic electroretinogram (ERG) to measure the amplitudes of A and B waves and the photopic negative responses (PhNR) to evaluate cone and RGC function. Retinal flat mounts were prepared for immunohistochemical analysis to count the numbers of neurons with antibodies against cone opsins and RGC specific BRN3a proteins. The levels of the proteins TRIB3, ISR-1, and p-AKT/p-mTOR were measured with western blot. The results demonstrated that tree shrews manifested sustained hyperglycemia leading to a slight but significant loss of SWS cones (12%) and RGCs (20%) 16 weeks after streptozotocin injection. The loss of BRN3a-positive RGCs was also reflected by a 30% decline in BRN3a protein expression. These were accompanied by reduced ERG amplitudes and PhNRs. Importantly, the diabetic retinas demonstrated increased expression of TRIB3 and level of p-AKT/p-mTOR axis but reduced level of IRS-1 protein. Therefore, a new non-primate model of DR with SWS cone and RGC dysfunction lays the foundation to better understand retinal pathophysiology at the molecular level and opens an avenue for improving the research on the treatment of human eye diseases.

Keywords: diabetes; diabetic cone; diabetic retinopathy; p-AKT/p-mTOR axis; retinal ganglion cells; tree shrews.


Conflict of interest statement

The authors declare that the research was conducted in the absence of any commercial or financial relationships that could be construed as a potential conflict of interest.

Figures

Figure 1
Figure 1
STZ injection results in the development and progression of T1D diabetes in tree shrews. (A) The body weight was reduced in diabetic tree shrews, starting at 8 weeks after injection. (B) At 1 week after the STZ injection, the blood glucose levels were significantly and consistently upregulated > 300 mg/ml in diabetic animals as compared with control tree shrews. (C) The islet β cells were almost lost in the pancreas of diabetic animals as a result of STZ injection leading to diminished insulin production measured in the serum of diabetic and control animals (D, E) The HbA1c levels measured at the end of the experimental protocol were markedly increased in diabetic tree shrews compared with control animals, suggesting sustained hyperglycemia after injection with STZ. (F) Both the reduction in insulin production and the increase in HbA1C were in agreement with elevated glucagon level in the serum of diabetic tree shrews (n=xx). *p < 0.05, **p < 0.01, ***p < 0.001, ****p < 0.000, n= 5-8.
Figure 2
Figure 2
Hyperglycemic tree shrews undergo changes in the levels of serum parameters such as FFA, TC, TG, HDL, and LDL. *p < 0.05, **p < 0.01, ***p < 0.001, (n= 6-7).
Figure 3
Figure 3
Sustained hyperglycemia results in compromised cone photoreceptor function. The photopic ERG were recorded with the LKC setup (right). A- and B-wave photopic ERG amplitudes were diminished in the diabetic tree shrew retina (left). The calculation of the photopic ERG A- and B- wave amplitudes at 25 cd*s/m2 is shown. **p < 0.01, ***p < 0.001, (n= 6-8).
Figure 4
Figure 4
Histological changes of diabetic retinas. (A) The retinal flat mounts were divided by zone-1, zone-2, and zone-3 to count cone photoreceptor and retinal ganglion cells (propidium iodide in red). (B) Images of the H&E-stained control and diabetic retinas. (C) Spider plots depicting the thicknesses of the ONL and INL. The spider plots were generated by plotting the number of nuclei using 1000 µm step in the distance from the ONH for both hemispheres. (D) Fluorescent images showing sections of the retina and retinal flat mounts from control and diabetic tree shrews processed with anti-green/red cone opsin (Green, upper panel) and anti-blue cone opsin (Green, bottom panel) primary antibodies, as well as with propidium iodide (Red). (E) The number of LWS cones did not differ between the diabetic and control groups (left graph); however, the number of SWS cones showed small but significant differences between diabetic and control groups in zone 3 (right graph) . *p < 0.05, (n= 4, each). Scale bars: (A)- 1000 µm, (B, D) – 50 µm. ns, non-significant.
Figure 5
Figure 5
Sustained hyperglycemia resulted in compromised RGC function. (A) The PhNR amplitudes were reduced by 50% in the diabetic retina (right panel). (B) Images of the retinal flat mount processed with anti-BRN3A antibody (left panel). The number of BRN3A-positive RGCs in the diabetic retina was markedly reduced in zone 1, zone 2, and (zone-3 areas compared to the control group (right panel). See also Figure 4 for depicted area. (C) In agreement with the immunohistochemistry analysis, the expression of BRN3A protein was also diminished as detected by western blot analysis (representative membrane images on the left; calculated data on the right). **p < 0.01, ***p < 0.001, ****p < 0.0001, (n= 5-10).
Figure 6
Figure 6
Sustained hyperglycemia results in the alteration of cellular signaling in diabetic retinas. Representative images of the western blot membranes are shown on the left. The measured normalized values of the proteins in question are shown on the right. Reduced IRS expression was detected in diabetic retinas along with an increase in the p-AKT/p-mTOR pathway. In addition, we observed an increase in TRIB3 and VEGF expression, supporting our previous findings in human and mouse diabetic retinas. *p < 0.05, **p < 0.01, (n= 5-6).

References

    1. Wong TY, Sabanayagam C. Strategies to Tackle the Global Burden of Diabetic Retinopathy: From Epidemiology to Artificial Intelligence. Ophthalmologica (2020) 243:9–20. doi: 10.1159/000502387 - DOI - PubMed
    1. Resnikoff S, Pascolini D, Etya’ale D, Kocur I, Pararajasegaram R, Pokharel GP, et al. . Global Data on Visual Impairment in the Year 2002. Bull World Health Organ (2004) 82:844–51. - PMC - PubMed
    1. Rossino MG, Dal Monte M, Casini G. Relationships Between Neurodegeneration and Vascular Damage in Diabetic Retinopathy. Front Neurosci (2019) 13:1172. doi: 10.3389/fnins.2019.01172 - DOI - PMC - PubMed
    1. Barber AJ, Lieth E, Khin SA, Antonetti DA, Buchanan AG, Gardner TW. Neural Apoptosis in the Retina During Experimental and Human Diabetes. Early Onset Effect Insulin J Clin Invest (1998) 102:783–91. doi: 10.1172/JCI2425 - DOI - PMC - PubMed
    1. Murakami T, Yoshimura N. Structural Changes in Individual Retinal Layers in Diabetic Macular Edema. J Diabetes Res (2013) 2013:920713. doi: 10.1155/2013/920713 - DOI - PMC - PubMed

Publication types