. 2022 Jan 3:12:796922.
doi: 10.3389/fmicb.2021.796922. eCollection 2021.

Analysis of mRNA and circRNA Expression Profiles of Bovine Monocyte-Derived Macrophages Infected With Mycobacterium avium subsp. paratuberculosis

Affiliations

Analysis of mRNA and circRNA Expression Profiles of Bovine Monocyte-Derived Macrophages Infected With Mycobacterium avium subsp. paratuberculosis

Yanhong Bao et al. Front Microbiol. .

Abstract

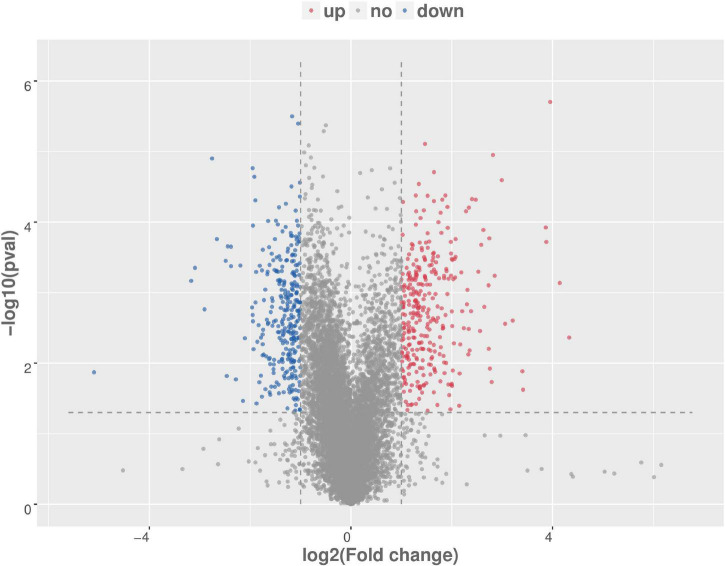
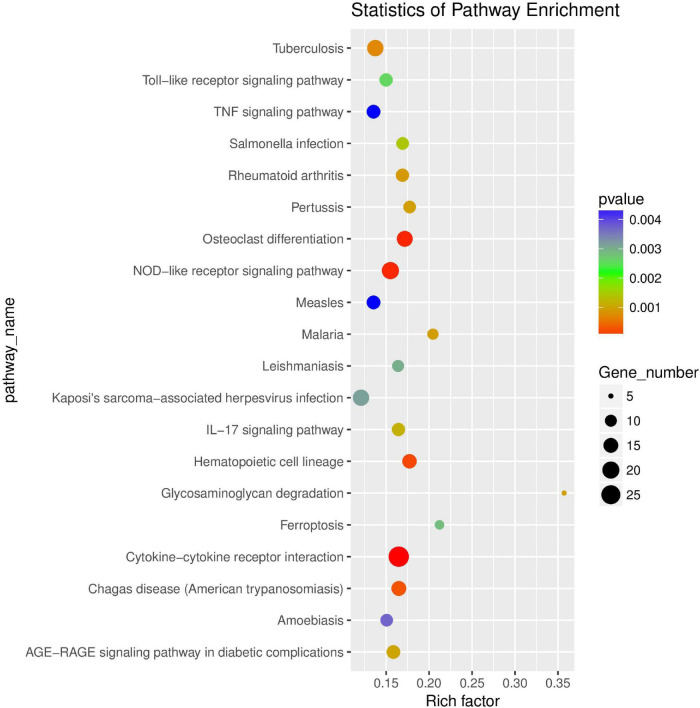
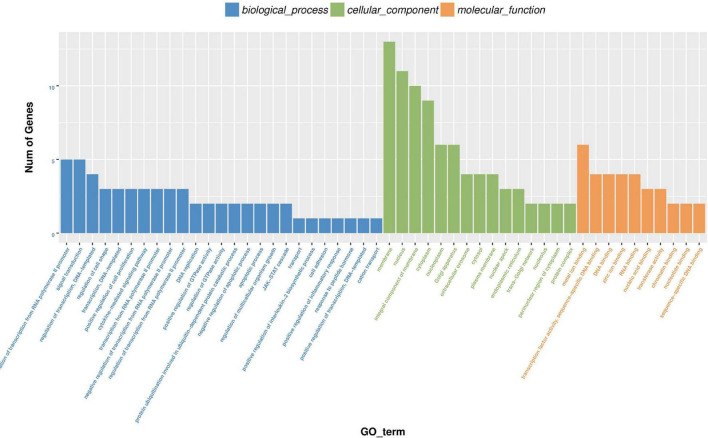
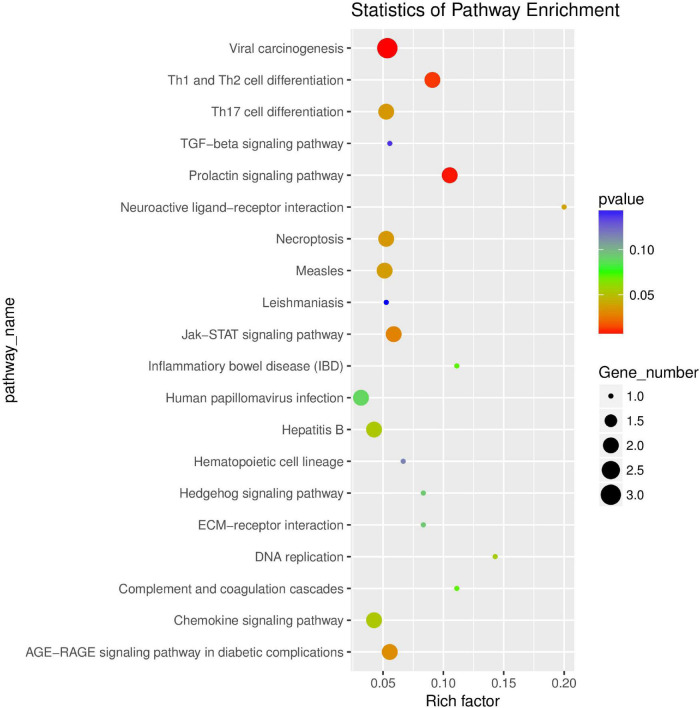
Mycobacterium avium subsp. paratuberculosis (MAP) is the pathogen of Johne's disease (paratuberculosis), which mainly causes chronic infectious granulomatous enteritis in ruminants and has brought huge economic losses to animal husbandry. As a specific intracellular pathogen, when MAP invades the body, it is internalized by macrophages where it is able to replicate by inhibition of the phagosome maturation, escaping the host immune system and surviving, which leads to the spread of the disease. More recent studies have shown that circRNA is involved in many pathological and physiological processes of the body as the molecular sponge of miRNA, the scaffold of RNA binding protein and having the characteristic of being able to translate into protein. In this study, the mRNA and circRNA expression profiles of MAP-infected bovine monocyte-macrophages and uninfected bovine cells were analyzed by high-throughput sequencing. A total of 618 differentially expressed mRNA were screened out, including 322 upregulated mRNA and 296 downregulated mRNA. In addition, the analysis of circRNA differential expression profile showed 39 differentially expressed genes including 12 upregulated and 27 downregulated genes. Moreover, differential genes belonging to cytokine activity, chemokine activity, inflammatory reaction, apoptosis, and other functional groups related to macrophage immune response were significantly enriched in Gene Ontology (GO). Multiple signal pathways including NF-κB, MAPK, Toll-like receptor, IL-17, JAK-STAT, and other signaling pathways related to activating macrophage immune response were significantly enriched in Kyoto Encyclopedia of Genes and Genomes (KEGG). In addition, RT-qPCR technology verified the accuracy of the mRNA sequencing results. In this study, we have obtained the transcriptome information of mRNA and circRNA of bovine monocyte-macrophage infected with MAP. These results will provide data support for the further study of mRNA-miRNA-circRNA network and immune escape mechanism of MAP and will enrich the knowledge of the molecular immune mechanisms of Johne's disease as well.

Keywords: M. avium subsp. paratuberculosis; circRNA; high-throughput sequencing; mRNA; monocyte-macrophage.


Conflict of interest statement

The authors declare that the research was conducted in the absence of any commercial or financial relationships that could be construed as a potential conflict of interest.

Figures

FIGURE 1
FIGURE 1
Density distribution map of reference sequence. The abscissa is the position of the chromosome, and the ordinate is the median of read density (log2).
FIGURE 2
FIGURE 2
Statistical map of gene expression value distribution of each sample. The abscissa is the sample name, the ordinate is log10 (FPKM), and the box chart of each region corresponds to five statistics (maximum, upper quartile, median, lower quartile, and minimum from top to bottom).
FIGURE 3
FIGURE 3
Density map of gene expression values of different samples. The abscissa is log10 (FPKM), and the ordinate is the density of genes.
FIGURE 4
FIGURE 4
Volcanic map analysis of differential gene expression level. A scatter plot shows the correlation of gene abundance. The red dot, blue dot, and gray dot signify upregulation, downregulation, and not different, respectively.
FIGURE 5
FIGURE 5
Cluster analysis of differential gene expression level. The abscissa is the sample and the ordinate is the gene. Red indicates high expression gene, and dark blue indicates low expression gene.
FIGURE 6
FIGURE 6
(A) Histogram of GO enrichment of differential genes. The first 20 GO enrichment maps of molecular function. (B) Histogram of GO enrichment of differential genes. The first 20 GO enrichment maps of cell composition. (C) Histogram of GO enrichment of differential genes. The first 20 GO enrichment maps of biological process.
FIGURE 7
FIGURE 7
Scatter plot of KEGG enrichment of differential genes. The abscissa Rich factor indicates the number of differential genes located in the KEGG/the total number of genes located in the KEGG. The ordinate is Pathway term, that is, KEGG metabolic pathway.
FIGURE 8
FIGURE 8
(A) RT-qPCR validation. Expression of selected mRNAs validated with RT-qPCR. Drawing with genes as abscissa and FPKM as ordinates. (B) RT-qPCR validation. Expression of selected mRNAs validated with RT-qPCR. Drawing with genes as abscissa and fold-change as ordinates.
FIGURE 9
FIGURE 9
Differentially expressed circRNA volcanic map, with log2 (fold-change) as the abscissa, –log10 (p-value) as the ordinate. Red, blue, and gray are representative the upregulated, downregulated, and unchanged circRNAs, respectively.
FIGURE 10
FIGURE 10
Cluster analysis of differentially expressed circRNA. The abscissa is the sample, and the ordinate is the differentially expressed genes screened out. Red indicates highly expressed genes, and dark blue indicates low expressed genes.
FIGURE 11
FIGURE 11
Histogram of differential expression circRNA-hosting gene GO enrichment analysis. Take GO term as abscissa and Num of genes as ordinate.
FIGURE 12
FIGURE 12
Scatter plot of differential expression circRNA-hosting gene KEGG enrichment analysis. The abscissa is Rich factor (Rich factor = S gene number/B gene number). The ordinate is Pathway term, that is, KEGG metabolic pathway.

References

    1. Abbas M., Munir M., Khaliq S. A., Haq M. I., Tanveer K. M., Qureshi Z. U. (2011). Detection of paratuberculosis in breeding bulls at Pakistani semen production units: a continuous source of threat. ISRN Vet. Sci. 2011:501235. 10.5402/2011/501235 - DOI - PMC - PubMed
    1. Arsenault R. J., Maattanen P., Daigle J., Potter A., Griebel P., Napper S. (2014). From mouth to macrophage: mechanisms of innate immune subversion by Mycobacterium avium subsp. paratuberculosis. Vet. Res. 45:54. 10.1186/1297-9716-45-54 - DOI - PMC - PubMed
    1. Bannantine J. P., Bermudez L. E. (2013). No holes barred: invasion of the intestinal mucosa by Mycobacterium avium subsp. paratuberculosis. Infect Immun. 81 3960–3965. 10.1128/IAI.00575-13 - DOI - PMC - PubMed
    1. Behar S. M., Divangahi M., Remold H. G. (2010). Evasion of innate immunity by Mycobacterium tuberculosis: is death an exit strategy? Nat. Rev. Microbiol. 8 668–674. 10.1038/nrmicro2387 - DOI - PMC - PubMed
    1. Behar S. M., Martin C. J., Booty M. G., Nishimura T., Zhao X., Gan H. X., et al. (2011). Apoptosis is an innate defense function of macrophages against Mycobacterium tuberculosis. Mucosal. Immunol. 4 279–287. 10.1038/mi.2011.3 - DOI - PMC - PubMed