Clinical Trial
. 2022 Jan 3:12:786429.
doi: 10.3389/fimmu.2021.786429. eCollection 2021.

Spatial Distribution and Predictive Significance of Dendritic Cells and Macrophages in Esophageal Cancer Treated With Combined Chemoradiotherapy and PD-1 Blockade

Affiliations
Clinical Trial

Spatial Distribution and Predictive Significance of Dendritic Cells and Macrophages in Esophageal Cancer Treated With Combined Chemoradiotherapy and PD-1 Blockade

Xiaoxue Ma et al. Front Immunol. .

Abstract

Background: The first clinical study (NCT03671265) of first-line chemoradiotherapy combined with PD-1 blockade showed promising treatment outcomes in locally advanced esophageal squamous cell carcinoma (ESCC). However, partial patients did not respond to the combination treatment. The roles of dendritic cells (DCs) and macrophages in this combination treatment remain poorly understood.

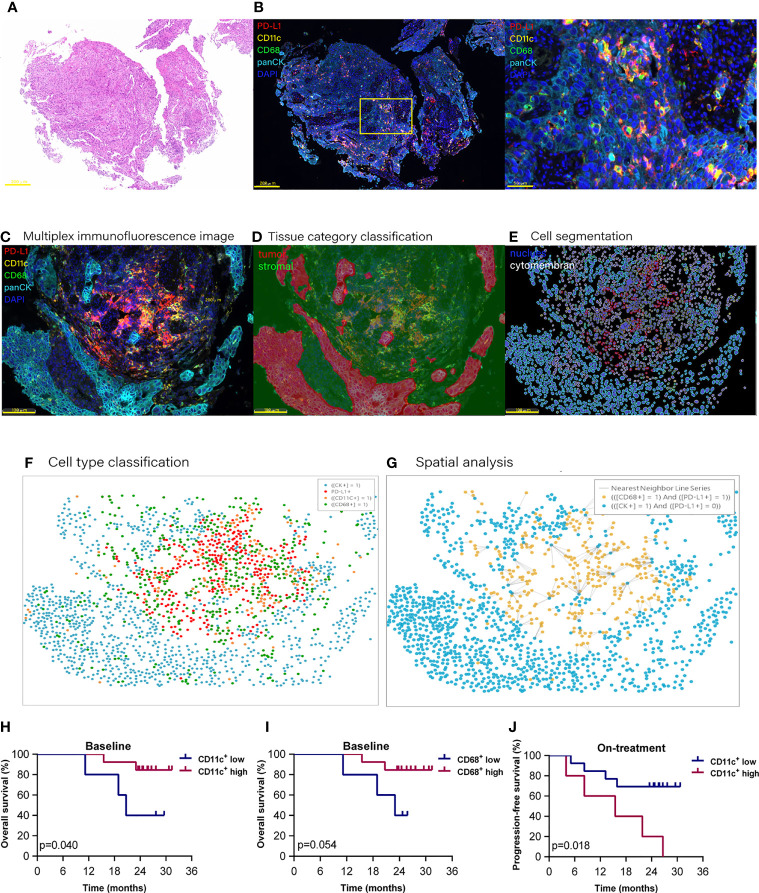
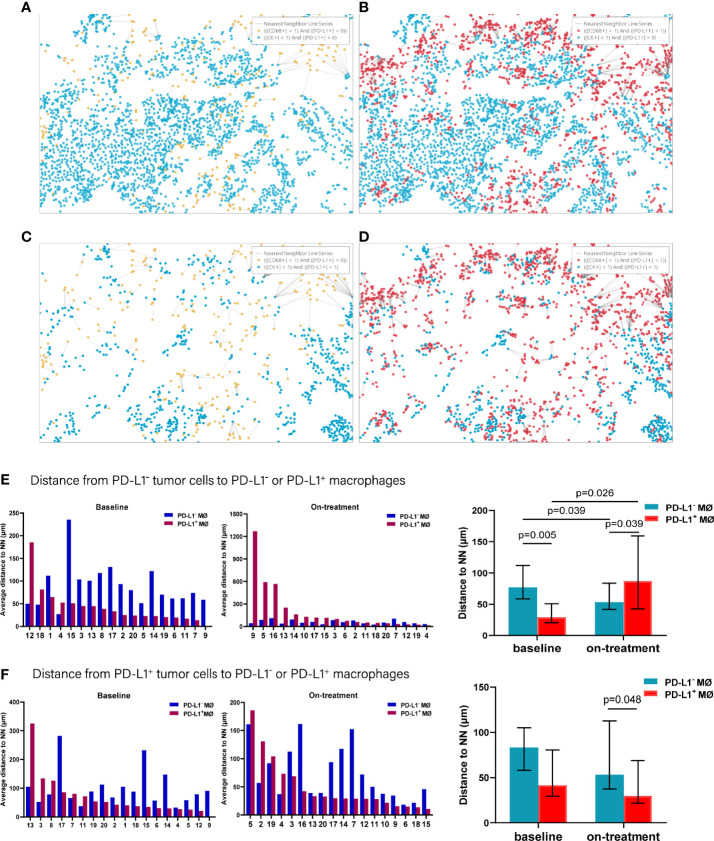
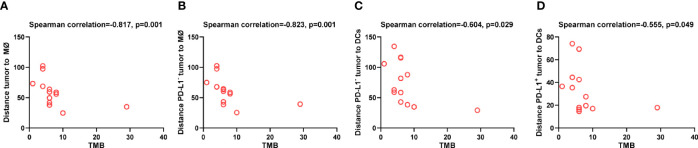
Methods: We performed multiplexed immunofluorescence method to identify CD11c+ DCs, CD68+ macrophages, and their PD-L1- or PD-L1+ subpopulations in paired tumor biopsies (n = 36) collected at baseline and during the combination treatment (after radiation, 40 Gy) from the phase Ib trial (NCT03671265). We applied whole exome sequencing in the baseline tumor biopsies (n = 14) to estimate tumor mutation burden (TMB). We dynamically investigated the spatial distribution of DCs and macrophages under chemoradiotherapy combined with PD-1 blockade, and evaluated the association between their spatial distribution and combination outcome, and TMB.

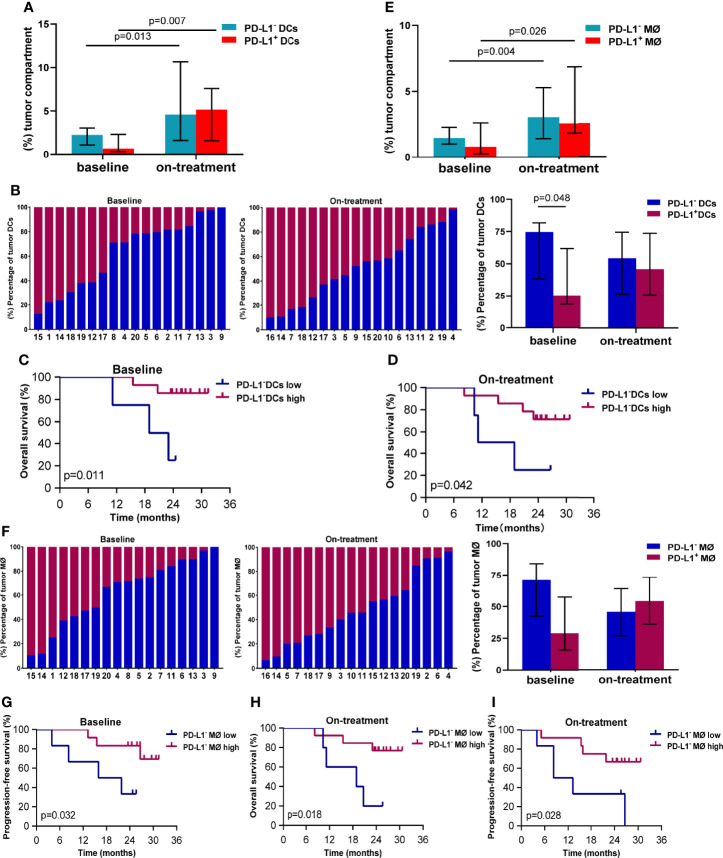
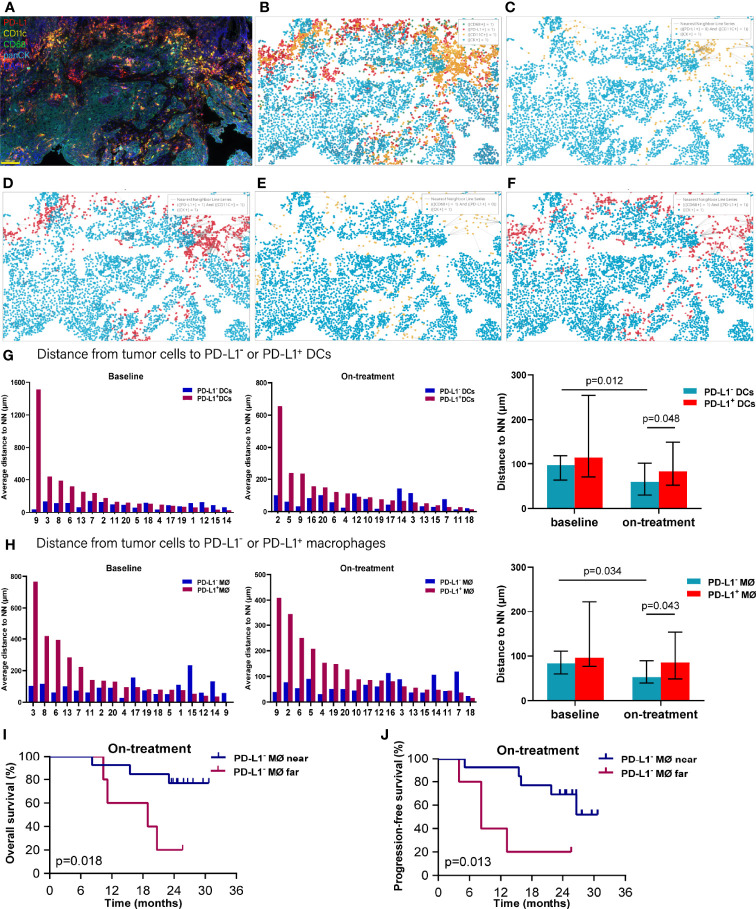
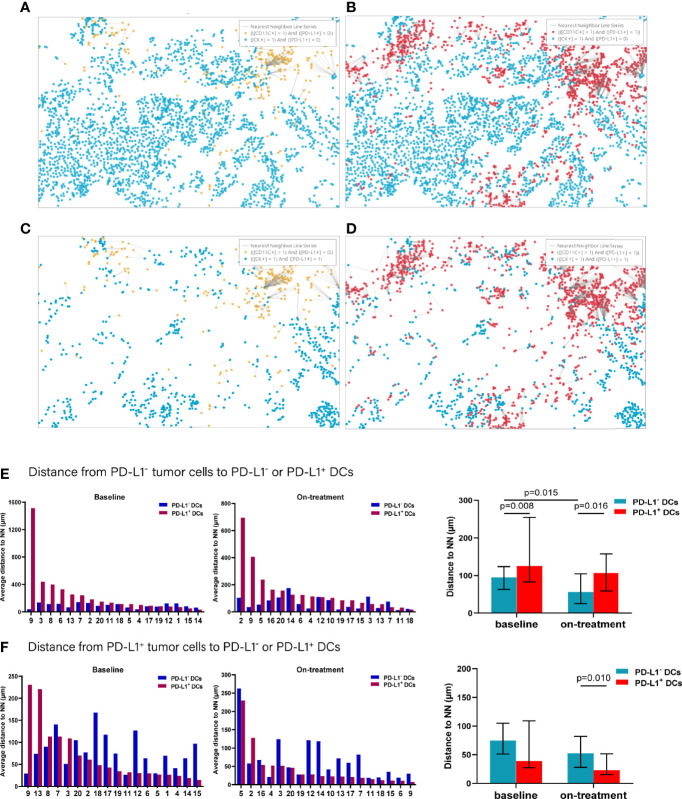
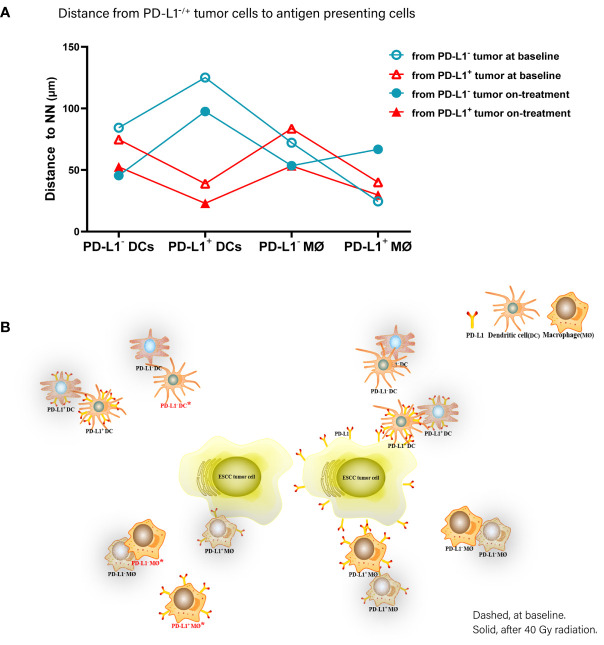
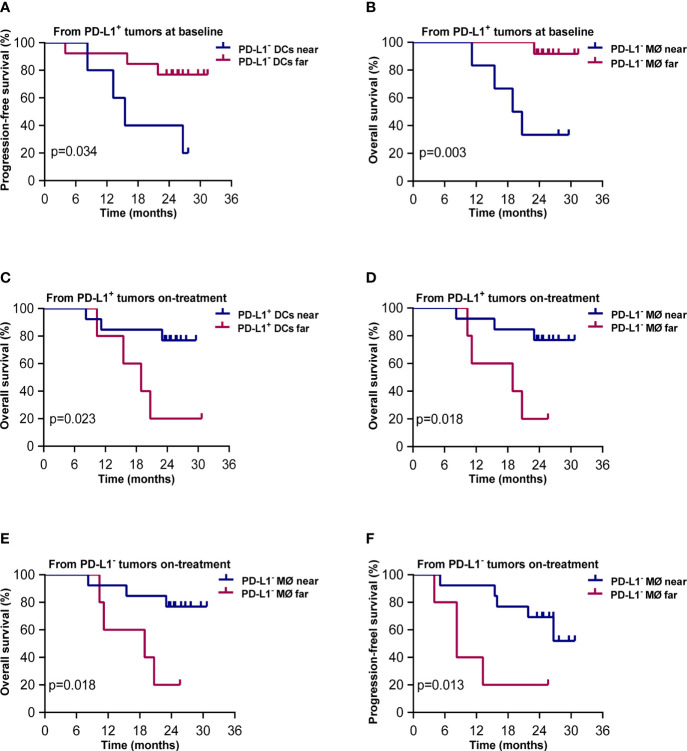
Results: The results showed that high percentages of PD-L1- DCs and macrophages in the baseline tumor compartment, but not in the stromal compartment, predicted improved OS and PFS. Chemoradiotherapy combined with PD-1 blockade promoted DCs and macrophages to migrate closer to tumor cells. During combination treatment, PD-L1- tumor cells were nearest to PD-L1- DCs and macrophages, while PD-L1+ tumor cells were next to PD-L1+ DCs and macrophages. High TMB was closely associated with a shorter distance from tumor cells to DCs and macrophages. Shorter distance between PD-L1+ tumor cells and PD-L1+ DCs or PD-L1- macrophages during the combination was correlated with better OS. Shorter distance between PD-L1- tumor cells and PD-L1- macrophages during combination was associated with both longer OS and PFS.

Conclusions: PD-L1- or PD-L1+ DCs and macrophages exhibit distinct spatial distribution in ESCC. The close distance between tumor cells and these antigen-presenting cells (APCs) is critical to the clinical outcome in chemoradiotherapy combined with PD-1 blockade in ESCC patients. Our results highlight the predictive potential of spatial patterns of APCs in chemoradiotherapy combined with immunotherapy and reveal the underlying mechanism of APCs participating in chemoradiotherapy-induced antitumor immune response in ESCC.

Keywords: PD-1; chemoradiotherapy; dendritic cell; esophageal cancer; immunofluorescence; macrophage; spatial; tumor mutation burden.


Conflict of interest statement

The authors declare that the research was conducted in the absence of any commercial or financial relationships that could be construed as a potential conflict of interest.

Figures

Figure 1
Figure 1
Proportion of dendritic cells and macrophages in the tumor compartment associated with improved survival. Hematoxylin and eosin staining (A) and multiplex immunofluorescence staining (B) for dendritic cells and macrophages in a tissue section (case n = 14, before treatment). (B) Right, Enlarged area of the yellow frame in left. (D–G) Spatial analysis procedure (case n = 6, before treatment). Kaplan–Meier curves showing overall or progression-free survival of ESCC patients based on the proportion of dendritic cells or macrophages in (H, I) the baseline tumor compartment and (J) on-treatment stromal compartment. Cutoff value: (H) 2.987%; (I) 1.623%; (J) 22.362%. On-treatment, after 40 Gy radiation. p ≤ 0.05, statistically significant.
Figure 2
Figure 2
PD-L1- dendritic cells and macrophages in the tumor compartment associated with better survival. (A) Proportion of PD-L1- and PD-L1+ dendritic cells in the tumor compartment. (B) Ratio between PD-L1- and PD-L1+ dendritic cells in the tumor compartment. (C, D) Kaplan–Meier curves showing overall survival based on PD-L1- dendritic cells in the tumor compartment (C) at baseline (D) and during treatment. (E) Proportion of PD-L1- and PD-L1+ macrophages in the tumor compartment. (F) Ratio between PD-L1- and PD-L1+ macrophages in the tumor compartment. (G, I) Kaplan–Meier curves showing overall or progression-free survival based on PD-L1- macrophages in the tumor compartment (G) at baseline and (H, I) during treatment. The tumors are ordered by the percentage of PD-L1+ dendritic cells or macrophages, from highest to lowest. Cutoff value: (C) ≥1.058%; (D) ≥1.469%; (G) 1.214%; (H) 1.713%; (I) 2.328%. On-treatment, after 40 Gy radiation. p ≤ 0.05, statistically significant.
Figure 3
Figure 3
Distance from tumor cells to the nearest dendritic cells and macrophages. (A) Representative multiplex multi-immunofluorescence image (case N14, before treatment) showing staining for CD11 (yellow), CD68 (green), PD-L1 (red), and CK (cyan). (B) Cellular phenotype map of image shown in A depicting the locations of CK+ tumor cells (cyan dots), PD-L1+ (red dots), CD11c+ dendritic cells (orange dots), and CD68+ macrophages (green dots). (C) Ray plot depicting the distance from each CK+ tumor cell to the nearest PD-L- dendritic cells. (D) Ray plot depicting the distance from each CK+ tumor cell to the nearest PD-L+ dendritic cells. (E) Ray plot depicting the distance from each CK+ tumor cell to the nearest PD-L- macrophages. (F) Ray plot depicting the distance from each CK+ tumor cell to the nearest PD-L+ macrophages. (G, H) Distances from tumor cells to the nearest PD-L1- and PD-L1+ dendritic cells (G) and macrophages (H) for all patients with available tumors at baseline and during treatment. (I, J) Kaplan–Meier curves showing overall survival (I) and progression-free survival (J) based on distance from tumor cells to the nearest PD-L1- macrophages during treatment. The tumors are ordered by the percentage of PD-L1+ dendritic cells or macrophages, from highest to lowest. Cutoff: (I) 83.454 μm; (J) 83.454 μm. On-treatment, after 40 Gy radiation. p ≤ 0.05, statistically significant.
Figure 4
Figure 4
Distance from PD-L1- or PD-L1+ tumor cells to the nearest PD-L1- or PD-L1+ dendritic cells. (A–D) Spatial analysis shown in Figure 3A . (A) Ray plot depicting the distance from each CK+PD-L1- tumor cell to the nearest PD-L- dendritic cell. (B) Ray plot depicting the distance from each CK+PD-L1- tumor cell to the nearest PD-L1- dendritic cells. (C) Ray plot depicting the distance from each CK+PD-L1+ tumor cell to the nearest PD-L- dendritic cell. (D) Ray plot depicting the distance from each CK+PD-L1+ tumor cell to the nearest PD-L+ dendritic cells. (E) Distances from PD-L1- tumor cells to the nearest PD-L1- or PD-L1+ dendritic cells at baseline and during treatment. (F) Distances from PD-L1+ tumor cells to the nearest PD-L1- or PD-L1+ dendritic cells at baseline and during treatment. The tumors are ordered by the percentage of PD-L1+ dendritic cells, from highest to lowest. On-treatment, after 40 Gy radiation. p ≤ 0.05, statistically significant.
Figure 5
Figure 5
Distance from PD-L1- or PD-L1+ tumor cells to the nearest PD-L1- or PD-L1+ macrophages. (A–D) Spatial analysis shown in Figure 3 . (A) Ray plot depicting the distance from each CK+PD-L1- tumor cell to the nearest PD-L1- macrophages. (B) Ray plot depicting the distance from each CK+PD-L1- tumor cell to the nearest PD-L1+ macrophages. (C) Ray plot depicting the distance from each CK+PD-L1+ tumor cell to the nearest PD-L- macrophages. (D) Ray plot depicting the distance from each CK+PD-L1+ tumor cell to the nearest PD-L1+ macrophages. (E) Distances from PD-L1- tumor cells to the nearest PD-L1- or PD-L1+ macrophages at baseline and during treatment. (F) Distances from PD-L1+ tumor cells to the nearest PD-L1- or PD-L1+ macrophages at baseline and during treatment. The tumors are ordered by the percentage of PD-L1+ macrophages, from highest to lowest. On-treatment, after 40 Gy radiation. p ≤ 0.05, statistically significant.
Figure 6
Figure 6
Spatial distribution pattern dendritic cells and macrophages in ESCC patients under chemoradiotherapy combined with PD-1 blockade. (A) Dynamic alteration of distance from PD-L1- or PD-L1+ tumor cells to the nearest PD-L1- or PD-L1+ dendritic cells and macrophages in ESCC patients under combination treatment. (B) Model of dynamic spatial distribution of dendritic cells and macrophages in ESCC under treatment. Dashed, at baseline. Solid, after 40 Gy radiation. *, statistical significance of baseline distance from tumor cells to dendritic cells and macrophages compared with on-treatment.
Figure 7
Figure 7
Spatial distribution of dendritic cell and macrophage subsets associated with survival. Kaplan–Meier curves showing overall and progression-free survival based on distance from (A) PD-L1+ tumor cells to the nearest PD-L1- dendritic cells at baseline; (B) PD-L1+ tumor cells to PD-L1- macrophages at baseline; (C) PD-L1+ tumor cells to the nearest PD-L1+ dendritic cells during treatment; (D) PD-L1+ tumor cells to the nearest PD-L1- macrophages during treatment; (E) PD-L1- tumor cells to the nearest PD-L1- macrophages during treatment; (F) PD-L1- tumor cells to the nearest PD-L1- macrophages during treatment. Cutoff value: (A) 57.694 μm; (B) 66.762 μm; (C) 49.136 μm; (D) 103.159 μm; (E) 81.396 μm; (F) 81.396 μm. On-treatment, after 40 Gy radiation. p ≤ 0.05, statistically significant.
Figure 8
Figure 8
Spatial distribution of dendritic cells and macrophages associated with tumor mutation burden. Spearman correlation analysis between tumor mutation burden and distance from (A) tumor cells to the nearest macrophages; (B) PD-L1- tumor cells to the nearest macrophages; (C) PD-L1- tumor cells to the nearest dendritic cells; (D) PD-L1+ tumor to the nearest dendritic cells. p ≤ 0.05, statistically significant.

References

    1. Fukushima H, Yoshida S, Kijima T, Nakamura Y, Fukuda S, Uehara S, et al. . Combination of Cisplatin and Irradiation Induces Immunogenic Cell Death and Potentiates Postirradiation Anti-PD-1 Treatment Efficacy in Urothelial Carcinoma. Int J Mol Sci (2021) 22(2):535. doi: 10.3390/ijms22020535 - DOI - PMC - PubMed
    1. Powell SF, Gold KA, Gitau MM, Sumey CJ, Lohr MM, McGraw SC, et al. . Safety and Efficacy of Pembrolizumab With Chemoradiotherapy in Locally Advanced Head and Neck Squamous Cell Carcinoma: A Phase IB Study. J Clin Oncol (2020) 38(21):2427–37. doi: 10.1200/JCO.19.03156 - DOI - PMC - PubMed
    1. Jabbour SK, Berman AT, Decker RH, Lin Y, Feigenberg SJ, Gettinger SN, et al. . Phase 1 Trial of Pembrolizumab Administered Concurrently With Chemoradiotherapy for Locally Advanced Non-Small Cell Lung Cancer: A Nonrandomized Controlled Trial. JAMA Oncol (2020) 6(6):848–55. doi: 10.1001/jamaoncol.2019.6731 - DOI - PMC - PubMed
    1. Zhang W, Yan C, Zhang T, Chen X, Dong J, Zhao J, et al. . Addition of Camrelizumab to Docetaxel, Cisplatin, and Radiation Therapy in Patients With Locally Advanced Esophageal Squamous Cell Carcinoma: A Phase 1b Study. OncoImmunology (2021) 10(1):1971418. doi: 10.1080/2162402X.2021.1971418 - DOI - PMC - PubMed
    1. Qian D, Wang Y, Zhao G, Cao F, Er P, Chen X, et al. . Tumor Remission and Tumor-Infiltrating Lymphocytes During Chemoradiation Therapy: Predictive and Prognostic Markers in Locally Advanced Esophageal Squamous Cell Carcinoma. Int J Radiat Oncol Biol Phys (2019) 105(2):319–28. doi: 10.1016/j.ijrobp.2019.06.079 - DOI - PubMed

Publication types

MeSH terms

Substances

Associated data