. 2022 Jan 3:12:615253.
doi: 10.3389/fpls.2021.615253. eCollection 2021.

Effectiveness of Light-Quality and Dark-White Growth Light Shifts in Short-Term Light Acclimation of Photosynthesis in Arabidopsis

Affiliations

Effectiveness of Light-Quality and Dark-White Growth Light Shifts in Short-Term Light Acclimation of Photosynthesis in Arabidopsis

Elisabeth Hommel et al. Front Plant Sci. .

Abstract

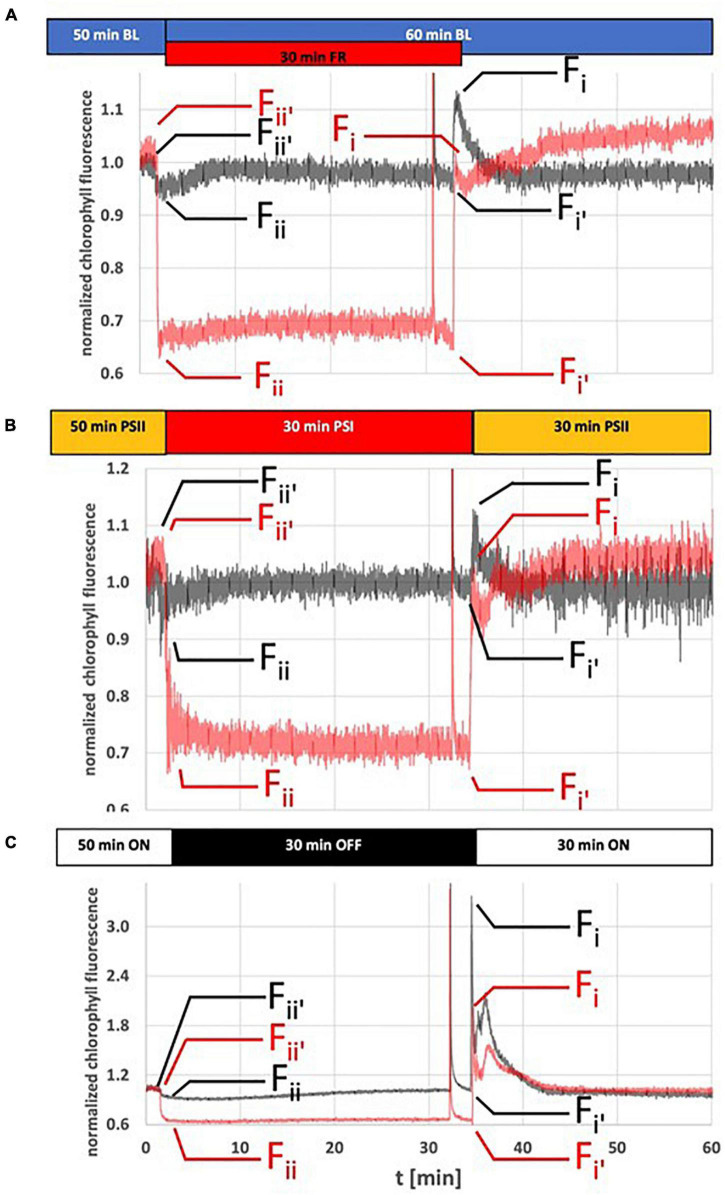
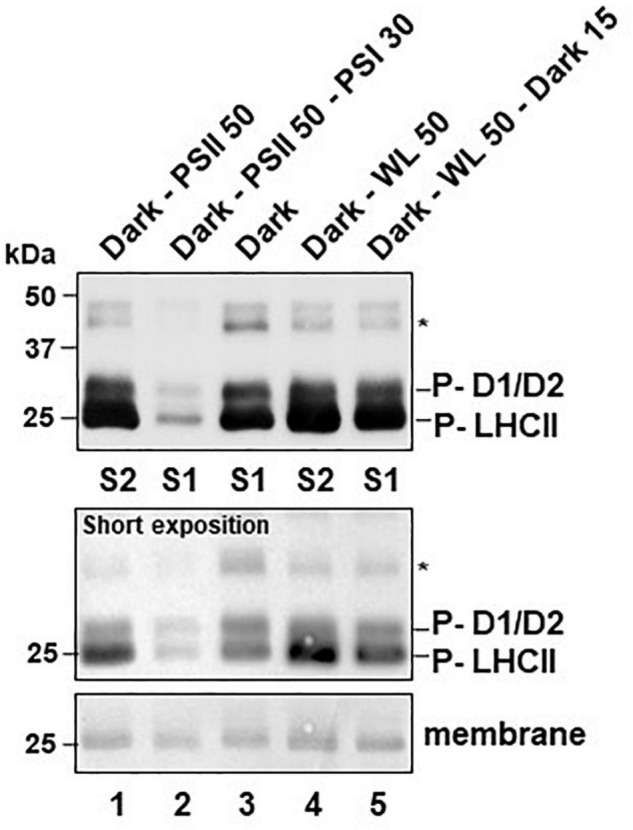
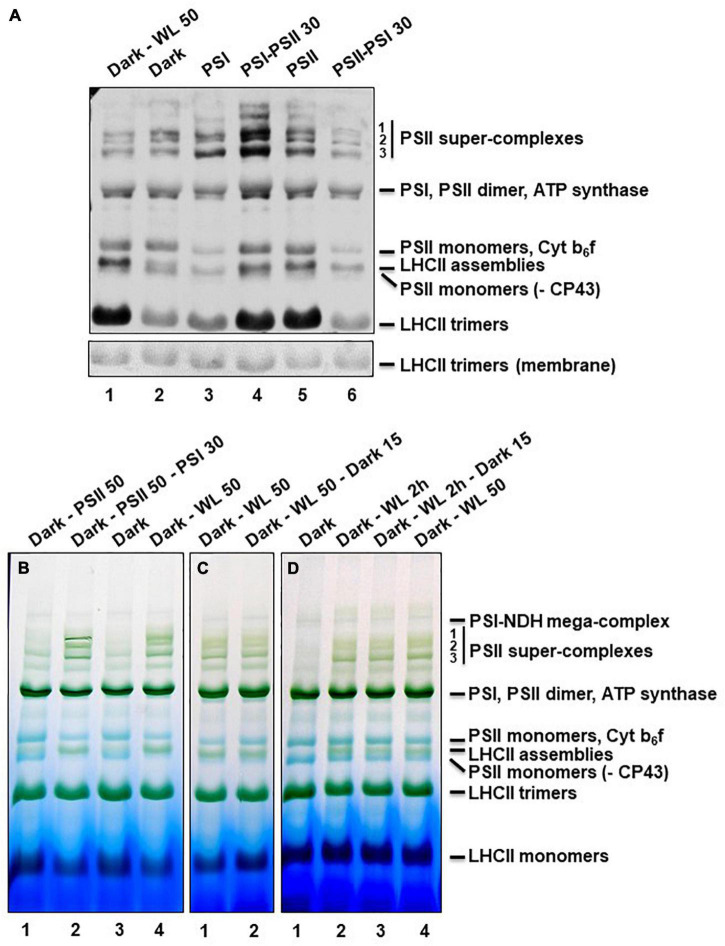
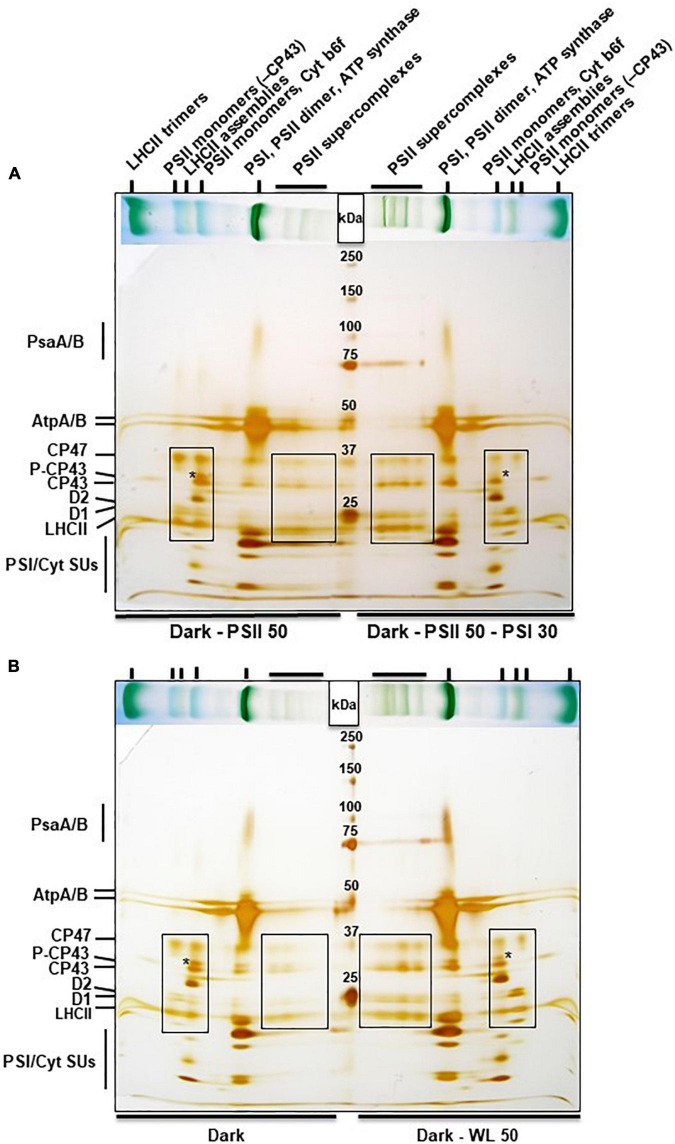
Photosynthesis needs to run efficiently under permanently changing illumination. To achieve this, highly dynamic acclimation processes optimize photosynthetic performance under a variety of rapidly changing light conditions. Such acclimation responses are acting by a complex interplay of reversible molecular changes in the photosynthetic antenna or photosystem assemblies which dissipate excess energy and balance uneven excitation between the two photosystems. This includes a number of non-photochemical quenching processes including state transitions and photosystem II remodeling. In the laboratory such processes are typically studied by selective illumination set-ups. Two set-ups known to be effective in a highly similar manner are (i) light quality shifts (inducing a preferential excitation of one photosystem over the other) or (ii) dark-light shifts (inducing a general off-on switch of the light harvesting machinery). Both set-ups result in similar effects on the plastoquinone redox state, but their equivalence in induction of photosynthetic acclimation responses remained still open. Here, we present a comparative study in which dark-light and light-quality shifts were applied to samples of the same growth batches of plants. Both illumination set-ups caused comparable effects on the phosphorylation of LHCII complexes and, hence, on the performance of state transitions, but generated different effects on the degree of state transitions and the formation of PSII super-complexes. The two light set-ups, thus, are not fully equivalent in their physiological effectiveness potentially leading to different conclusions in mechanistic models of photosynthetic acclimation. Studies on the regulation of photosynthetic light acclimation, therefore, requires to regard the respective illumination test set-up as a critical parameter that needs to be considered in the discussion of mechanistic and regulatory aspects in this subject.

Keywords: dark-light shifts; light-quality control; photosynthesis; photosystem II super-complexes; state transitions.


Conflict of interest statement

The authors declare that the research was conducted in the absence of any commercial or financial relationships that could be construed as a potential conflict of interest.

Figures

FIGURE 1
FIGURE 1
Dynamics of Chl fluorescence changes in response to light quality or dark-light shifts. Arabidopsis WT plants (gray traces) and stn7 mutants (red traces) were grown for 14 days under LD conditions and then used for Chl fluorescence measurements using a pulse amplitude modulated fluorometer. (A) Reference measurement using internal LED based light sources of the measurement device for induction of state transitions. (B) Chl fluorescence changes caused by shifts between the PSI- and PSII-light sources at equal PAR. (C) Chl fluorescence changes caused by dark-white light shifts. Duration of and shifts in illumination are indicated by horizontal bars on top of the fluorescence traces. All experiments started with a 60 min dark-adaptation followed by the light regime indicated in the figure. A saturation light pulse was given 2 min before a change in light condition. Only the pulse in state 1 is visible at this magnification of the figure. Fii′, Fii, Fi′, and Fi values were taken at indicated time point (small arrows) in order to calculate Fr according to the protocol by Haldrup et al. (2001). Chl fluorescence is given as normalized values. The figure depicts representative results. Each experiment was repeated at least three times with three different biological samples. For understanding of Chl fluorescence nomenclature compare legend of Table 2. Full data sets for all graphs including a full representation of saturation light pulses are available in Supplementary Figure S2.
FIGURE 2
FIGURE 2
Effects of light-quality or dark-white light shifts on phosphorylation state of thylakoid membrane proteins. Isolated thylakoid protein samples corresponding to 20 μg total chlorophyll were separated by SDS-PAGE. For detection of phosphorylation state proteins were transferred to a nitrocellulose membrane via western blot and immuno-decorated using an anti-phospho-threonine antiserum (Cell Signaling Technologies). Labeling was done according to published work (Fristedt et al., 2009; Samol et al., 2012). This phospho-immuno-detection was done once to confirm the state transition results from the Chl fluorescence data and produced results that are in full accordance to earlier studies. A comprehensive statistical treatment of data including triplicate independent biological repetitions, therefore, was regarded as negligible. Relative changes in signal intensities can be sufficiently estimated by comparison to the loading controls given by the respective amido-black stained membranes at the migration front of LHCII trimers (membrane). Additional loading controls are given in Supplementary Figure S3. Sizes of marker proteins are given in the left margins in kDa. Signals from phosphorylated CP43 (labeled by asterisk) and another unidentified protein were very weak requiring long exposition times to be visualized. Signals from phosphorylated D1, D2 and LHCII (P-D1/D2, P-LHCII) were reaching saturation under such conditions and a second short exposition time of the same membrane is given (short exposition) as control. All plants were grown for 2 weeks under LD conditions and treated as indicated before sampling. Dark-PSII 50: 50 min PSII-light after dark. Dark-PSII 50–PSI 30: 50 min PSII-light after dark followed by 30 min of PSI-light. Dark: Control at the end of the last dark period. Dark-WL 50: 50 min WL after dark. Dark-WL 50 - Dark 15: 50 min WL after dark followed by 15 min dark. The respective state induced by the illumination program is indicated at the bottom (S1: state 1; S2: state 2).
FIGURE 3
FIGURE 3
Phosphorylation and assembly states of thylakoid membrane protein complexes after BN-PAGE. (A) Thylakoid protein samples corresponding to 20 μg total chlorophyll were separated by BN-PAGE. Material for the first two wells was isolated from plants grown under LD conditions for 2 weeks. Dark-WL 50: 50 min illumination with WL after dark period. Dark: Sample harvested at the end of the night period. All other plants were grown for 5 days under LD conditions, afterward shifted for 3 days to continuous white light and subsequently grown for 6 days under the light-quality regimes indicated on top (matching in total 2 weeks of growth). These samples served as control allowing for comparison with results published earlier (Dietzel et al., 2011). PSI: 6 days PSI-light; PSI-PSII 30: 6 days PSI-light followed by 30 min PSII-light; PSII: 6 days PSII-light; PSII-PSI 30: 6 days PSII-light followed by 30 min PSI-light. The protein complexes separated by the BN-PAGE were denatured in gel by incubation in Laemmli buffer and transferred to a nitrocellulose membrane via western blot. Phosphorylation state of thylakoid membrane proteins was detected by incubation with anti-phospho-threonine antibodies. The amido-black stained membrane at the height of LHCII trimers is shown as loading control. Bands were labeled as described (Järvi et al., 2011). The experiment was repeated three times with results showing only marginal variations, thus one representative result is given. Note that the phosphorylation states of the free LHCII trimers correspond well to those shown in Figure 2. (B–D) Thylakoid protein samples corresponding to 30 μg total chlorophyll were separated by BN-PAGE. Material separated on the same gel always was isolated from the same growth batch of plants that were all grown under LD conditions for 2 weeks prior to the different short-term illumination treatments indicated on top of each well. Dark samples were harvested at the end of the night period and served as control. All material was harvested directly under the respective light source. (B) Dark - PSII 50: 50 min PSII-light after dark; Dark - PSII 50 - PSI 30: 50 min PSII- light after dark followed by 30 min PSI-light; Dark: control at end of dark period; Dark - WL 50: 50 min WL after dark (same in panels (B) and (C)). (C) Dark - WL 50 - dark 15: 50 min WL after dark followed by a 15 min shift into dark. (D) Dark - WL 2 h: 2 h WL after dark; Dark - WL 2 h - dark 15: 2 h WL after dark followed by a 15 min shift into dark. Panels (B–D) are from individual gels each and display representative results. Each experiment was done at least three times. Bands were labeled (right margin) as described (Dietzel et al., 2011; Järvi et al., 2011). As common control Dark - WL 50 was included in all gels.
FIGURE 4
FIGURE 4
2D BN-PAGE of thylakoid membrane proteins from A. thaliana subjected to light quality or dark light shifts. Stripes from BN-PAGE (placed horizontally on top of gels, compare Figure 3) were cut out, denatured in Laemmli buffer and run on a SDS-PAGE as second dimension with a head-to-head orientation. Marker proteins (sizes are given in kDa) were loaded in between. The gels were stained with silver. (A) Dark - PSII 50: 50 min PSII-light after dark period; Dark - PSII 50 - PSI 30: 50 min PSII-light after dark period followed by a shift for 30 min to PSI-light. (B) Dark: Material harvested at the end of the night phase; Dark - WL 50: 50 min WL illumination after dark phase. Labeling of bands in the BN-PAGE given on top of panel (A) is also valid for panel (B), corresponding bands are marked by vertical small lines. Individual protein bands in the second dimension are given in the left margins. Asterisks mark the position of phosphorylated CP43 (right or left from the asterisk, respectively). Broad boxed areas indicate subunits of PSII super-complexes, small boxed areas indicate subunits of PSII monomers. Experiments have been performed three times with results showing only minor variations. Continuous protein bands at 75 kDa in the right half of the gels are leakages from the protein marker.
FIGURE 5
FIGURE 5
Model depicting effects of light-quality or dark-white light shifts on assembly and phosphorylation states of thylakoid membrane proteins. The simplified scheme integrates the central biochemical data from Figures 2–4 and Supplementary Table S1. Symbol representations are defined at the bottom of the scheme. The number of protein complexes and of phosphoryl-groups per protein complex indicates relative accumulation and degree of phosphorylation between the four different conditions. Dark: Low accumulation of PSII super-complexes, moderate phosphorylation state of PSII-bound LHCII and free LCHII trimers, PSII monomers with strongly phosphorylated CP43. PSII-light – State 2: Low accumulation of PSII super-complexes, PSII monomers with strongly phosphorylated CP43, high phosphorylation state of LHCII trimers. WL: High accumulation of PSII super-complexes (mostly C2S1 and C2S2), PSII monomers with low to moderately phosphorylated CP43, very high phosphorylation of LHCII trimers. PSI-light – State 1: Very high accumulation of PSII super-complexes (including C2S2M2 to C2S1), low phosphorylation state of PSII-bound and free LHCII trimers and of PSII dimers. PSII monomers with largely dephosphorylated CP43. For functional implications of the different assembly and phosphorylation states, see “Discussion” section.

References

    1. Allen J. F. (1992). Protein phosphorylation in regulation of photosynthesis. Biochim. Biophys. Acta 1098 275–335. - PubMed
    1. Allen J. F., Forsberg J. (2001). Molecular recognition in thylakoid structure and function. Trends Plant Sci. 6 317–326. 10.1016/s1360-1385(01)02010-6 - DOI - PubMed
    1. Allen J. F., Pfannschmidt T. (2000). Balancing the two photosystems: photosynthetic electron transfer governs transcription of reaction centre genes in chloroplasts. Philos. Trans. R. Soc. London B Biol. Sci. 355 1351–1357. 10.1098/rstb.2000.0697 - DOI - PMC - PubMed
    1. Aro E. M., Suorsa M., Rokka A., Allahverdiyeva Y., Paakkarinen V., Saleem A., et al. (2005). Dynamics of photosystem II: a proteomic approach to thylakoid protein complexes. J. Exp. Bot. 56 347–356. 10.1093/jxb/eri041 - DOI - PubMed
    1. Bellafiore S., Barneche F., Peltier G., Rochaix J. D. (2005). State transitions and light adaptation require chloroplast thylakoid protein kinase STN7. Nature 433 892–895. 10.1038/nature03286 - DOI - PubMed

LinkOut - more resources