. 2021 Aug 20;2(4):100050.
doi: 10.1016/j.xhgg.2021.100050. eCollection 2021 Oct 14.

Genetic ancestry and ethnic identity in Ecuador

Affiliations

Genetic ancestry and ethnic identity in Ecuador

Shashwat Deepali Nagar et al. HGG Adv. .

Abstract

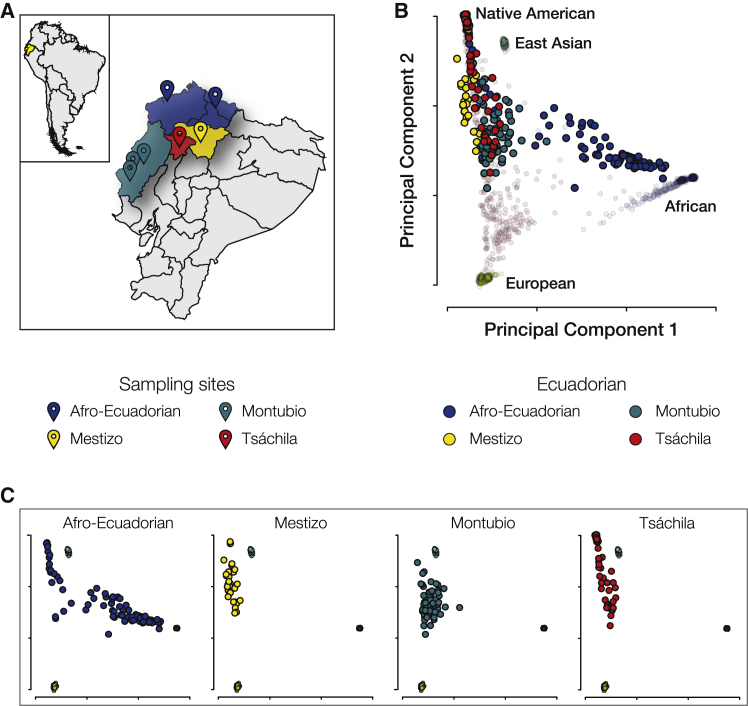
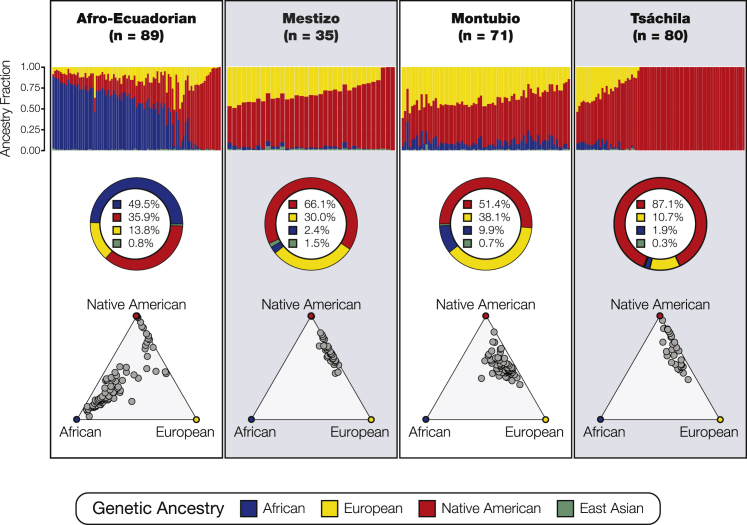
We investigated the ancestral origins of four Ecuadorian ethnic groups-Afro-Ecuadorian, Mestizo, Montubio, and the Indigenous Tsáchila-in an effort to gain insight on the relationship between ancestry, culture, and the formation of ethnic identities in Latin America. The observed patterns of genetic ancestry are largely concordant with ethnic identities and historical records of conquest and colonization in Ecuador. Nevertheless, a number of exceptional findings highlight the complex relationship between genetic ancestry and ethnicity in Ecuador. Afro-Ecuadorians show far less African ancestry, and the highest levels of Native American ancestry, seen for any Afro-descendant population in the Americas. Mestizos in Ecuador show high levels of Native American ancestry, with substantially less European ancestry, despite the relatively low Indigenous population in the country. The recently recognized Montubio ethnic group is highly admixed, with substantial contributions from all three continental ancestries. The Tsáchila show two distinct ancestry subgroups, with most individuals showing almost exclusively Native American ancestry and a smaller group showing a Mestizo characteristic pattern. Considered together with historical data and sociological studies, our results indicate the extent to which ancestry and culture interact, often in unexpected ways, to shape ethnic identity in Ecuador.

Keywords: Afro-Ecuadorian; Ecuador; Indigenous; Latin America; Mestizo; Montubio; ethnicity; genetic ancestry; genomics; population genetics.


Conflict of interest statement

The authors declare no competing interests.

Figures

Figure 1
Figure 1
Continental genetic ancestry for Ecuadorian ethnic groups (A) Locations of sampling sites for the four Ecuadorian ethnic groups characterized here: Afro-Ecuadorian (blue), Mestizo (yellow), Montubio (teal), and Tsáchila (red). (B) Principal component analysis (PCA) of the genomic relationship matrix for the four Ecuadorian populations compared to reference populations from Africa, the Americas, East Asia, and Europe. (C) PCA results shown separately for each of the four Ecuadorian ethnic groups.
Figure 2
Figure 2
Continental ancestry and admixture for Ecuadorian ethnic groups Top row: ADMIXTURE plots showing continental ancestry fractions for individuals from the four Ecuadorian ethnic groups. Each bar in the plot represents an individual sample, and individuals’ ancestry components are shown as African (blue), East Asian (green), European (yellow), and Native American (red). Middle row: average ancestry percentages for each ethnic group. Bottom row: ternary plots highlighting the distribution of different proportions of the three main ancestry components—African, European, and Native American—in each Ecuadorian group.
Figure 3
Figure 3
Timing and sex-biased admixture for Ecuadorian ethnic groups Estimated admixture timings and sex-biased ancestry proportions are shown for each of the three ancestral groups: African (blue), European (yellow), and Native American (red). Admixture timing estimates are shown for (A) Afro-Ecuadorians, (B) Montubios, and (C) Mestizos. On the top panels, the observed (points) and predicted (solid line) ancestry tract size distributions are shown with shaded 95% confidence intervals. LL indicates the log-likelihood values for the models. On the bottom panels, admixture event timings are shown together with ancestry proportions. Each inferred admixture event is indicated by a circle, which is scaled according to the size of the contribution to the population and also shows the relative ancestry proportions. The y-axes of the charts show the inferred continental ancestry fractions, and the x-axes show time as the number of generations ago (GA). (D) Distributions of ΔAdmix values, which measure differences in ancestry between the X chromosome and the autosomes, are shown for all sampled individuals and each continental ancestry among the four ethnic groups. Values above zero indicate female-biased admixture, and values below zero indicate male-biased admixture.
Figure 4
Figure 4
African and European subcontinental ancestry origins for Ecuadorian ethnic groups Subcontinental ancestral origins are shown separately for (A) African and (B) European continental ancestry components. For each panel, Ecuadorian populations and other modern admixed American populations are compared to a specific panel of continental reference populations. Population groups are indicated to the left of each panel, and individual population labels are shown on the right. Each bar in the plot represents an individual sample, and individuals’ subcontinental ancestry components, based on the results of our NNLS analysis, are color-coded according to their group origins. RFHG, Rainforest Hunter Gatherer.
Figure 5
Figure 5
Native American subcontinental ancestry origins for Ecuadorian ethnic groups (A) Ecuadorian populations and other modern admixed American populations are compared to a specific panel of Native American reference populations. Population groups are indicated to the left of each panel, and individual population labels are shown on the right. Each bar in the plot represents an individual sample, and individuals’ subcontinental ancestry components are color-coded according to their group origins. (B) Phylogenetic tree showing the relationship between the Native American ancestry component of Ecuadorian populations, other admixed American populations, and Native American reference populations.

References

    1. Lauderbaugh G. ABC-CLIO; 2012. The History of Ecuador.
    1. Schwartz S.B. Colonial identities and the sociedad de castas. Colonial Lat. Am. Rev. 1995;4:185–201.
    1. Lewis L.A. In: Race and Blood in the Iberian World. Elena Martínez D.N.M., Hering Torres M.-S., editors. LIT Verlag; Münster, Germany: 2012. Between ›Casta‹ and ›Raza; p. 99.
    1. INEC . 2010. Población y Demografía de Ecuador.https://www.ecuadorencifras.gob.ec/censo-de-poblacion-y-vivienda/
    1. El Universo . 2011. Población del país es joven y mestiza, dice censo del INEC.https://www.eluniverso.com/2011/09/02/1/1356/poblacion-pais-joven-mestiz...

LinkOut - more resources