. 2021 Sep 17:2:725115.
doi: 10.3389/froh.2021.725115. eCollection 2021.

Oral Microbiome and Gingival Gene Expression of Inflammatory Biomolecules With Aging and Periodontitis

Affiliations

Oral Microbiome and Gingival Gene Expression of Inflammatory Biomolecules With Aging and Periodontitis

Jeffrey L Ebersole et al. Front Oral Health. .

Abstract

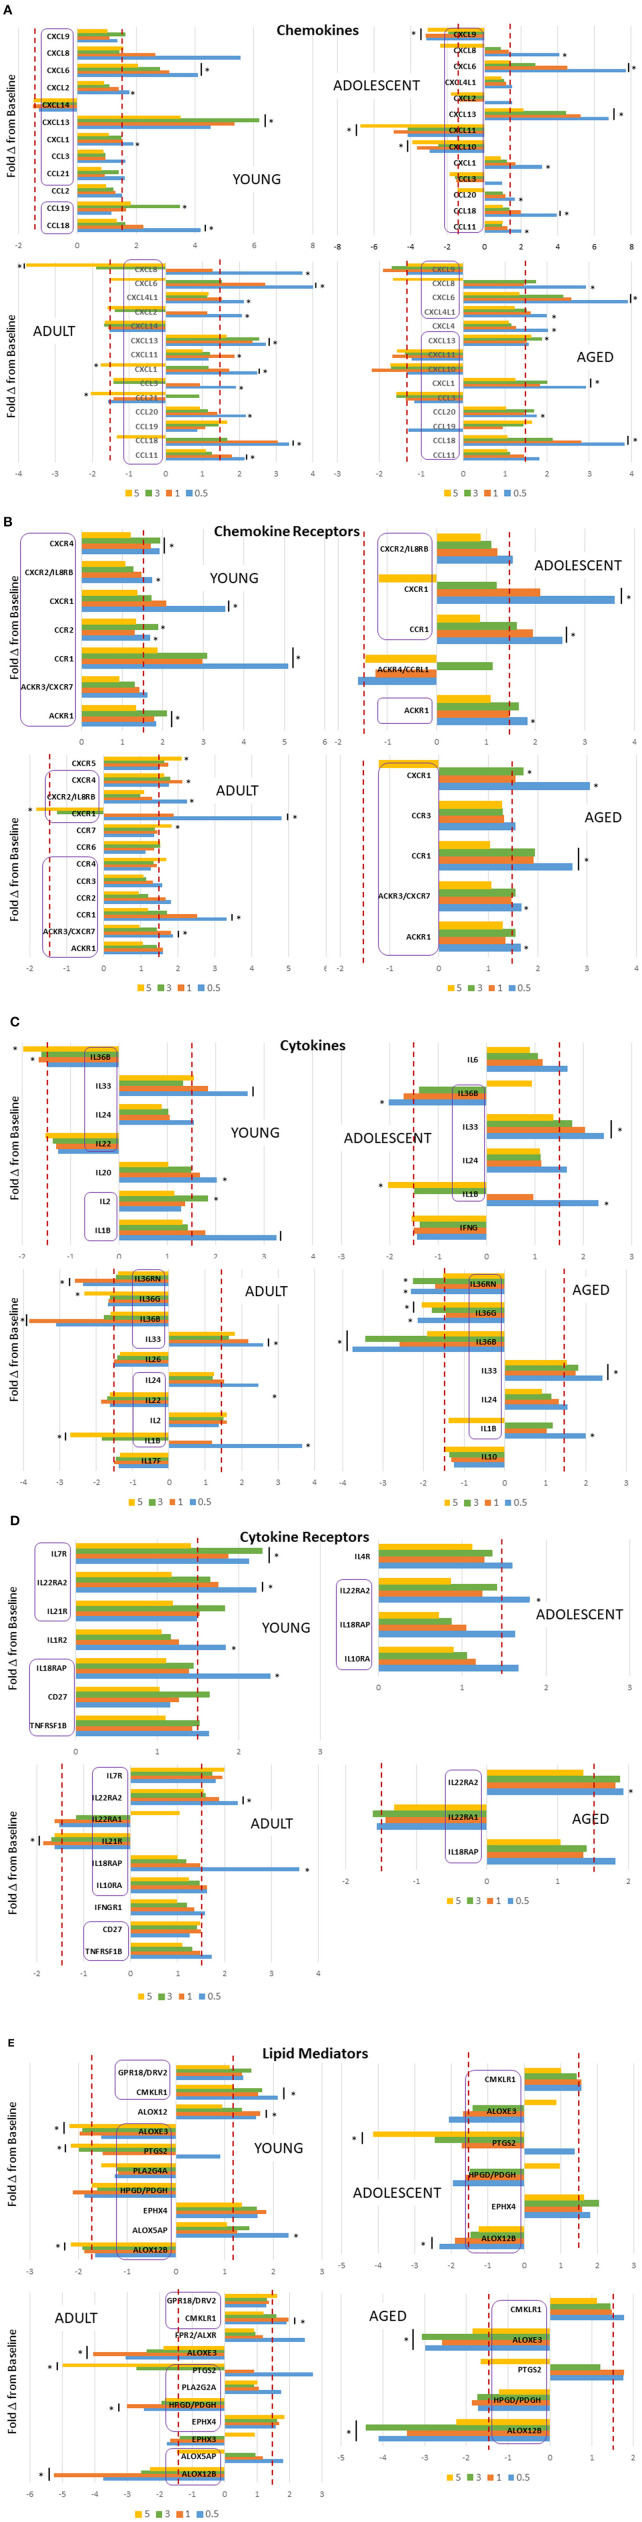
Although data describe the presence and increase of inflammatory mediators in the local environment in periodontitis vs. health in humans, details regarding how these responses evolve in the transition from health to disease, changes during disease progression, and features of a resolved lesion remain unknown. This study used a nonhuman primate model of ligature-induced periodontitis in young, adolescent, adult, and aged animals to document features of inflammatory response affected by age. Rhesus monkeys had ligatures tied and provided gingival tissue biopsy specimens at baseline, 0.5, 1, and 3 months of disease and at 5 months of the study, which was 2 months post-ligature removal for clinically resolved tissues. The transcriptome was assessed using microarrays for chemokine (n = 41), cytokine (n = 45), chemokine receptor (n = 21), cytokine receptor (n = 37), and lipid mediator (n = 31) genes. Limited differences were noted in healthy tissues for chemokine expression with age; however, chemokine receptor genes were decreased in young but elevated in aged samples. IL1A, IL36A, and IL36G cytokines were decreased in the younger groups, with IL36A elevated in aged animals. IL10RA/IL10RB cytokine receptors were altered with age. Striking variation in the lipid mediator genes in health was observed with nearly 60% of these genes altered with age. A specific repertoire of chemokine and chemokine receptor genes was affected by the disease process, predominated by changes during disease initiation. Cytokine/cytokine receptor genes were also elevated with disease initiation, albeit IL36B, IL36G, and IL36RN were all significantly decreased throughout disease and resolution. Significant changes were observed in similar lipid mediator genes with disease and resolution across the age groups. Examination of the microbiome links to the inflammatory genes demonstrated that specific microbes, including Fusobacterium, P. gingivalis, F. alocis, Pasteurellaceae, and Prevotella are most frequently significantly correlated. These correlations were generally positive in older animals and negative in younger specimens. Gene expression and microbiome patterns from baseline were distinctly different from disease and resolution. These results demonstrate patterns of inflammatory gene expression throughout the phases of the induction of a periodontal disease lesion. The patterns show a very different relationship to specific members of the oral microbiome in younger compared with older animals.

Keywords: aging; microbiome; non-human primate; periodontitis; transcriptome.


Conflict of interest statement

The authors declare that the research was conducted in the absence of any commercial or financial relationships that could be construed as a potential conflict of interest.

Figures

Figure 1
Figure 1
Comparison of normalized expression values for chemokine and chemokine receptor (A), cytokine and cytokine receptor (B), and lipid mediator (C) genes in healthy gingival tissues across the age groups. Depicted are those genes in each category with a significant difference among the groups based on adjusted ANOVA analysis (p < 0.05). The bars represent mean normalized expression values for each age group of nine animals. The bar and/or asterisk denote significant difference from the adult group levels.
Figure 2
Figure 2
Fold-changes in chemokine (A), chemokine receptor (B), cytokine (C), cytokine receptor (D), and lipid mediator (E) genes comparing disease time point, i.e., 0.5, 1, 3 months, and resolution, i.e., 5-month, samples to baseline levels in each age group (nine animals/group). Genes in each category are presented with differential expression of ≥1.5 above or below the baseline. The bars denote mean differential expression at each timepoint and the bars and/or asterisks denote significant difference at p < 0.05 (t test). The purple boxes highlight the genes that overlap in differential expression across the age groups.
Figure 3
Figure 3
Stacked bar charts display a relative abundance of microbial families within the oral microbiome samples from the young/adolescent (Y/ADO; n = 25 samples) and adult/aged (AD/AG; n = 46) groups. Abundance levels are grouped in high abundance families (TOP) and low abundance families (BOTTOM) with in the AD/AG samples.
Figure 4
Figure 4
Stacked bars denoted the frequency of genes for the five families of inflammatory mediator genes (CH, chemokines; CHR, chemokine receptors; CY, cytokines; CYR, cytokine receptors; LI, lipid mediators) that correlated significantly with a relative abundance of the individual microbiome components. Summary of results for both positive and negative correlations in healthy (A) or diseased (B) gingival samples from a pooled group of younger animals and in healthy (C) or diseased (D) gingival samples from a pooled group of older animals.
Figure 5
Figure 5
Graphical representation of dominant interactions between microbiome members and chemokine (A), chemokine receptor (B), cytokine (C), cytokine receptor (D), and lipid mediator (E) genes in the pooled younger (Y/ADO) and older (AD/AG) group of animals. Magenta lines denote positive correlations and blue denote negative correlations. The thickness of the connections to the nodes signifies the frequency of the interactions between two nodes.
Figure 6
Figure 6
Principal components analysis combining filtered gene expression (p < 0.05) and microbiome relative abundance levels in younger (Y/ADO) and older (AD/AG) animals. Each point denotes one specimen at the different time points (BL, health; 0.5, initiation; 1, early progression; 3, late progression; 5, resolution). The triangles signify the mean values for all the samples within the particular time point.

References

    1. Lamster IB, Asadourian L, Del Carmen T, Friedman PK. The aging mouth: differentiating normal aging from disease. Periodontol 2000. (2016) 72:96–107. 10.1111/prd.12131 - DOI - PubMed
    1. Curtis MA, Diaz PI, Van Dyke TE. The role of the microbiota in periodontal disease. Periodontol 2000. (2020) 83:14–25. 10.1111/prd.12296 - DOI - PubMed
    1. Jakubovics NS, Shi W. A new era for the oral microbiome. J Dent Res. (2020) 99:595–6. 10.1177/0022034520918536 - DOI - PubMed
    1. Baraniya D, Naginyte M, Chen T, Albandar JM, Chialastri SM, Devine DA, et al. . Modeling normal and dysbiotic subgingival microbiomes: effect of nutrients. J Dent Res. (2020) 99:695–702. 10.1177/0022034520902452 - DOI - PMC - PubMed
    1. Lamont RJ, Koo H, Hajishengallis G. The oral microbiota: dynamic communities and host interactions. Nat Rev Microbiol. (2018) 16:745–59. 10.1038/s41579-018-0089-x - DOI - PMC - PubMed