. 2022 Feb;21(2):e13554.
doi: 10.1111/acel.13554. Epub 2022 Jan 20.

Proper control of R-loop homeostasis is required for maintenance of gene expression and neuronal function during aging

Affiliations

Proper control of R-loop homeostasis is required for maintenance of gene expression and neuronal function during aging

Juan Jauregui-Lozano et al. Aging Cell. 2022 Feb.

Abstract

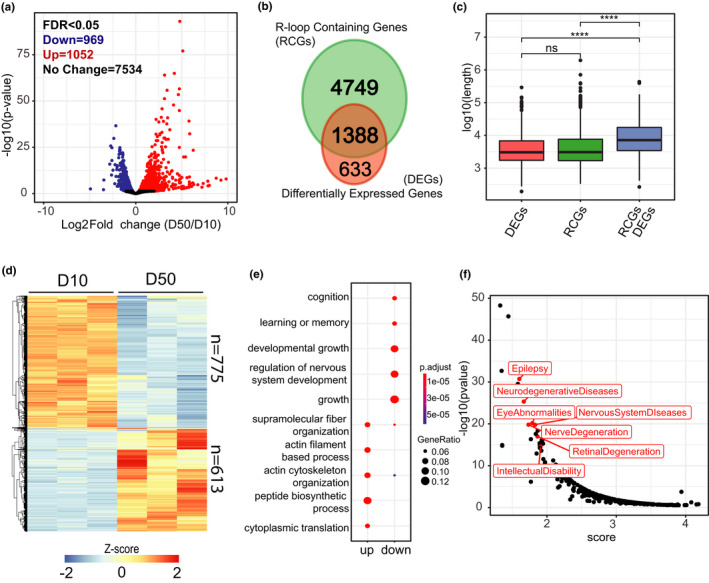
Age-related loss of cellular function and increased cell death are characteristic hallmarks of aging. While defects in gene expression and RNA metabolism have been linked with age-associated human neuropathies, it is not clear how the changes that occur in aging neurons contribute to loss of gene expression homeostasis. R-loops are RNA-DNA hybrids that typically form co-transcriptionally via annealing of the nascent RNA to the template DNA strand, displacing the non-template DNA strand. Dysregulation of R-loop homeostasis has been associated with both transcriptional impairment and genome instability. Importantly, a growing body of evidence links R-loop accumulation with cellular dysfunction, increased cell death, and chronic disease onset. Here, we characterized the R-loop landscape in aging Drosophila melanogaster photoreceptor neurons and showed that bulk R-loop levels increased with age. Further, genome-wide mapping of R-loops revealed that transcribed genes accumulated R-loops over gene bodies during aging, which correlated with decreased expression of long and highly expressed genes. Importantly, while photoreceptor-specific down-regulation of Top3β, a DNA/RNA topoisomerase associated with R-loop resolution, lead to decreased visual function, over-expression of Top3β or nuclear-localized RNase H1, which resolves R-loops, enhanced positive light response during aging. Together, our studies highlight the functional link between dysregulation of R-loop homeostasis, gene expression, and visual function during aging.

Keywords: Drosophila; R-loop; aging; eye; neurons; photoreceptors; transcription; visual.


Conflict of interest statement

The authors declare that they have no competing interests.

Figures

FIGURE 1
FIGURE 1
Aging photoreceptor neurons show increased global R‐loop levels that correlate with loss of function and precede age‐associated retinal degeneration. (a) Schematic diagram of experimental outline to detect global levels of R‐loops in aging photoreceptor neurons. Top: diagram of the cellular localization of the GFPKASH protein. Dark blue lines represent each lipid layer within the nuclear membrane. Bottom: diagram of an ommatidium, a structural subunit in the Drosophila compound eye. Each ommatidium is composed of 8 photoreceptor neurons, labeled R1 to R8. Outer photoreceptors (R1‐R6) express the ninaE (Rh1) gene. (b) Slot blot analysis of R‐loop levels from photoreceptor nuclei at Days 10, 30, and 50 post‐eclosion treated with (right) or without (left) RNase H1. Slot blots were performed using RNA‐DNA hybrid‐specific S9.6 antibody (top) and ssDNA for loading control (bottom). (c) Quantification of S9.6 slot blot signal in aging PRs from (b). Values above 1 represent increase signal relative to Day 10. Mean ± Standard Deviation (SD). p Value is obtained using t test, (n = 4)
FIGURE 2
FIGURE 2
Profiling genome‐wide R‐loop distribution in PR neurons reveals age‐associated changes. (a) Schematic diagram of the R‐loop mapping technique used in this study (MapR). Immuno‐enriched nuclei are incubated with ΔRNase H1‐MNase (ΔRH‐MNase), where ΔRH binds to R‐loops. Ionic activation of MNase results in cleavage of surrounding DNA and subsequent R‐loop enriched DNA release, which is purified and used for sequencing library preparation. (b) Genome browser inspection of MapR track data on integrated genomic viewer (IgV) for a selected genomic region. Three independent biological replicates (R1‐R3) from 10‐day‐old flies’ samples not pre‐treated with RNase H1 are shown in black, and a sample from nuclei that were pre‐treated with RNase H1 prior to MapR (see Methods) is shown in blue. Peaks obtained using MACS2 for each sample are also shown as bars under each corresponding sample track. (c) Metaplot of CPM‐normalized MapR signal over gene bodies for samples that were pre‐treated with (blue) or without (black) RNase H1 prior to MapR (from b). (d) Spearman correlation heatmap of Aging MapR read distribution over 1000‐bp binned genome. Scores between 0 and 1 shown in each box correspond to Spearman's rank score. (e) Principal component analysis (PCA) of Aging MapR samples based on read distribution over 1000‐bp binned genome
FIGURE 3
FIGURE 3
Age‐associated accumulation of R‐loops over gene bodies correlates with high GC content, gene length, and transcript levels. (a) Metaplot of CPM‐normalized MapR signal over gene bodies for all genes across age‐timepoints. Signal is an average obtained from three independent biological replicates per age‐timepoint. TSS indicates transcription start site and TTS indicates transcription termination site. (b) Metaplot of CPM‐normalized Aging MapR signal around peaks obtained using MACS2 during aging. (c) Boxplot of genomic coverage of aging MapR signal as defined by the total sum of peak width obtained at each time point. Peaks that mapped to scaffold or non‐defined chromosomes were excluded from analysis. We used Wilcoxon Rank‐Sum test to compare pair‐wise differences in the distribution of genomic coverage among ages, (n = 3). (d) Heatmap showing log2 ratios of Aging MapR signal around the TSS (top) or TTS (bottom), comparing Day 50 to Day 10. Genes are ranked based on their fold change value and divided in four groups (quartiles) based on their position on the heatmap. (e) Boxplot analysis of GC content, gene length, and expression levels for each group of genes divided in four groups based on the Aging MapR fold changes around TSS (top) and TTS (bottom). p Value is obtained using Wilcoxon test
FIGURE 4
FIGURE 4
Accumulation of R‐loops in long genes correlates with decreased transcript levels in aging PRs. (a) Volcano plot representing differentially expressed genes (DEGs) between Day 50 and Day 10. DEGs are obtained using DESeq2 (adjusted p value < 0.05, |FC| > 1.5). (b) Venn diagram representing the overlap between R‐loop containing genes (RCGs) and DEGs from (a). (c) Box plot analysis of gene length for differentially expressed genes, R‐loop containing genes, or RCG/DEGs from (b). p Value is obtained using Wilcoxon test. (d) Hierarchically clustered heatmap of RNA‐seq data for RCG/DEGs from (b). Normalized Z‐scores are calculated based on normalized counts obtained using DESeq2, and the heatmap is divided into genes that were either up‐ or down‐regulated with age. (e) Dot plot of biological processes identified as significantly enriched in Gene Ontology (GO) term analysis for genes that were either up‐ or down‐regulated from (d). (f) Scatter plot depicting an enrichment analysis of diseases associated with genes that were down‐regulated with age and contained at least one R‐loop. Analysis performed using literature mining tool BioLitMine (Hu et al., 2020). A lower score (x‐axis) represents higher enrichment
FIGURE 5
FIGURE 5
Loss of Drosophila Top3β leads to increased R‐loop levels. (a) Comparison of Top3β protein levels in aging eyes from Rh1 > GFPKASH flies, shown as normalized protein abundance. Proteomic samples were prepared from 10‐ and 40‐day‐old flies, 100 eyes/sample (n = 4). Raw data taken from (Hall et al., 2021). (b) Slot blot analysis of R‐loop levels from 3rd instar larvae ubiquitously expressing siRNA against mCherry (siControl) or against Top3β (siTop3β). Samples were treated with (right) or without (left) RNase H1. Slot blots were performed using S9.6 antibody (top) and ssDNA for loading control (bottom). (c) Quantification of S9.6 slot blot from (b). S9.6 signal is normalized to ssDNA slot blot signal, (n = 3). (d) Box plots showing the light preference indices (positive phototaxis) for Rh1 > GFPKASH, mCherry‐RNAi (siControl) or Rh1 > GFPKASH, Top3β‐RNAi (siTop3β) at Day 10 and Day 30 (6 biological replicates for each time point or RNAi, 27 – 33 male flies/replicate; total number of flies per fly strain = 150–180). p Value was obtained using Wilcoxon test. (e) Optic neutralization of siControl and siTop3β at Day 10 and Day 30 post‐eclosion from (d). Retinal degeneration (RD) scores were obtained by blindly quantifying 5 biological replicates. Score of 0% means there was no observable loss of rhabdomere or ommatidia
FIGURE 6
FIGURE 6
Top3β regulates expression of a subset of long genes associated with neuronal function in photoreceptors. (a) Volcano plot representing differentially expressed genes (DEGs) between siTop3β and siControl‐expressing photoreceptors at Day 30 post‐eclosion. DEGs obtained using DESeq2 (adjusted p value < 0.05, |FC| > 1.5). Size of each point reflect the gene length of the whole gene as defined as most upstream TSS and most downstream TTS. (b) Box plots showing the gene length (as log2‐transformed bp) for genes identified as down‐, up‐regulated or not regulated using DESeq2 in siTop3β photoreceptors relative to siControl (adjusted p value < 0.05, |FC| > 1.5). p Value obtained using Wilcoxon test. (c) Gene concept network analysis (Cnetplot) of genes down‐regulated in siTop3β photoreceptors relative to siControl. Gene length in kilobases is shown next to each gene. (d) Venn diagram representing the overlap of genes that were down‐regulated in either aging (D50 vs. D10) or upon loss of Top3β (siTop3β vs. siControl). Overlap significance is denoted as a “overlapping p value”, obtained with a hypergeometric test. Odds ratio and Jaccard index are measurements of similarity. (e) Box plots showing the gene length (as log2‐transformed bp) for genes in the overlap identified in (d) or genes that were regulated by Top3β but not during aging. p Value is obtained using Wilcoxon test. (f) Box plots showing the gene length (as log10‐transformed bp) for genes that were identified as down‐ or up‐regulated in either aging PRs (left) or eyes (right). Eye data was obtained from (Stegeman et al., 2018). (g) Box plots showing the light preference indices (positive phototaxis) for Top3β−/−; longGMR>Top3β, Top3β−/−; longGMR > Top3β, and longGRM > RNase H1 at Day 10, 20, and 30 post‐eclosion (6 biological replicates for sample; 29–31 male flies/experiment; total number of flies ~180). p Value obtained using Wilcoxon test

Similar articles

Cited by

References

    1. Aguilera, A. , & García‐Muse, T. (2012). R loops: From transcription byproducts to threats to genome stability. Molecular Cell, 46(2), 115–124. 10.1016/j.molcel.2012.04.009 - DOI - PubMed
    1. Alecki, C. , Chiwara, V. , Sanz, L. A. , Grau, D. , Arias Pérez, O. , Boulier, E. L. , Armache, K.‐J. , Chédin, F. , & Francis, N. J. (2020). RNA‐DNA strand exchange by the Drosophila Polycomb complex PRC2. Nature Communications, 11(1), 1781. 10.1038/s41467-020-15609-x - DOI - PMC - PubMed
    1. Belotserkovskii, B. P. , Tornaletti, S. , D’Souza, A. D. , & Hanawalt, P. C. (2018). R‐loop generation during transcription: Formation, processing and cellular outcomes. DNA Repair, 71, 69–81. 10.1016/j.dnarep.2018.08.009 - DOI - PMC - PubMed
    1. Bentin, T. , Cherny, D. , Larsen, H. J. , & Nielsen, P. E. (2005). Transcription arrest caused by long nascent RNA chains. Biochimica Et Biophysica Acta (BBA) ‐ Gene Structure and Expression, 1727(2), 97–105. 10.1016/j.bbaexp.2004.12.006 - DOI - PubMed
    1. Bonnel, S. , Mohand‐Said, S. , & Sahel, J.‐A. (2003). The aging of the retina. Experimental Gerontology, 38(8), 825–831. 10.1016/S0531-5565(03)00093-7 - DOI - PubMed

Publication types