. 2022 May 24;145(4):1449-1463.
doi: 10.1093/brain/awab387.

VEGF signalling causes stalls in brain capillaries and reduces cerebral blood flow in Alzheimer's mice

Affiliations

VEGF signalling causes stalls in brain capillaries and reduces cerebral blood flow in Alzheimer's mice

Muhammad Ali et al. Brain. .

Abstract

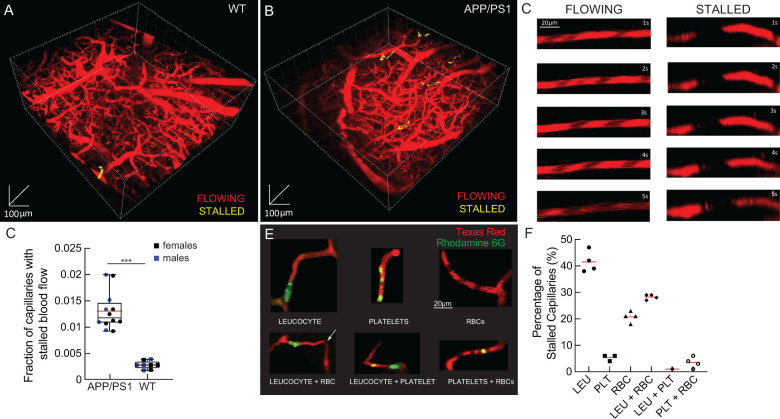
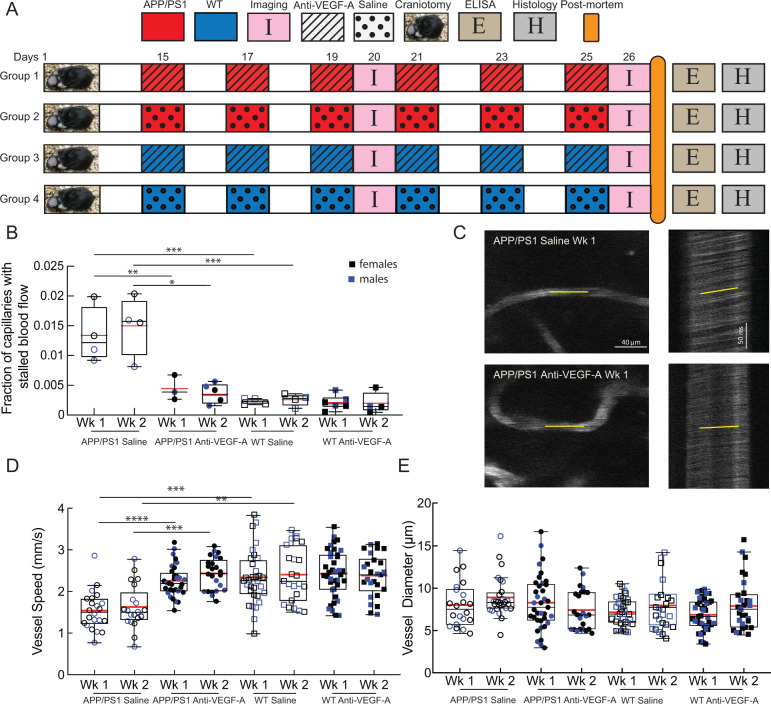
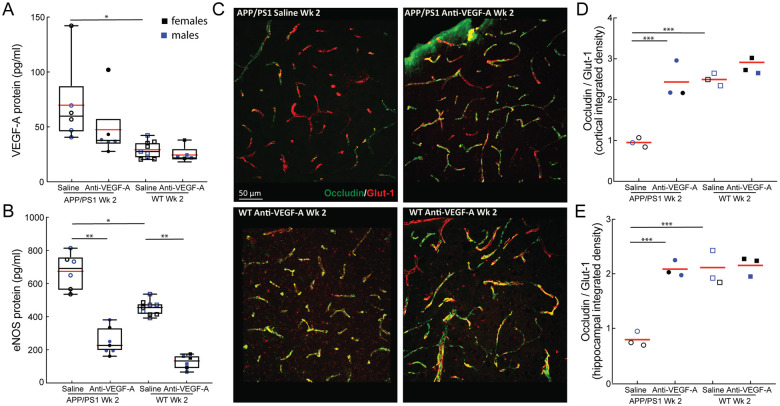
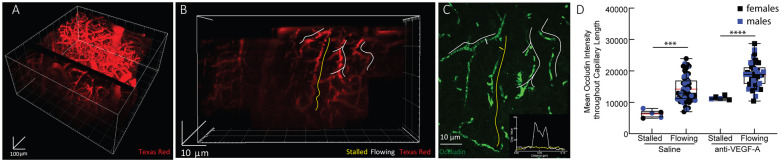
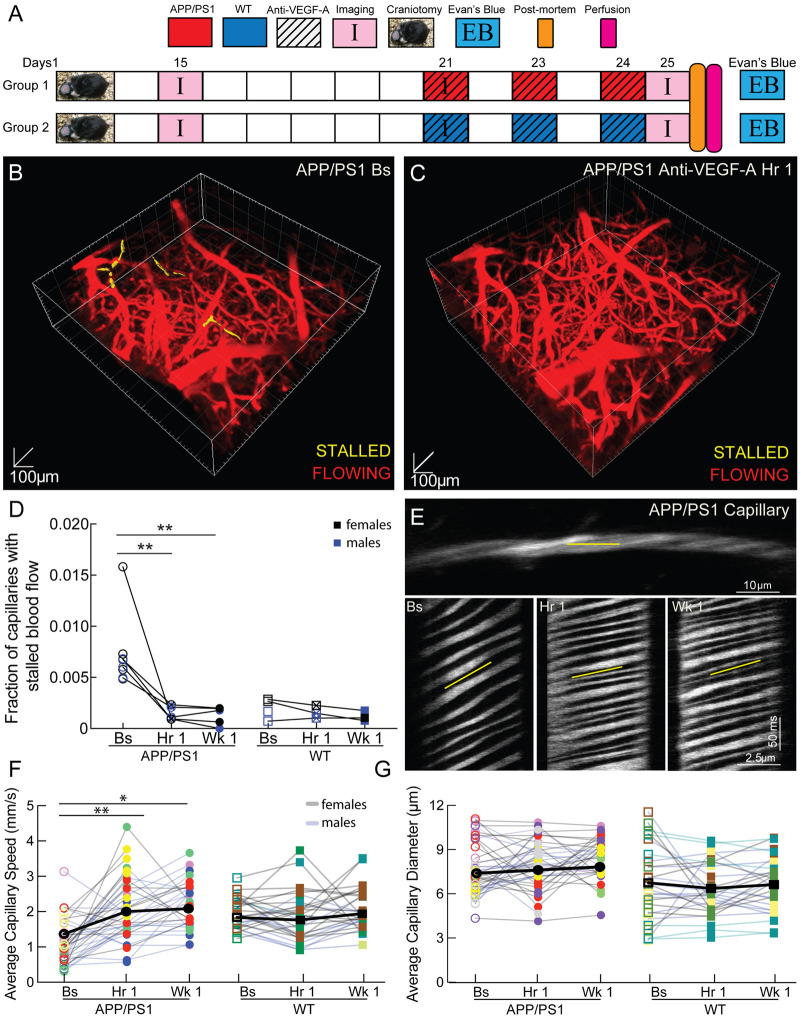
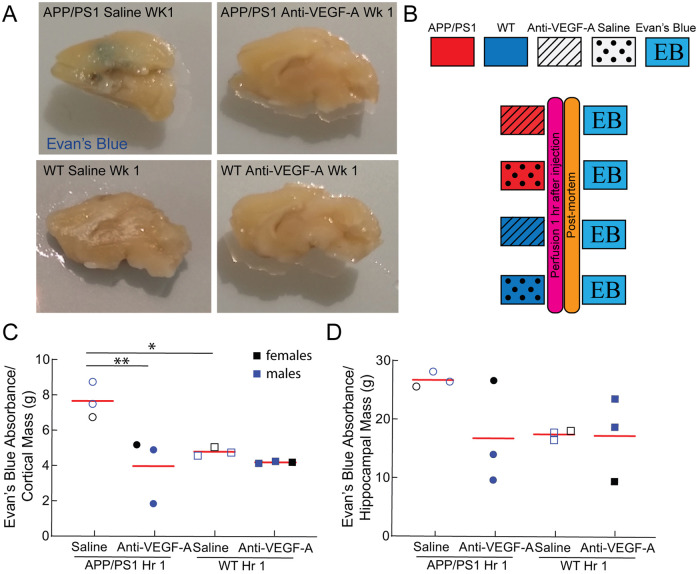
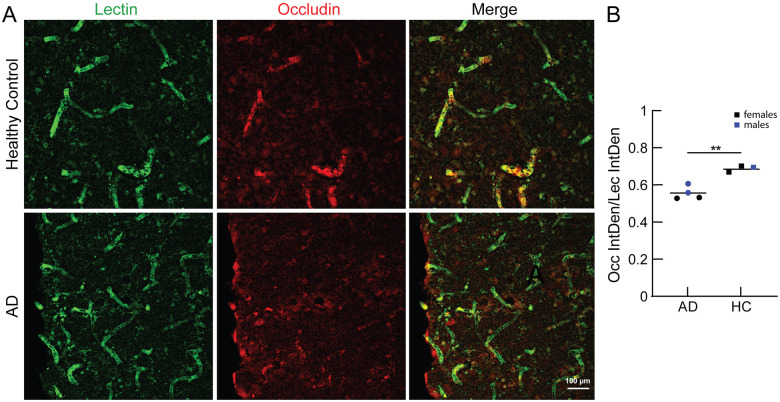
Increased incidence of stalled capillary blood flow caused by adhesion of leucocytes to the brain microvascular endothelium leads to a 17% reduction of cerebral blood flow and exacerbates short-term memory loss in multiple mouse models of Alzheimer's disease. Here, we report that vascular endothelial growth factor (VEGF) signalling at the luminal side of the brain microvasculature plays an integral role in the capillary stalling phenomenon of the APP/PS1 mouse model. Administration of the anti-mouse VEGF-A164 antibody, an isoform that inhibits blood-brain barrier hyperpermeability, reduced the number of stalled capillaries within an hour of injection, leading to an immediate increase in average capillary blood flow but not capillary diameter. VEGF-A inhibition also reduced the overall endothelial nitric oxide synthase protein concentrations, increased occludin levels and decreased the penetration of circulating Evans Blue dye across the blood-brain barrier into the brain parenchyma, suggesting increased blood-brain barrier integrity. Capillaries prone to neutrophil adhesion after anti-VEGF-A treatment also had lower occludin concentrations than flowing capillaries. Taken together, our findings demonstrate that VEGF-A signalling in APP/PS1 mice contributes to aberrant endothelial nitric oxide synthase /occludin-associated blood-brain barrier permeability, increases the incidence of capillary stalls, and leads to reductions in cerebral blood flow. Reducing leucocyte adhesion by inhibiting luminal VEGF signalling may provide a novel and well-tolerated strategy for improving brain microvascular blood flow in Alzheimer's disease patients.

Keywords: Alzheimer’s disease; blood–brain barrier; capillary stalling; cerebral blood flow; vascular endothelial growth factor.


Figures

Figure 1
Figure 1
2PEF imaging of mouse cortical vasculature showed a larger fraction of capillaries with stalled blood flow in APP/PS1 mice. Rendering of a 2PEF image stack of the cortical vasculature (red; Texas Red dextran) from a wild-type (WT) mouse (A), with a single stalled capillary indicated in yellow, and of an APP/PS1 mouse (B), with five stalled capillaries. (C) Individual capillaries throughout the image stack were characterized as flowing or stalled based on the movement of unlabeled (black) red blood cells within the fluorescently labelled blood plasma (red). (D) Fraction of capillaries with stalled blood flow APP/PS1 (n = 12) and WT (n = 8) mice, ∼ 23 000 capillaries; two-tailed Mann–Whitney test, P = 0.001; box plot: whiskers extend 1.5× the difference between the 25th and 75th percentiles of the data, the red horizontal line represents the median, the black line represents the mean. Sex differences are indicated by colour, with black data-points representing females and blue representing males. (E) Z-projection of image stacks through stalled capillaries that contain a leucocyte (LEU, top left), platelet aggregates (PLT, top middle), RBCs (top right), LEU and RBCs (bottom left), LEU and PLT (bottom middle) and PLT and RBCs (bottom right), distinguished by fluorescent labels (red: Texas Red labelled blood plasma; green: Rhodamine 6G labelled LEU and PLT). (F) Percentage of capillary stalls in APP/PS1 mice that contained only LEU, only PLT, only RBCs, both LEU and RBCs, both LEU and PLT and both PLT and RBCs (n = 4, 98 capillaries).
Figure 2
Figure 2
Anti-VEGF-A antibody treatment reduced the incidence of capillary stalling increased CBF speed in APP/PS1 mice. (A) Schematic of experimental timeline. After craniotomies were performed and the mice recovered for 2 weeks, the mice were divided into four groups and treated, as follows, every other day for 2 weeks: APP/PS1 mice injected with saline (n = 4; APP/PS1–saline), APP/PS1 mice treated with anti-VEGF-A (n = 5; APP/PS1–anti-VEGF-A), wild-type (WT) mice injected with saline (n = 6; WT–saline) and WT mice treated with anti-VEGF-A (n = 6; WT–anti-VEGF-A). These mice were imaged twice, on the sixth and 12th days after the first injection. Their brains were harvested for post-mortem assays after the second imaging session. (B) Box plot of the fraction of capillaries with stalled blood flow after 1 week and 2 weeks of anti-VEGF-A or saline treatment in APP/PS1 and WT mice (APP/PS1–anti-VEGF-A: two mice excluded at Week 1 time point due to motion artefact, one mouse lost cranial window before Week 2 time point; WT–saline: one mouse at Week 1 excluded due to motion artefact, one mouse lost cranial window before Week 2; WT–anti-VEGF-A: one mouse lost cranial window before Week 2 imaging session); ∼48 000 capillaries; one-way ANOVA with Holm–Šídák post hoc multiple comparison correction to compare across multiple groups: Week 1 APP/PS1–saline versus Week 1 APP/PS1–anti-VEGF-A P = 0.004, Week 2 saline versus Week 2 anti-VEGF-A APP/PS1 P = 0.001, Week 1 saline APP/PS1 versus Week 1 saline WT P = 0.001, Week 2 APP/PS1–saline versus Week 2 WT–saline P = 0.001, Week 1 APP/PS1–anti-VEGF-A versus Week 1 APP/PS1–saline P = 0.01; each data-point in the graph represents the fraction of stalled capillaries in 4–6 2PEF stacks for each mouse). (C) Images (left) and line scans (right) from representative vessels from a saline (top) and anti-VEGF-A (bottom) injected APP/PS1 mouse. (D) RBC flow speed and (E) vessel diameter in cortical capillaries after 1 week and 2 weeks of anti-VEGF-A or saline treatment in APP/PS1 and WT mice [Week 1 APP/PS1–saline: n = 4, 22 vessels, Week 2 APP/PS1–saline: n = 4, 21 vessels, Week 1 APP/PS1–anti-VEGF-A: n = 5, 32 vessels, Week 2 APP/PS1–anti-VEGF-A: n = 4, 24 vessels (one mouse lost cranial window after Week 1 imaging session), Week 1 WT–saline: n = 6, 32 vessels, Week 2 WT–saline: n = 5, 23 vessels (one mouse lost cranial window after Week 1 imaging session), Week 1 WT–anti-VEGF-A: n = 6, 38 vessels, Week 2 WT–anti-VEGF-A: n = 5, 26 vessels (one mouse lost cranial window after Week 1 imaging session)]; one-way ANOVA with Tukey’s post hoc multiple comparison correction to compare vessel speed across groups: Week 1 saline APP/PS1 versus Week 1 anti-VEGF-A APP/PS1 P < 0.0001, Week 2 saline versus Week 2 APP/PS1–anti-VEGF-A P = 0.0010, Week 1 WT–saline versus Week 1 WT–anti-VEGF-A P > 0.99, Week 2 saline WT versus Week 2 WT–anti-VEGF-A P > 0.99, Week 1 APP/PS1–saline versus Week 1 WT–saline P = 0.0007, Week 2 APP/PS1–saline versus Week 2 WT–saline P = 0.0022, Week 1 APP/PS1–anti-VEGF-A versus Week 1 WT–saline P > 0.99, Week 2 APP/PS–anti-VEGF-A 1 versus Week 2 WT–saline P > 0.99; each point in the graph represents one of the 4–8 capillaries measured in each mouse at each imaging session. In all graphs the box plot whiskers extend 1.5× the difference between the 25th and 75th percentiles of the data, the red horizontal line represents the median and the black line represents the mean. Sex differences are indicated by colour, with black data-points representing females and blue representing males.
Figure 3
Figure 3
Anti-VEGF-A treatment modulates endothelial protein expression in APP/PS1 mice. ELISA measurements of VEGF-A (A) and eNOS (B) concentrations after 2 weeks of anti-VEGF-A treatment or saline control injections in APP/PS1 and wild-type (WT) mice (APP/PS1–saline: n = 6, APP/PS1–anti-VEGF-A: n = 6 (7), WT–saline: n = 9, WT–anti-VEGF-A: n = 5 (6); one-way ANOVA with Tukey’s post hoc multiple comparison correction to compare across groups: APP/PS1–saline (VEGF-A) versus APP/PS1–anti-VEGF-A (VEGF-A) P < 0.075, WT–saline (VEGF-A) versus WT–anti-VEGF-A (VEGF-A) P = 0.81, APP/PS1–saline (VEGF-A) versus WT–saline (VEGF-A) P < 0.05, APP/PS1–anti-VEGF-A (VEGF-A) versus WT–saline (VEGF-A) P = 0.93, APP/PS1–saline (eNOS) versus APP/PS1–anti-VEGF-A (eNOS) P < 0.01, WT–saline (eNOS) versus WT–anti-VEGF-A (eNOS) P < 0.01, APP/PS1–saline (eNOS) versus WT–saline (eNOS) P < 0.05). (C) Z-projection of confocal microscopy image stacks from representative cortical areas from mice of all four groups, revealing increased occludin density in anti-VEGF-A-treated APP/PS1 mice as compared to saline-injected APP/PS1 mice. Integrated density of occludin fluorescence as a function of the integrated density of the endothelial cell marker Glut-1 in the cortex (C) and hippocampus (D) (APP/PS1–saline: n = 3, APP/PS1–anti-VEGF-A: n = 3, WT–saline: n = 3, WT–anti-VEGF-A: n = 3; one-way ANOVA with Tukey’s post hoc multiple comparison correction to compare across groups: APP/PS1–saline cortex versus APP/PS1–anti-VEGF-A cortex P = 0.0006, saline WT cortex versus WT–anti-VEGF-A cortex P = 0.53, APP/PS1–saline cortex versus WT–saline cortex P = 0.0005, APP/PS1–anti-VEGF-A cortex versus WT–saline cortex P > 0.99, APP/PS1–saline hippocampus versus APP/PS1–anti-VEGF-A hippocampus P = 0.0004, WT–saline hippocampus versus WT–anti-VEGF-A hippocampus P > 0.99, APP/PS1–saline hippocampus versus WT–saline hippocampus P = 0.0002, APP/PS1–anti-VEGF-A hippocampus versus WT–saline hippocampus P > 0.99). Each point represents one mouse and the red horizontal represents the median. Sex differences are indicated by colour, with black data-points representing females and blue representing males.
Figure 4
Figure 4
Anti-VEGF-A-treated APP/PS1 mice had lower occludin expression in stalled capillaries as compared to flowing capillaries. Capillaries of APP/PS1 mice treated with anti-VEGF-A seen via in vivo 2PEF imaging (A and B), with flowing (white highlight) and stalled (yellow highlighted) vessels indicated, spatially aligned to occludin immunofluorescence histopathology (C) revealing lower occludin fluorescence at stalled capillaries as compared to flowing capillaries. The inset graph in the lower right tracks the cross-sectional mean grey value of occludin fluorescence across the distance of the white and yellow dashes on the stalled and flowing capillary. (D) Mean occludin concentrations, determined from the immunohistochemistry, for flowing and capillary segments, determined from in vivo imaging, in APP/PS1 mice treated with anti-VEGF-A for 2 weeks (APP/PS1 saline n = 3 mice, 61 capillaries and APP/PS1 anti-VEGF-A n = 2 mice, 43 capillaries; Kruskal–Wallis test with multiple comparison correction to compare across groups; saline P-value < 0.001, anti-VEGF-A P < 0.0001); bar graph represents mean values, and error bars represent standard deviation). Sex differences are indicated by colour, with black data-points representing females and blue representing males.
Figure 5
Figure 5
Anti-VEGF-A antibody treatment reduced capillary stalls and increased capillary flow speed within 1 h in APP/PS1 mice. (A) Schematic of experimental timeline. Craniotomies were performed on APP/PS1 mice and they recovered for 2 weeks. The mice were divided into two groups: APP/PS1 mice treated with anti-VEGF-A (n = 9; APP/PS1–anti-VEGF-A) and wild-type (WT) mice treated with anti-VEGF-A (n = 4; WT–anti-VEGF-A). These mice were imaged three times—twice on the first imaging day before and ∼1 h after treatment and again 5 days later after two additional treatments. The brains were harvested for post-mortem assays after the second imaging session. Rendering of 2PEF stacks of the brain from the same APP/PS1 mouse before (B) and 1 h after (C) anti-VEGF-A injection. Capillaries that were stalled are highlighted in yellow. (D) The fraction of capillaries with stalled blood flow at baseline (Bs), 1 h after anti-VEGF-A injection and after 1 week of treatment in APP/PS1 and WT mice (APP/PS1: 4 mice could not be imaged at 1 week due to window loss or death; ∼60 000 capillaries; repeated-measures one-way ANOVA with Tukey’s post hoc multiple comparison correction to compare baseline to 1 h and 1 week: APP/PS1–baseline versus APP/PS1–1-h P = 0.02, APP/PS1–baseline versus APP/PS1–1-week P = 0.005; Kruskal–Wallis test with multiple comparison correction to compare across groups; each data-point in the graph represents the capillaries with stalled blood flow as a function of total capillaries in 4–6 2PEF stacks for each mouse). Sex differences are indicated by colour, with black data-points representing females and blue representing males. (E) Image (top) and line scans (bottom) from a representative capillary from an APP/PS1 mouse taken at baseline and at 1 h and 1 week after anti-VEGF-A treatment, showing higher RBC flow speeds after treatment. (F) Average RBC flow speed and (G) vessel diameter from cortical capillaries at baseline and at 1 h and 1 week after anti-VEGF-A injection in APP/PS1 and WT mice (APP/PS1–baseline: n = 9, 53 capillaries, APP/PS1–1-h: n = 6 (one mouse died, two mice lost cranial windows), 45 capillaries, APP/PS1–1-week: n = 5 (one mouse lost cranial window), 35 capillaries, WT–baseline: n = 4, 21 capillaries, WT–1-h: n = 3 (one mouse lost cranial window), 23 capillaries, WT–1-week: n = 3, 21 capillaries; repeated-measures one-way ANOVA with Tukey’s post hoc multiple comparison correction to compare baseline to 1 h to 1 week: APP/PS1–baseline versus APP/PS1–1-h P = 0.0100, APP/PS1–baseline versus APP/PS1–1-week P = 0.0288, WT–baseline versus WT–1-h P = 0.9390, WT–baseline versus WT–1-week P = 0.2884). In all graphs, lines connecting data-points represent the same capillary, while different colours represent individual mice. Sex differences are indicated by colour, with shaded black lines between the data-points representing females and shaded blue lines between data-points representing males.
Figure 6
Figure 6
Anti-VEGF-A antibody treatment reduces BBB leakage within 1 h in APP/PS1 mouse. (A) Sagittally cut brain slices from APP/PS1 and wild-type (WT) mice treated with anti-VEGF-A or saline for 1 week and after 1 h of intravenous circulation of Evans Blue dye. Arrow indicates region of increased penetration of Evans Blue into the brain in the APP/PS1 saline-treated mouse. (B) Schematic of experimental timeline. APP/PS1 and WT mice were treated with anti-VEGF-A or saline. Evans Blue was intravenously injected an hour before perfusion and the extent of Evans Blue entry into the brain from the vasculature was quantified (n = 3 mice per group). Normalized absorbance of whole cortex (C) or hippocampus (D) tissue homogenates at 620 nm, to quantify the extent of Evans Blue entry into the brain for APP/PS1 and WT mice treated with anti-VEGF-A or saline (one-way ANOVA with Tukey’s post hoc multiple comparison correction: C, saline APP/PS1 versus anti-VEGF-A APP/PS1 P = 0.01; C, saline APP/PS1 versus saline WT P = 0.04). In the graphs each point represents data from one mouse and the red horizontal line represents the mean. Sex differences are indicated by colour, with black data-points representing females and blue representing males.
Figure 7
Figure 7
Occludin staining in cortical brain sections from Alzheimer’s disease patients and healthy controls. (A) Z-projection of confocal microscopy image stacks from representative cortical areas from healthy controls (top) and Alzheimer’s disease patients (bottom), revealing reduced occludin levels (red) in cortical capillaries identified by lectin staining (green). (B) Integrated density of occludin fluorescence, normalized to that of lectin. Eight fields of view from four sections were averaged for each sample (healthy controls n = 3 and Alzheimer’s disease patients n = 4; two-tailed unpaired t-test, **P = 0.01; red horizontal line represents the median). Sex differences are indicated by colour, with black data-points representing females and blue representing males.

Similar articles

Cited by

References

    1. Santos CY, Snyder PJ, Wu WC, Zhang M, Echeverria A, Alber J.. Pathophysiologic relationship between Alzheimer’s disease, cerebrovascular disease, and cardiovascular risk: A review and synthesis. Alzheimers Dement (Amst). 2017;7:69–87. - PMC - PubMed
    1. Dai W, Lopez OL, Carmichael OT, Becker JT, Kuller LH, Gach HM.. Mild cognitive impairment and Alzheimer disease: Patterns of altered cerebral blood flow at MR imaging. Radiology. 2009;250(3):856–866. - PMC - PubMed
    1. Bracko O, Cruz Hernández JC, Park L, Nishimura N, Schaffer CB.. Causes and consequences of baseline cerebral blood flow reductions in Alzheimer’s disease. J Cereb Blood Flow Metab. 2021;41(7):1501–1516. - PMC - PubMed
    1. Wiesmann M, Zerbi V, Jansen D, et al. . Hypertension, cerebrovascular impairment, and cognitive decline in aged AbetaPP/PS1 mice. Theranostics. 2017;7(5):1277–1289. - PMC - PubMed
    1. Nation DA, Wierenga CE, Clark LR, et al. . Cortical and subcortical cerebrovascular resistance index in mild cognitive impairment and Alzheimer’s disease. J Alzheimers Dis. 2013;36(4):689–698. - PMC - PubMed

Publication types

Substances