. 2022 Mar 7;219(3):e20210565.
doi: 10.1084/jem.20210565. Epub 2022 Jan 20.

Interplay of vascular endothelial growth factor receptors in organ-specific vessel maintenance

Affiliations

Interplay of vascular endothelial growth factor receptors in organ-specific vessel maintenance

Sinem Karaman et al. J Exp Med. .

Abstract

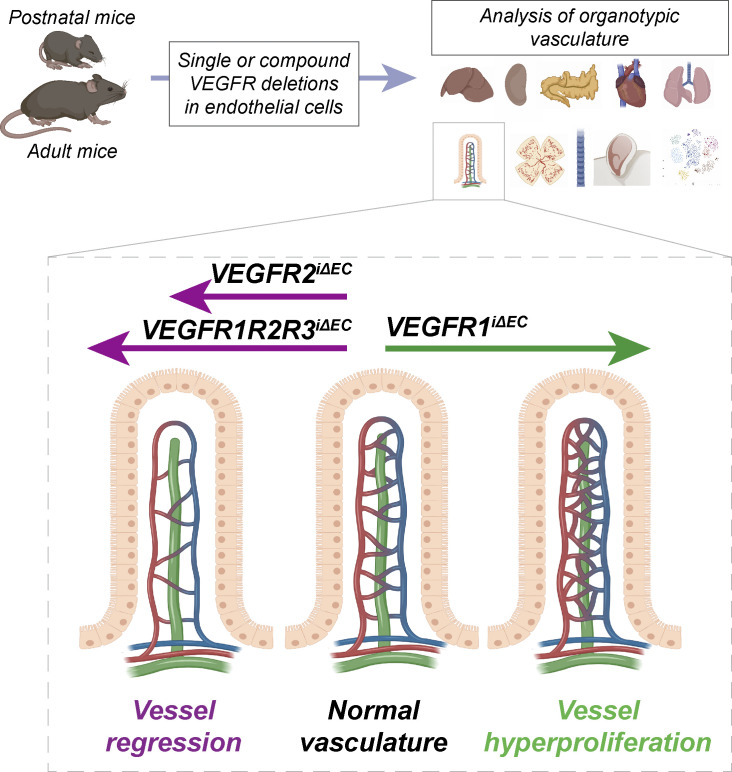
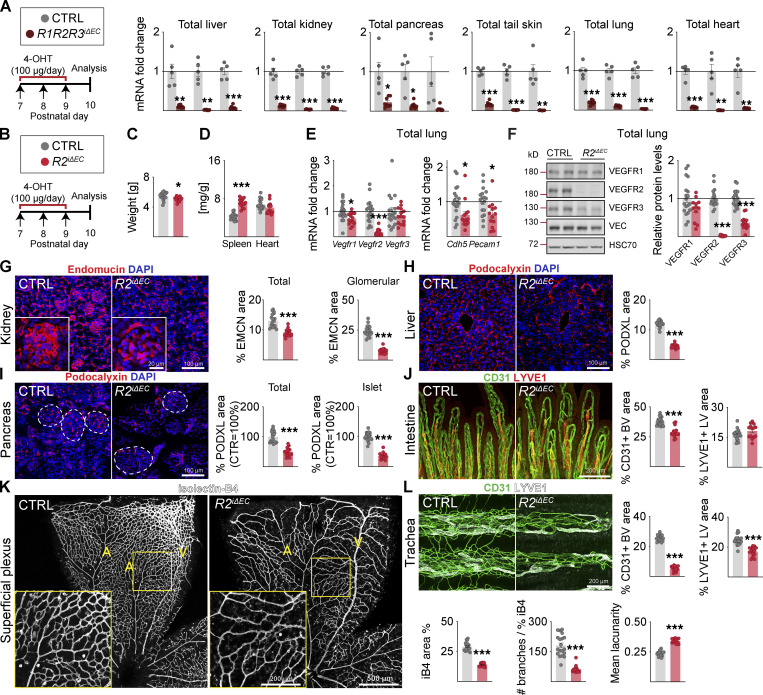
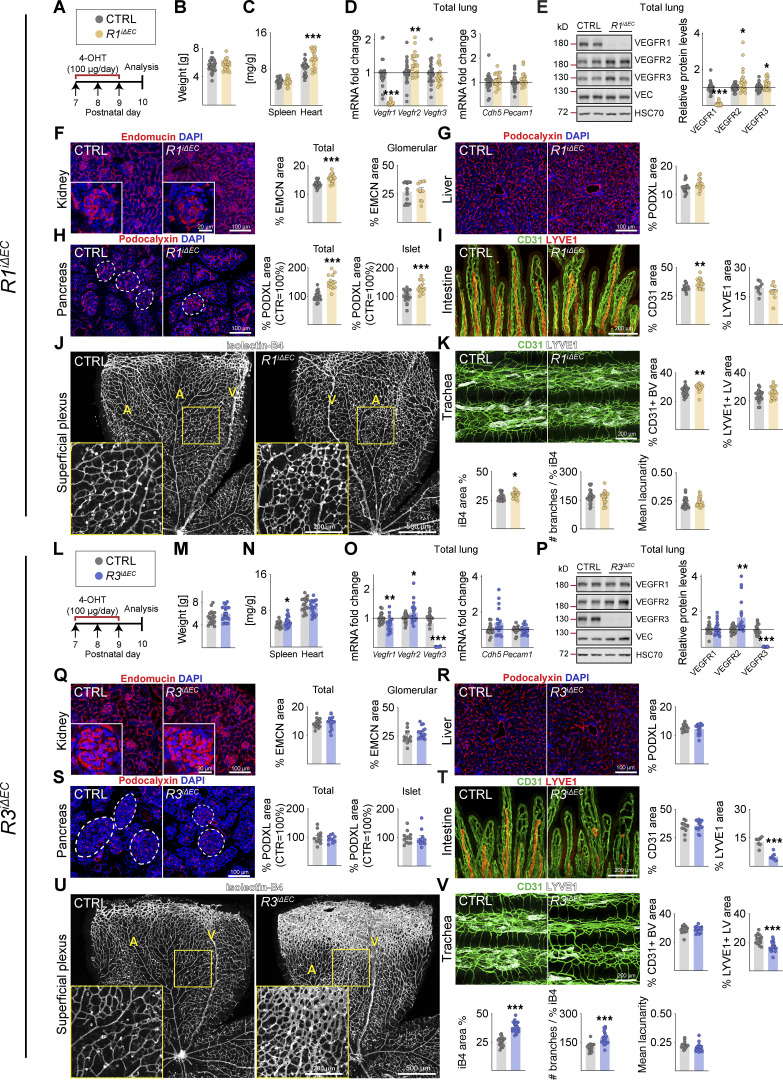
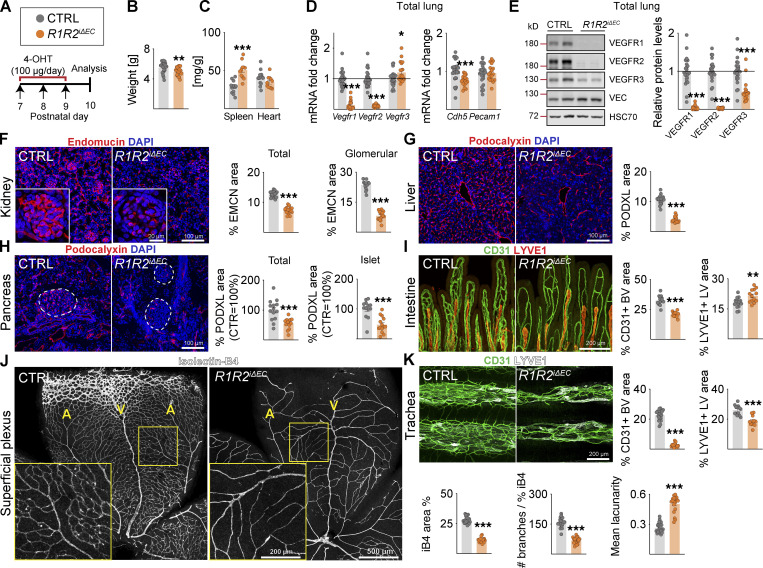
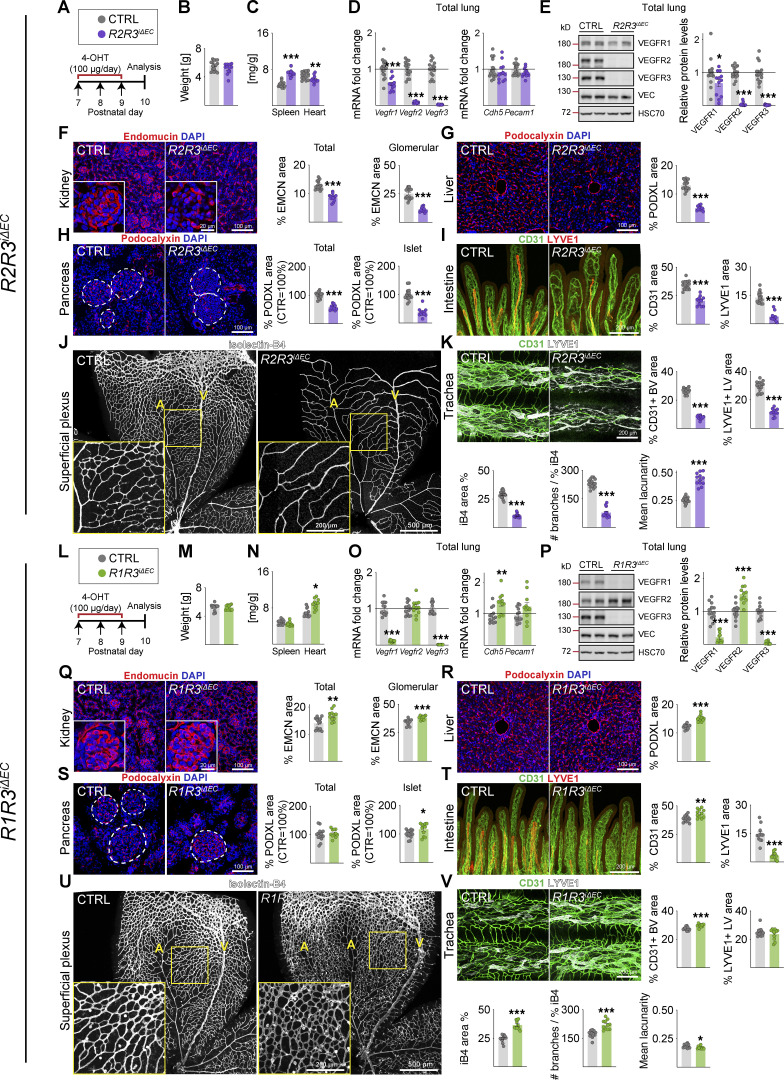
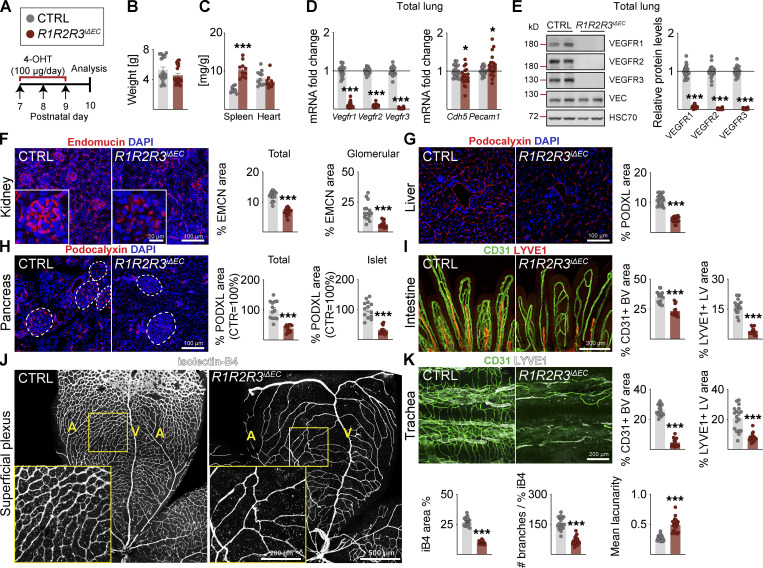
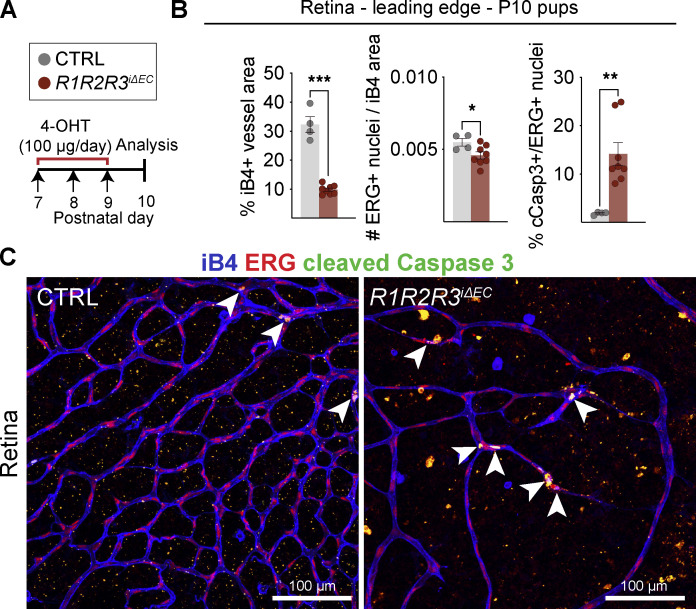
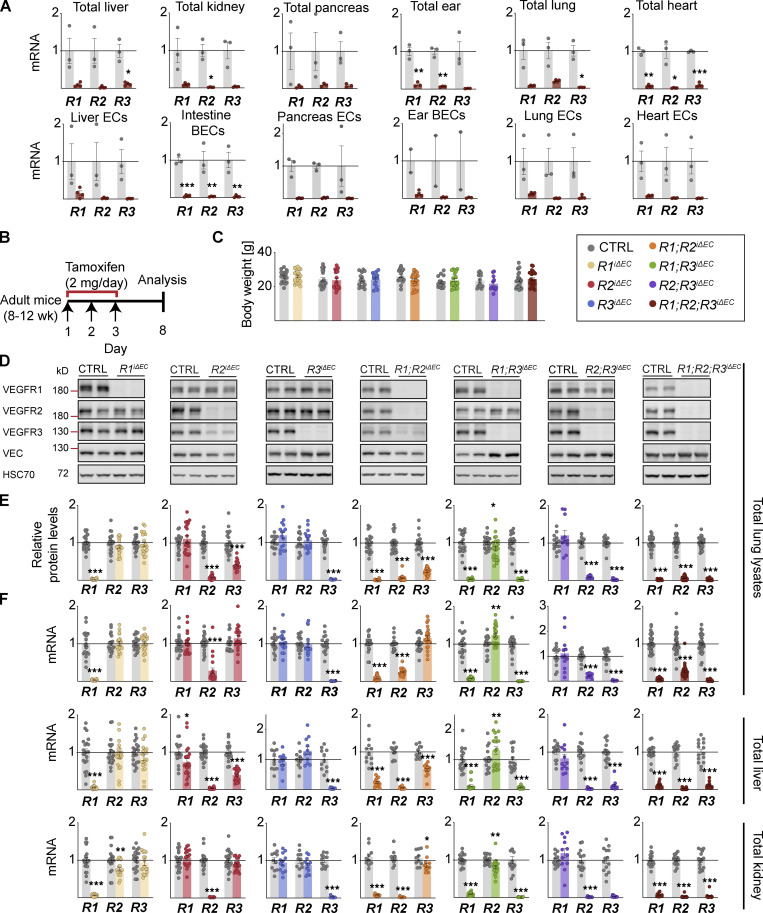
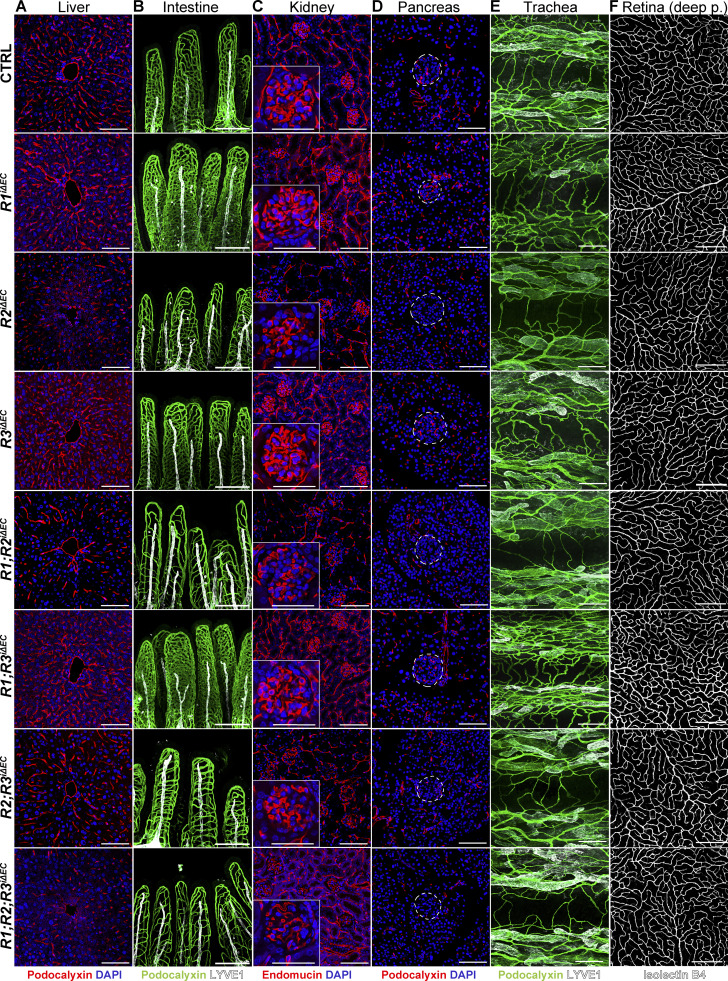
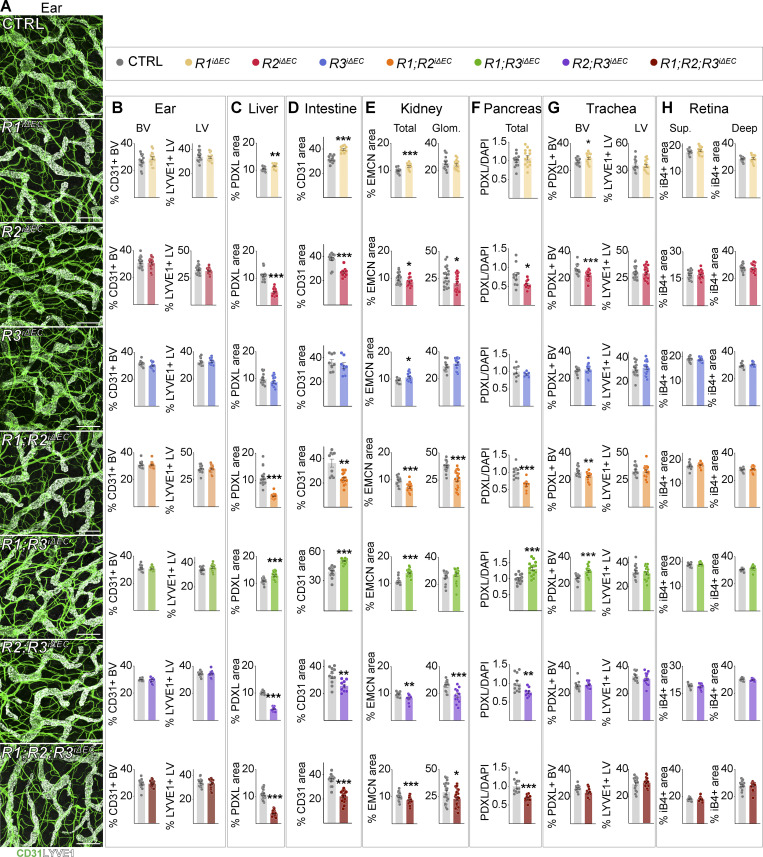
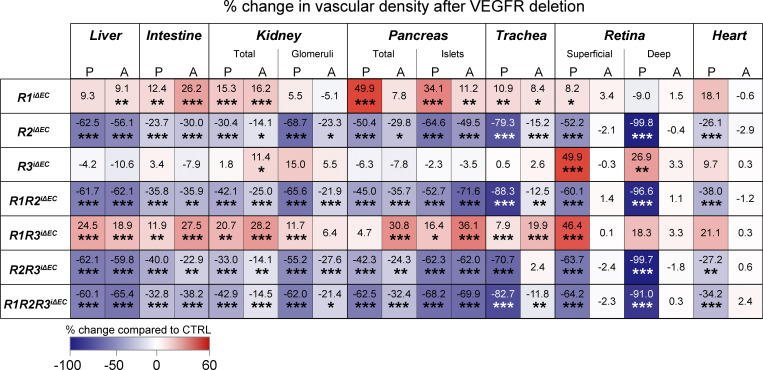
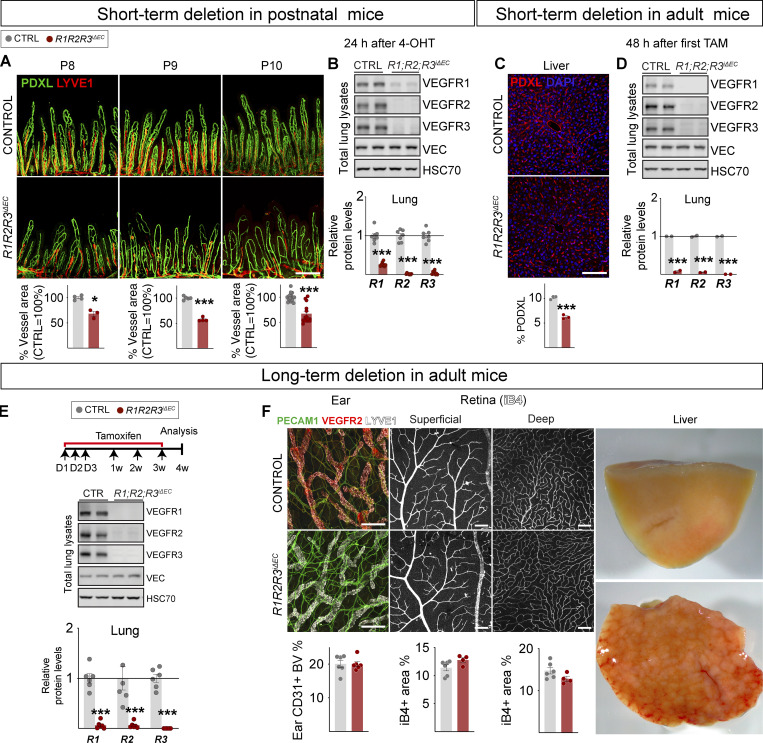
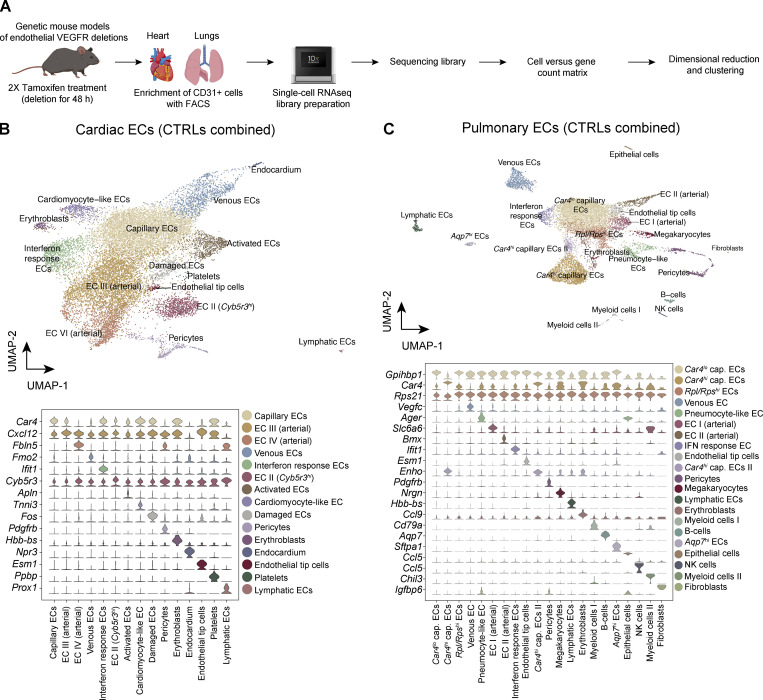
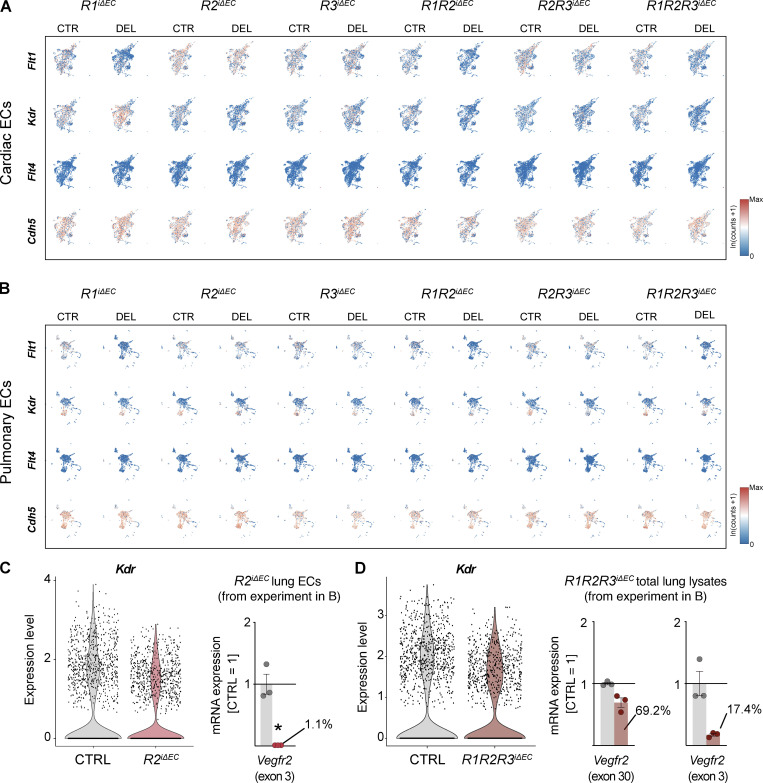
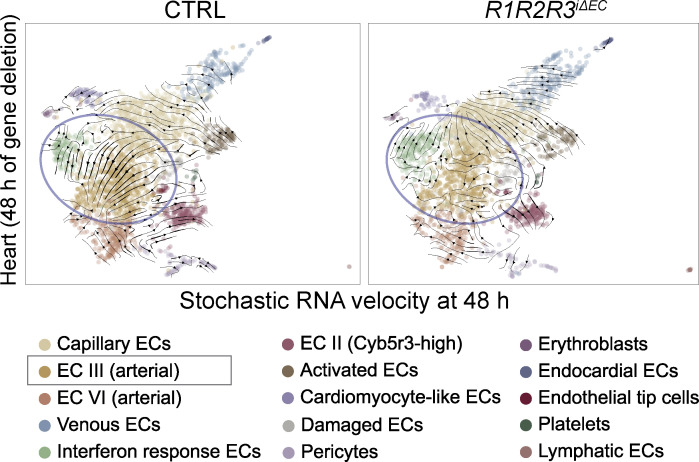
Vascular endothelial growth factors (VEGFs) and their receptors (VEGFRs) are quintessential for the development and maintenance of blood and lymphatic vessels. However, genetic interactions between the VEGFRs are poorly understood. VEGFR2 is the dominant receptor that is required for the growth and survival of the endothelium, whereas deletion of VEGFR1 or VEGFR3 was reported to induce vasculature overgrowth. Here we show that vascular regression induced by VEGFR2 deletion in postnatal and adult mice is aggravated by additional deletion of VEGFR1 or VEGFR3 in the intestine, kidney, and pancreas, but not in the liver or kidney glomeruli. In the adult mice, hepatic and intestinal vessels regressed within a few days after gene deletion, whereas vessels in skin and retina remained stable for at least four weeks. Our results show changes in endothelial transcriptomes and organ-specific vessel maintenance mechanisms that are dependent on VEGFR signaling pathways and reveal previously unknown functions of VEGFR1 and VEGFR3 in endothelial cells.


Conflict of interest statement

Disclosures: The authors declare no competing interests exist.

Figures

None
Graphical abstract
Figure 1.
Figure 1.
Endothelial VEGFR2 deletion causes widespread vessel regression in postnatal mice. (A) Quantification of Vegfr transcripts in different tissues after 3 d of deletion in R1R2R3iΔEC pups and littermate controls (n = control [CTRL] = 5, R1R2R3iΔEC = 8 mice pooled from three independent experiments were used for the data shown). Vegfrs are normalized to 36b4 and Cdh5 transcripts. (B) Experimental setup. (C) Pup weights on P10. (D) Spleen and heart weights normalized to body weight. (E) Quantification of Vegfr transcripts normalized to 36b4 and Cdh5 transcripts; and Cdh5 and Pecam1 transcripts normalized to 36b4 transcripts. (F) Western blots and quantifications of VEGFRs normalized to HSC70 and VE-Cadherin (VEC) in lung lysates. (G) Staining and quantification of blood vessels (EMCN, red) in kidneys and glomeruli (insets). Scale bar = 100 µm, inset = 20 µm. (H) Staining and quantification of blood vessels (PODXL, red) in the liver and (I) pancreas; dashed lines mark Langerhans islets. (J) Intestinal whole-mounts stained for blood (CD31, green) and lymphatic (LYVE1, red) vessels and their quantification. (K) EC staining with isolectin B4 (iB4, white) in retinal whole-mounts and their quantification. A, arteries; V, veins. Only the superficial plexus is shown. Scale bar = 500 µm, inset = 200 µm. (L) Tracheal whole-mount staining and quantification of blood and lymphatic vessels (CD31, green; LYVE1, white). EMCN, endomucin; PODXL, podocalyxin. Error bars = mean ± SEM (n = control [CTRL] = 19, R2iΔEC = 14 mice pooled from four independent experiments were used for the data shown in the panels). Statistical significance was determined using Student’s t test (two-tailed, unpaired). *, P < 0.05; **, P < 0.01; ***, P < 0.001. BV, blood vessel; LV, lymphatic vessel. Source data are available for this figure: SourceData F1.
Figure S1.
Figure S1.
Vascular phenotypes in postnatal mice after VEGFR1 or VEGFR3 deletion. (A and L) Experimental setup. (B and M) Pup weights at P10. (C and N) Spleen and heart weights normalized to body weight. (D and O) Quantification of Vegfr transcripts normalized to 36b4 and Cdh5 transcripts; and Cdh5 and Pecam1 transcripts normalized to 36b4 transcripts. (E and P) Western blots and quantification of VEGFR bands normalized to HSC70 and VE-cadherin (VEC) bands in lung lysates. (F and Q) Staining and quantification of blood vessels (EMCN in red) in kidneys and their glomeruli (insets). Scale bar = 100 µm, inset = 20 µm. (G and R) Staining and quantification of blood vessels (PDXL staining in red) in the liver and (H and S) pancreas; the dashed lines mark Langerhans islets (scale bars = 100 µm). (I and T) Intestinal whole-mounts stained for blood (CD31, green) and lymphatic (LYVE1, red) vessels and their quantification (scale bar = 200 µm). (J and U) EC staining with isolectin B4 (iB4, white) in retinal whole-mounts and their quantification. A, arteries; V, veins. Only the superficial plexus is shown (scale bars = 500 µm, insets = 200 µm). (K and V) Tracheal whole-mount staining and quantification of blood and lymphatic vessels (CD31, green; LYVE1, white; scale bar = 200 µm). EMCN: endomucin; PODXL: podocalyxin. Error bars = mean ± SEM. Control (CTRL) = 25, R1iΔEC = 20 mice pooled from six independent experiments were used for the VEGFR1 deletions. CTRL = 18, R3iΔEC = 19 mice pooled from five independent experiments were used for the VEGFR3 deletions. Statistical significance was determined using Student’s t test (two-tailed, unpaired) with Welch’s correction in case of unequal variances. *, P < 0.05; **, P < 0.01; ***, P < 0.001. BV, blood vessel; LV, lymphatic vessel. Source data are available for this figure: SourceData FS1.
Figure 2.
Figure 2.
VEGFR1 deletion aggravates vessel regression induced by VEGFR2 loss. (A) Experimental setup. (B) Pup weights on P10. (C) Spleen and heart weights normalized to body weight. (D) Quantification of Vegfr transcripts normalized to 36b4 and Cdh5 transcripts; and Cdh5 and Pecam1 transcripts normalized to 36b4 transcripts. (E) Western blots and quantifications of VEGFRs normalized to HSC70 and VE-Cadherin (VEC) in lung lysates. (F) Staining and quantification of blood vessels (EMCN, red) in kidneys and glomeruli (insets). Scale bar = 100 µm, inset = 20 µm. (G) Staining and quantification of blood vessels (PDXL, red) in the liver and (H) pancreas; dashed lines mark Langerhans islets. (I) Intestinal whole-mounts stained for blood (CD31, green) and lymphatic (LYVE1, red) vessels and their quantification. (J) EC staining with isolectin B4 (iB4, white) in retinal whole-mounts and their quantification. A, arteries; V, veins. Only the superficial plexus is shown. Scale bar = 500 µm, inset = 200 µm. (K) Tracheal whole-mount staining and quantification of blood and lymphatic vessels (CD31, green; LYVE1, white). EMCN, endomucin; PODXL, podocalyxin. Error bars = mean ± SEM (n = control [CTRL] = 21, R1R2iΔEC = 17 mice pooled from five independent experiments were used for the data shown in the panels). Statistical significance was determined using Student’s t test (two-tailed, unpaired). *, P < 0.05; **, P < 0.01; ***, P < 0.001. BV, blood vessel; LV, lymphatic vessel. Source data are available for this figure: SourceData F2.
Figure S2.
Figure S2.
Vascular phenotypes in postnatal mice after VEGFR2;VEGFR3 deletion or VEGFR1;VEGFR3 deletion. (A and L) Experimental setup. (B and M) Pup weights at P10. (C and N) Spleen and heart weights normalized to body weight. (D and O) Quantification of Vegfr transcripts. (E and P) Western blots and quantifications of VEGFR bands in lung lysates. (F and Q) Staining and quantification of blood vessels (EMCN in red) in kidneys and glomeruli (insets). Scale bar = 100 µm, inset = 20 µm. (G and R) Staining and quantification of blood vessels (PDXL in red) in the liver and (H and S) pancreas; the dashed lines mark Langerhans islets (scale bars = 100 µm). (I and T) Intestinal whole-mounts stained for blood (CD31, green) and lymphatic (LYVE1, red) vessels and their quantification (scale bar = 200 µm). (J and U) EC staining with isolectin B4 (iB4, white) in retinal whole-mounts and their quantification. A, arteries; V, veins. Only the superficial plexus is shown (scale bars = 500 µm, insets = 200 µm). (K and V) Tracheal whole-mount staining and quantification of blood and lymphatic vessels (CD31, green; LYVE1, white, scale bar = 200 µm). EMCN: endomucin; PODXL: podocalyxin. Error bars = mean ± SEM. Control (CTRL) = 16, R2R3iΔEC = 12 mice pooled from four independent experiments were used for the VEGFR2;VEGFR3 deletions. CTRL = 13, R1R3iΔEC = 11 mice pooled from three independent experiments were used for the VEGFR1;VEGFR3 deletions. Statistical significance was determined using Student’s t test (two-tailed, unpaired) with Welch’s correction in case of unequal variances. *, P < 0.05; **, P < 0.01; ***, P < 0.001. BV, blood vessel; LV, lymphatic vessel. Source data are available for this figure: SourceData FS2.
Figure 3.
Figure 3.
VEGFR1/2/3 compound deletion results in the most severe regression of blood and lymphatic vessels in postnatal mice. (A) Experimental setup. (B) Pup weights on P10. (C) Spleen and heart weights normalized to body weight. (D) Quantification of Vegfr transcripts normalized to 36b4 and Cdh5 transcripts; and Cdh5 and Pecam1 transcripts normalized to 36b4 transcripts. (E) Western blots and quantifications of VEGFRs normalized to HSC70 and VE-cadherin (VEC) in lung lysates. (F) Staining and quantification of blood vessels (EMCN, red) in kidneys and glomeruli (insets). Scale bar = 100 µm, inset = 20 µm. (G) Staining and quantification of blood vessels (PDXL, red) in the liver and (H) pancreas; dashed lines mark Langerhans islets. (I) Intestinal whole-mounts stained for blood (CD31, green) and lymphatic (LYVE1, red) vessels and their quantification. (J) EC staining with isolectin B4 (iB4, white) in retinal whole-mounts and their quantification. A = arteries, V = veins. Only the superficial plexus is shown. Scale bar = 500 µm, inset = 200 µm. (K) Tracheal whole-mount staining and quantification of blood and lymphatic vessels (CD31, green; LYVE1, white). EMCN: endomucin; PODXL: podocalyxin. Error bars = mean ± SEM (n = control [CTRL] = 21, R1R2R3iΔEC = 20 mice pooled from seven independent experiments were used for the data shown in the panels). Statistical significance was determined using Student’s t test (two-tailed, unpaired). *, P < 0.05; ***, P < 0.001. BV, blood vessel; LV, lymphatic vessel. Source data are available for this figure: SourceData F3.
Figure 4.
Figure 4.
EC apoptosis contributes to vessel regression. (A) Experimental setup. (B and C) iB4/ERG/cCasp3 triple staining and quantification in P10 retinas of the R1R2R3iΔEC pups compared with control littermates. Arrowheads indicate cCasp3/ERG double-positive endothelial nuclei. Error bars = mean ± SEM (data from n = control [CTRL] = 4, R1R2R3iΔEC = 9 mice pooled from three independent experiments). Statistical significance was determined using Student’s t test (two-tailed, unpaired). *, P < 0.05; **, P < 0.01; ***, P < 0.001.
Figure S3.
Figure S3.
VEGFR deletion levels in various tissues of adult mice. (A) qPCR analysis of Vegfr1, Vegfr2, and Vegfr3 mRNA levels on day 8 after three doses of tamoxifen in various tissues and their isolated EC populations from R1R2R3iΔEC mice and their control littermates (control [CTRL] = 3, R1R2R3iΔEC = 4 mice pooled from two independent experiments). (B) Schematic of the VEGFR deletion in adult mice. (C) Mouse weights after 8 d of gene deletion. (D) Representative Western blots and corresponding protein densitometry (total of 285 mice shown). (E) quantification of VEGFR levels in lung lysates. (F) qPCR analysis of Vegfr mRNA levels in lung, liver, and kidney lysates from the same cohorts. VEGFR1: CTRL = 21, R1iΔEC = 20 mice pooled from six independent experiments; VEGFR2: CTRL = 21, R2iΔEC = 20 mice pooled from five independent experiments; VEGFR3: CTRL = 16, R3iΔEC = 16 mice pooled from five independent experiments; VEGFR1/VEGFR2: CTRL = 19, R1R2iΔEC = 22 mice pooled from six independent experiments; VEGFR1/VEGFR3: CTRL = 20, R1R3iΔEC = 24 mice pooled from five independent experiments; VEGFR2/VEGFR3: CTRL = 14, R2R3iΔEC = 11 mice pooled from four independent experiments; and VEGFR1/VEGFR2/VEGFR3: CTRL = 31, R1R2R3iΔEC = 30 mice pooled from nine independent experiments. Statistical significance was determined using Student’s t test (two-tailed, unpaired) with Welch’s correction in cases of unequal variance. *, P < 0.05; **, P < 0.01; ***, P < 0.001. Source data are available for this figure: SourceData FS3.
Figure 5.
Figure 5.
Organotypic effects of VEGFR deletions in quiescent adult vasculature. (A–F) Representative confocal micrographs of vascular staining of (A) liver (podocalyxin, red), (B) intestine (podocalyxin, green), (C) kidney (endomucin, red), (D) pancreas (podocalyxin, red), (E) trachea (podocalyxin, green), and (F) retina (isolectin B4 [iB4], white) tissues from adult mice deleted of single, double, or triple combinations of Vegfrs. The corresponding quantifications are shown in Fig. S4. Insets in C show close-up images of kidney glomeruli; Langerhans islets are demarcated by the dashed lines in D. Scale bars = 200 μm (B, E, and F), 100 μm (A, C, and D), and 50 μm (insets in C). Deep p., deep plexus.
Figure S4.
Figure S4.
Effect of VEGFR deletion on vascular density in various tissues in adult mice. Data in addition to Fig. 5. (A) Representative confocal micrographs of whole-mounted ears stained for CD31 (green, all vessels), and LYVE1 (white, lymphatic vessels). Scale bars = 200 μm. (B) Vessel density quantifications from the ear whole-mounts in A. (C–H) Vascular density quantifications from liver (C), intestine (D), kidney (E, total and glomerular [Glom.]), pancreas (F), trachea (G, blood and lymphatic vessels), and superficial (Sup.) and deep plexus in the retina (H). The heatmap in Fig. 6 provides comparison of the corresponding percent changes in the vascular densities. VEGFR1: control (CTRL) = 14–21, R1iΔEC = 14–20 mice pooled from four to six independent experiments; VEGFR2: CTRL = 10–21, R2iΔEC = 10–20 mice pooled from three to five independent experiments; VEGFR3: CTRL = 9–16, R3iΔEC = 7–16 mice pooled from three to five independent experiments; VEGFR1/VEGFR2: CTRL = 16–19, R1R2iΔEC = 15–22 mice pooled from five or six independent experiments; VEGFR1/VEGFR3: CTRL = 17–20, R1R3iΔEC = 20–24 mice pooled from four or five independent experiments; VEGFR2/VEGFR3: CTRL = 14, R2R3iΔEC = 11 mice pooled from four independent experiments; and VEGFR1/VEGFR2/VEGFR3: CTRL = 12–31, R1R2R3iΔEC = 11–30 mice pooled from three to nine independent experiments. Statistical significance was determined using Student’s t test (two-tailed, unpaired) with Welch’s correction in cases of unequal variance. *, P < 0.05; **, P < 0.01; ***, P < 0.001. BV, blood vessel; LV, lymphatic vessel; EMCN, endomucin; PDXL, podocalyxin.
Figure 6.
Figure 6.
Quantification of changes in vascular density after Vegfr deletions. Heatmap summary of percent changes in blood vascular densities in postnatal (P) and adult (A) mice quantified from single, double, and triple compound deletions of the VEGFRs in liver, intestine, kidney (total and glomerular), pancreas (total and Langerhans islet–specific), trachea, retina (superficial and deep plexus), and heart tissues. Color scale indicates increased (red) or decreased (blue) vascular area; numbers indicate the percent change as compared with littermate controls. VEGFR1: control [CTRL] = 11–21, R1iΔEC = 10–20 mice pooled from four to six independent experiments; VEGFR2: CTRL = 10–21, R2iΔEC = 10–20 mice pooled from three to five independent experiments; VEGFR3: CTRL = 9–16, R3iΔEC = 7–16 mice pooled from three to five independent experiments; VEGFR1/VEGFR2: CTRL = 10–19, R1R2iΔEC = 12–22 mice pooled from three to six independent experiments; VEGFR1/VEGFR3: CTRL = 13–20, R1R3iΔEC = 15–24 mice pooled from three to five independent experiments; VEGFR2/VEGFR3: CTRL = 11–14, R2R3iΔEC = 9–11 mice pooled from three or four independent experiments; and VEGFR1/VEGFR2/VEGFR3: CTRL = 12–31, R1R2R3iΔEC = 11–30 mice pooled from three to nine independent experiments. Asterisks indicate statistical significance (Student’s t test; two-tailed, unpaired). *, P < 0.05; **, P < 0.01; ***, P < 0.001.
Figure 7.
Figure 7.
Organ-specific temporal responses in VEGFR1/2/3 compound deletion. (A) Representative confocal micrographs and quantifications showing rapid regression of small intestine vasculature 24 h after 4-OHT administration to R1R2R3iΔEC pups (n = 3) compared with littermate controls (n = 3). Scale bar = 200 μm. (B) Western blots and quantification of VEGFRs normalized to HSC70 and VE-cadherin (VEC) in lung lysates at 24 h (control n = 6, R1R2R3iΔEC n = 6, two independent experiments). (C) Representative confocal micrographs and quantification showing regression of hepatic vasculature 48 h after tamoxifen (TAM) administration to R1R2R3iΔEC (n = 3) adult mice and controls (n = 3). Scale bar = 100 μm. (D) Western blots and quantifications of VEGFRs in lung lysates at 48 h in R1R2R3iΔEC (n = 2) and control mice (n = 2). (E) Experimental setup, Western blots, and quantification of VEGFRs in lung lysates after 4 wk of Vegfr deletions in R1R2R3iΔEC (n = 4–6) and control mice (n = 6). (F) Representative images and quantification of dermal and retinal vasculature and changes in hepatic gross morphology after 4 wk of deletion. Blood vessels are stained for podocalyxin (PDXL), PECAM1 (CD31), or isolectin B4 (iB4), and lymphatic vessels are stained for LYVE1. Scale bars = 200 μm (ear images) and 100 μm (retina images). Error bars = mean ± SEM. Statistical significance was determined using Student’s t test (two-tailed, unpaired). *, P < 0.05; ***, P < 0.001. Source data are available for this figure: SourceData F7.
Figure 8.
Figure 8.
ScRNAseq analysis of cardiac and pulmonary ECs from mice with single and compound deletion of VEGFRs. (A) Experimental outline. Cardiac and pulmonary ECs of mice were harvested 48 h after Vegfr deletion and subjected to scRNAseq. (B and C) UMAP plots and cluster specific markers from cardiac (B) and pulmonary ECs (C), aggregated from control samples. Cap., capillary; NK, natural killer.
Figure S5.
Figure S5.
Feature scRNAseq heatmaps visualizing the expression of Flt1, Kdr, Flt4, and Cdh5 in cardiac and pulmonary ECs of mice with single and compound deletions of VEGFRs versus their controls. (A and B) Cardiac (A) and pulmonary EC (B) datasets are shown. Gene expression scale: low (blue) to high (red). (C) Violin plots for Kdr expression in the R2iΔEC dataset shown in B, suggesting incomplete deletion of Kdr. qPCR of the deleted exon in ECs isolated from the same mice indicates almost complete deletion of exon 3. (D) Violin plots for Kdr expression in the R1R2R3iΔEC dataset and qPCR of exon 30 versus exon 3 sequences. CTRL, control; DEL, deletion.
Figure 9.
Figure 9.
RNA velocity analysis of cardiac EC III and EC IV arterial clusters in R1R2R3iΔEC mice. Note the loss of directionality of the velocity vectors in the R1R2R3iΔEC cardiac arterial EC clusters in comparison to the control (circled in blue).

Comment in

References

    1. Alitalo, K. 2011. The lymphatic vasculature in disease. Nat. Med. 17:1371–1380. 10.1038/nm.2545 - DOI - PubMed
    1. Ambati, B.K., Nozaki M., Singh N., Takeda A., Jani P.D., Suthar T., Albuquerque R.J., Richter E., Sakurai E., Newcomb M.T., et al. . 2006. Corneal avascularity is due to soluble VEGF receptor-1. Nature. 443:993–997. 10.1038/nature05249 - DOI - PMC - PubMed
    1. Amit, I., Wides R., and Yarden Y.. 2007. Evolvable signaling networks of receptor tyrosine kinases: relevance of robustness to malignancy and to cancer therapy. Mol. Syst. Biol. 3:151. 10.1038/msb4100195 - DOI - PMC - PubMed
    1. Augustin, H.G., and Koh G.Y.. 2017. Organotypic vasculature: From descriptive heterogeneity to functional pathophysiology. Science. 357:eaal2379. 10.1126/science.aal2379 - DOI - PubMed
    1. Benedito, R., Rocha S.F., Woeste M., Zamykal M., Radtke F., Casanovas O., Duarte A., Pytowski B., and Adams R.H.. 2012. Notch-dependent VEGFR3 upregulation allows angiogenesis without VEGF-VEGFR2 signalling. Nature. 484:110–114. 10.1038/nature10908 - DOI - PubMed

Publication types

MeSH terms

Substances