. 2022 Apr 15;149(8):dev200013.
doi: 10.1242/dev.200013. Epub 2022 Feb 17.

Immune landscape of human placental villi using single-cell analysis

Affiliations

Immune landscape of human placental villi using single-cell analysis

Jessica M Toothaker et al. Development. .

Abstract

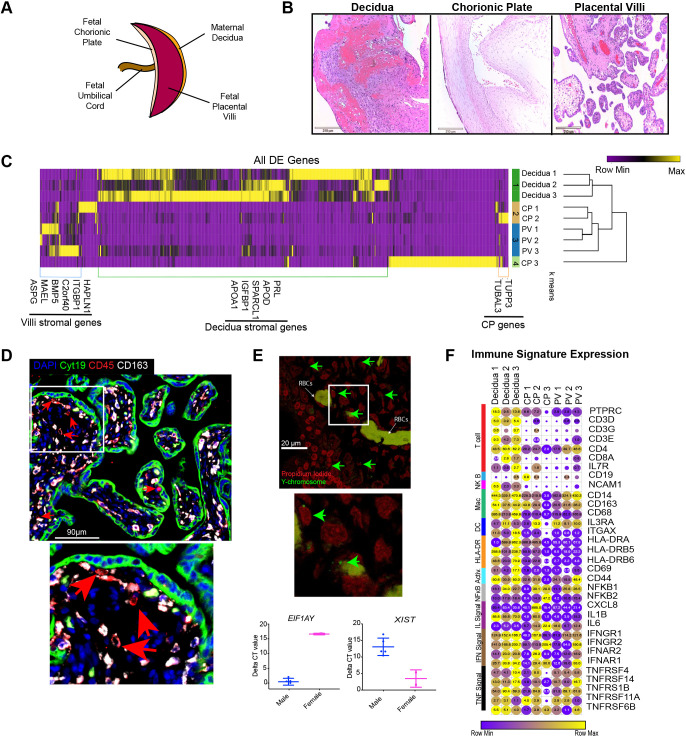
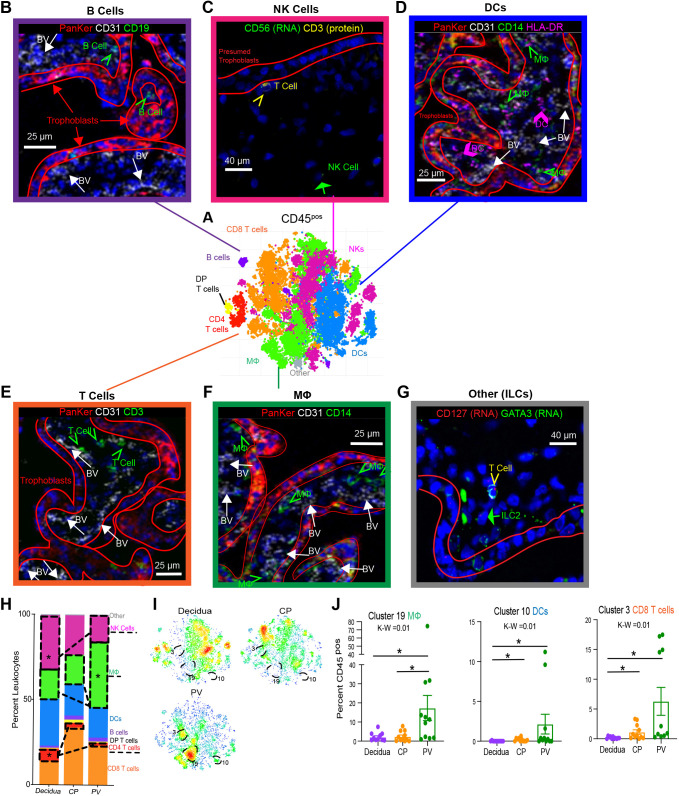
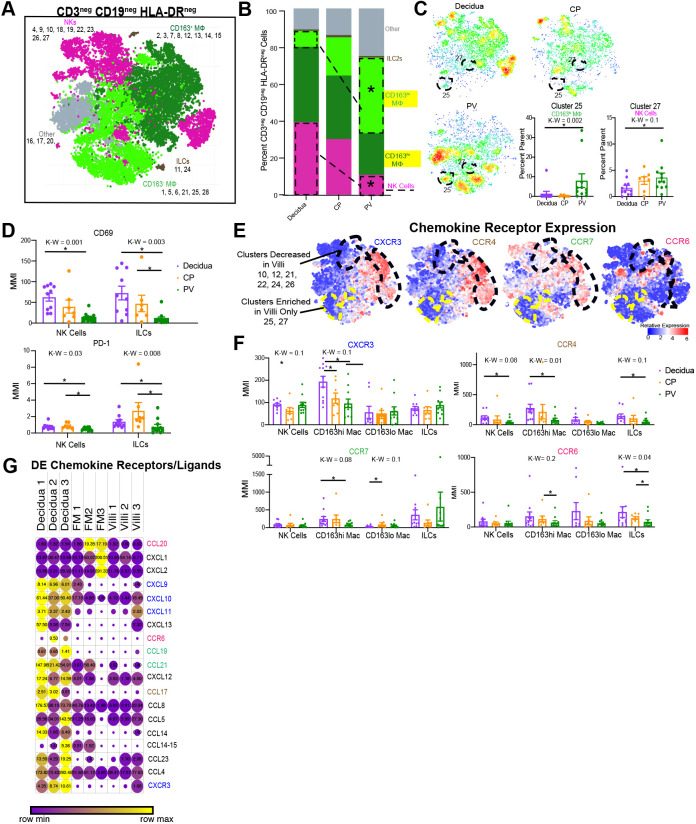
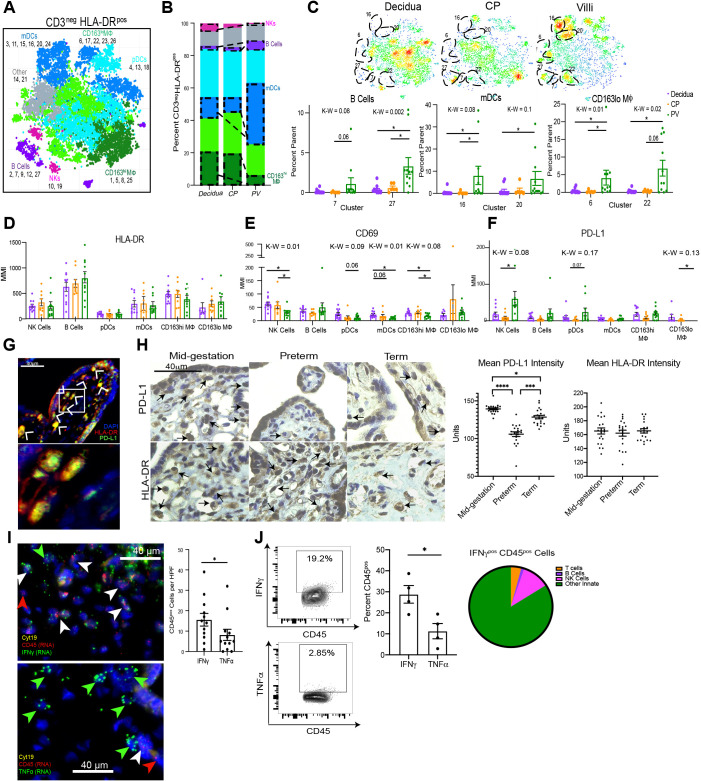
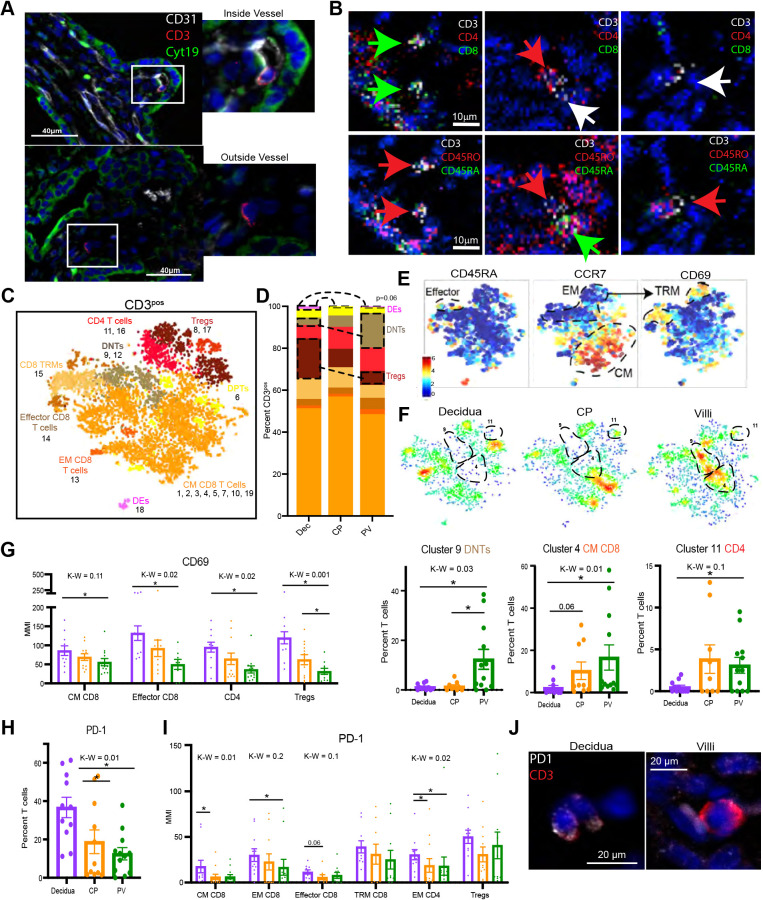
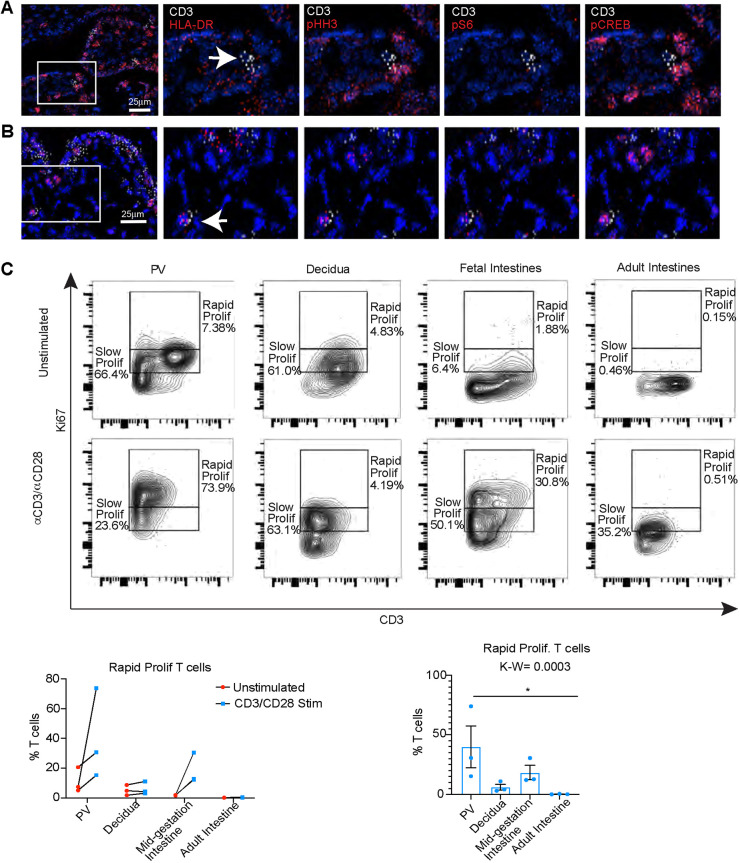
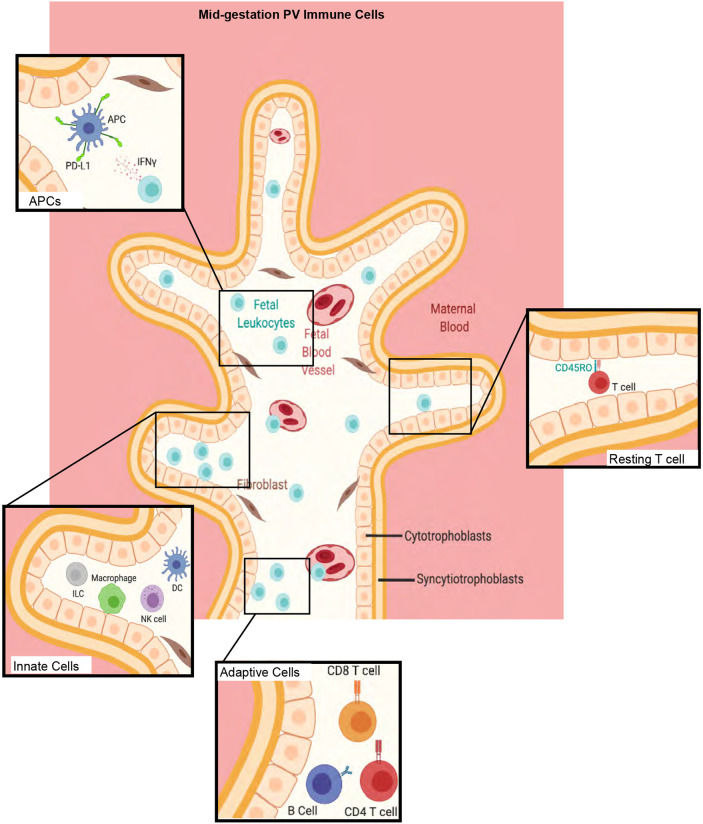
Maintenance of a healthy pregnancy is reliant on a successful balance between the fetal and maternal immune systems. Although the maternal mechanisms responsible have been well studied, those used by the fetal immune system remain poorly understood. Using suspension mass cytometry and various imaging modalities, we report a complex immune system within the mid-gestation (17-23 weeks) human placental villi (PV). Consistent with recent reports in other fetal organs, T cells with memory phenotypes, although rare in abundance, were detected within the PV tissue and vasculature. Moreover, we determined that T cells isolated from PV samples may be more proliferative after T cell receptor stimulation than adult T cells at baseline. Collectively, we identified multiple subtypes of fetal immune cells within the PV and specifically highlight the enhanced proliferative capacity of fetal PV T cells.

Keywords: Immune cells; Placenta; Pregnancy; T cells.


Conflict of interest statement

Competing interests The authors declare no competing or financial interests.

Figures

Fig. 1.
Fig. 1.
Tissue-specific signatures in the mid-gestation placenta. (A) Diagram of placental tissues. (B) Hematoxylin & Eosin staining of placental tissues (n=19). (C) All differentially expressed genes between placental tissues with P<0.05, false-discovery rate<20% and fold change>absolute value 2 (n=3). (D) CD45pos CD163lo/neg cells within the intravillous space identified with immunofluorescence (n=19). (E) Top: Fluorescence in situ hybridization of Y chromosome in PV. Bottom: Delta CT values of Y (left) and X (right) chromosome genes in male and female PV (n=1 male, 1 female). (F) Expression values of selected immune genes. Circle size indicates expression value. Circle color indicates relative expression across row. n=3 per tissue type. DE, differentially expressed. Graphs show mean±s.e.m.
Fig. 2.
Fig. 2.
Global immune landscape of second trimester placenta. (A) Merged t-distributed stochastic neighbor embedding (t-SNE) of CD45pos cells from maternal decidua (n=11), CP (n=11) and PV (n=11) from PhenoGraph clustering of CyTOF data. (B) IMC identifying B cells (green arrows) located within the trophoblast boundary (red outlines) and outside the fetal blood vessels (BV) (white arrows). PanKer, pan-keratin (stains for trophoblasts). (C) Dual in situ hybridization and IF identifying NK cells (green arrow) distinct from T cells (yellow arrowhead) in PV. (D) IMC identifying DCs (pink arrows) and HLA-DRpos macrophages (green arrows). (E) IMC identifying T cells (green arrows). (F) IMC identifying macrophages (green arrows). (G) Dual in situ hybridization and IF identifying ILC2s (green arrow) distinct from T cells (yellow arrowhead) in PV. (H) Stacked bar graph summarizing all clusters belonging to the same immune subsets from CyTOF data. (I) Density plot of the populations shown in A segregated by tissue of origin. Clusters significantly enriched in the PV are outlined. (J) Quantification of PV-enriched cluster abundance. K-W, Kruskal–Wallis test. *P<0.05 following post-hoc analysis. Graphs show mean±s.e.m. Mφ, macrophage.
Fig. 3.
Fig. 3.
Innate HLA-DRneg cells in PV. (A) Combined CyTOF t-SNE for CD45pos CD3neg CD19neg HLA-DRneg cells (n=12). (B) Stacked bar graph showing the abundance of major immune subtypes. (C) Density plots separated by tissue of the cell populations shown in A. Statistically significantly abundant clusters in the PV are outlined. Graphs show cumulative data of PV-abundant clusters (outlined in the density plots). (D) MMI of CD69 (top) and PD-1 (bottom) for 2D-gated NK and ILC populations. (E) Expression heatmaps for chemokine receptors mapped to the cells identified in A. (F) MMIs of chemokine receptors on innate cell subsets from 2D gating. (G) Expression from RNAseq of differentially expressed chemokine ligand/receptor genes between tissues (n=3). Circle size indicates expression value, and circle color reflects relative expression across row. Differentially expressed genes were determined as: P<0.05, false-discovery rate<20% and fold change>absolute value 2. *P<0.05 upon post-hoc analysis after Kruskal–Wallis (K-W) test. DE, differentially expressed. Graphs show mean±s.e.m. Mac, macrophages.
Fig. 4.
Fig. 4.
Antigen-presenting cells in the PV. (A) Cumulative CyTOF t-SNE for CD45pos CD3neg HLA-DRpos cells. (B) Stacked bar graph showing the abundance of major immune subtypes. (C) Top: Density plots separated by the tissue of origin from the data shown in A. Statistically significantly abundant clusters in the PV are outlined. Bottom: Cumulative data of PV abundant clusters (outlined in density plots). (D-F) MMI of HLA-DR (D), CD69 (E) and PD-L1 (F) for 2D-gated populations. *P<0.05 upon post-hoc analysis after Kruskal–Wallis (K-W) test. (G) PD-L1pos APC populations in PV. Boxed area is shown at higher magnification below. Arrowheads indicate positive staining of the transcript marked by the same color in the image key. (H) Representative images (left) and quantification of average stain intensity per stromal nuclei (right) for PD-L1 and HLA-DR IHC. n=2. (I) Representative images (left) and quantification of automated image analysis with CellProfiler (right) for dual RNA in situ hybridization and immunofluorescence in PV (n=12). (J) Flow plots and quantification for cytokine-positive PV immune cells by flow cytometry. n=4. Pie-chart shows major immune subset abundance of IFNγpos immune cells from flow cytometry. *P<0.05, ***P<0.001 and ****P<0.0001 (Mann–Whitney test). K-W, Kruskal–Wallis test P-value. CyTOF analysis starting with n=12 for each analysis; see Table S5 for omitted cases. Graphs show mean±s.e.m.
Fig. 5.
Fig. 5.
T cell subsets in placental tissues. (A) Representative images of T cells inside (top) and outside (bottom) fetal vasculature (CD31) in PV. (B) IMC images of T cell subtypes in PV. Green arrows indicate CD8pos (top) or CD45RApos (bottom), red arrows indicate CD4pos (top) or CD45ROpos (bottom) and white arrows indicate CD3pos (T cells). (C) Cumulative CyTOF t-SNE for PV, CP and decidua CD45pos CD3neg HLA-DRpos cells. (D) Stacked bar graph showing the abundance of major immune subtypes. (E) Relative expression of memory T cell markers in the PV cell populations shown in C. (F) Density plot separated by tissue of origin (C). Statistically significantly abundant clusters in the PV are outlined. Graphs show cumulative data of PV-abundant clusters (outlined in density plots). (G) MMI of CD69 from 2D gating of populations. (H) Abundance of PD-1pos T cells by 2D gating. (I) PD-1 MMI from 2D-gated subsets. CyTOF analysis starting at n=12 for each analysis; see Table S5 for omitted cases. (J) PD-1 expression on T cells in PV and decidua. *P<0.05 upon post-hoc analysis after Kruskal–Wallis (K-W) test. CM, central memory; EM, effector memory; TRM, tissue-resident memory. Graphs show mean±s.e.m.
Fig. 6.
Fig. 6.
T cell activation in PV. (A) IMC images of inactive T cells in PV. (B) IMC images of activated T cells in PV. In A,B, boxed areas are shown at higher magnification in images to the right. Arrows indicate CD3pos (T cells). (C) Flow plots (top) and quantification (bottom) for proliferating (Ki67hi) T cells after stimulation across the tissues indicated. n=3 (all experiments). Graphs show mean±s.e.m.
Fig. 7.
Fig. 7.
Summary of major findings in study. Schematic of immune cell populations identified in the PV in this study. Image created with BioRender.com.

References

    1. Aagaard, K., Ma, J., Antony, K. M., Ganu, R., Petrosino, J. and Versalovic, J. (2014). The placenta harbors a unique microbiome. Sci. Transl. Med. 6, 237ra65. 10.1126/scitranslmed.3008599 - DOI - PMC - PubMed
    1. Aghaeepour, N., Ganio, E. A., Mcilwain, D., Tsai, A. S., Tingle, M., Van Gassen, S., Gaudilliere, D. K., Baca, Q., McNeil, L., Okada, R.et al. (2017). An immune clock of human pregnancy. Sci. Immunol. 2, eaan2946. 10.1126/sciimmunol.aan2946 - DOI - PMC - PubMed
    1. Angelo, L. S., Bimler, L. H., Nikzad, R., Aviles-Padilla, K. and Paust, S. (2019). CXCR6+ NK cells in human fetal liver and spleen possess unique phenotypic and functional capabilities. Front. Immunol. 10, 469. 10.3389/fimmu.2019.00469 - DOI - PMC - PubMed
    1. Bonney, E. A., Pudney, J., Anderson, D. J. and Hill, J. A. (2000). Gamma-delta T cells in midgestation human placental villi. Gynecol. Obstet. Invest. 50, 153-157. 10.1159/000010315 - DOI - PubMed
    1. Buggert, M., Vella, L. A., Nguyen, S., Wu, V. H., Chen, Z., Sekine, T., Perez-Potti, A., Maldini, C. R., Manne, S., Darko, S.et al. (2020). The identity of human tissue-emigrant CD8+ T cells. Cell 183, 1946-1961.e15. 10.1016/j.cell.2020.11.019 - DOI - PMC - PubMed

Publication types

MeSH terms